


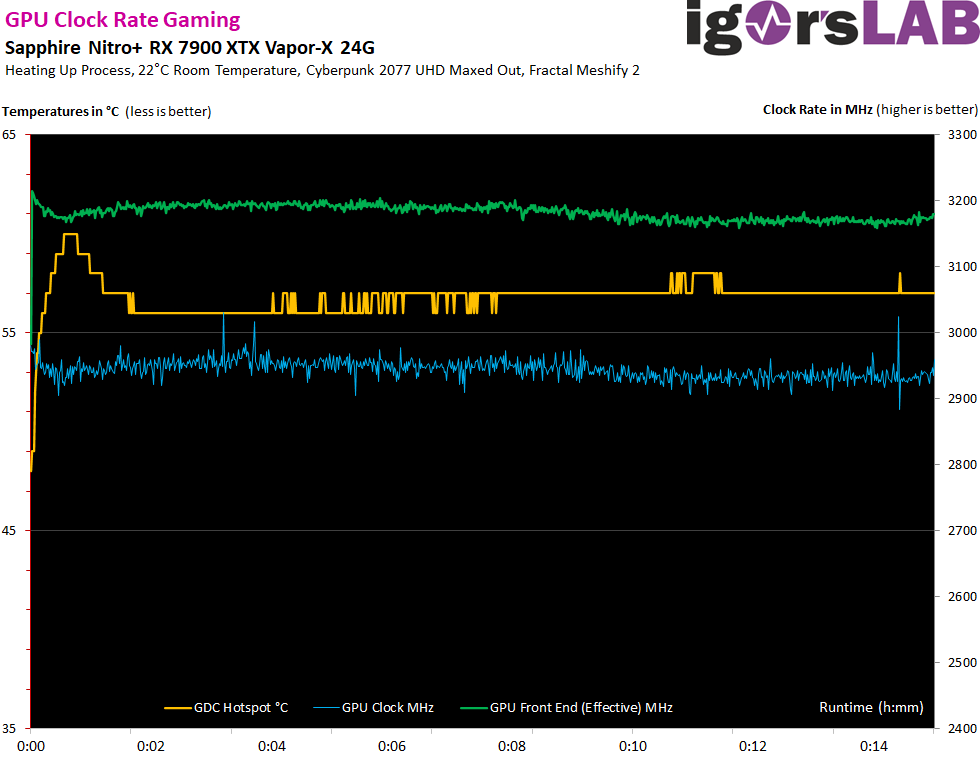
Real achievable clock rates and overclocking
That with the real clock rates and the readout is arg Fancy. I have coupled my own PDM with HWInfo64 for this, because most tools don’t show the frequencies correctly. AMD talks once about the much lower GPU clock and once about the so-called GPU front-end clock, which should be something like an effective clock. Interestingly, the peaks of the Sapphire Nitro+ Radeon RX 7900 XTX Vapor-X 24 GB are clearly above those that I measured in the reference card and also in total, the Sapphire Nitro+ Radeon RX 7900 XTX Vapor-X 24 GB is clearly faster, because it is also more constant. After all, the 3 GHz limit is reached now and then under load and in ultra HD without any further intervention.
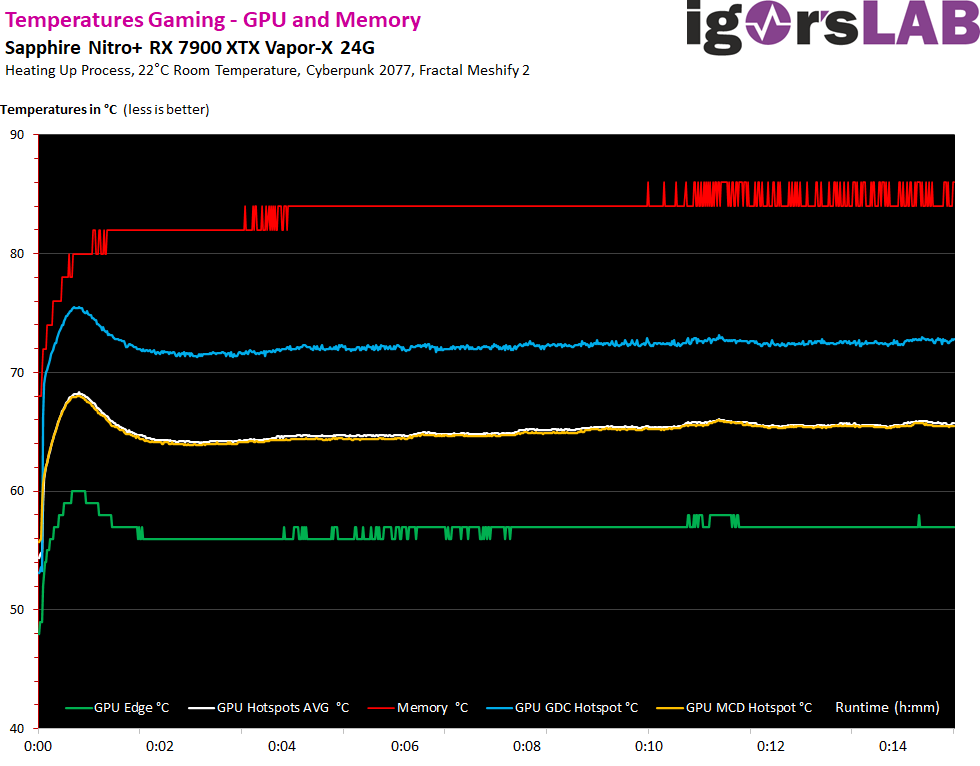
GPU temperatures in the case
The differences aren’t as big as feared if you use a decent case. Because in the end, the card doesn’t convert much more waste heat than the bloated predecessor models or my MSI RX 6950XT Gaming X Trio. If you close the panel, the GPU temperature (Edge) increases by 2 to 3 Kelvin, and the GDC hotspot increases by up to 5 Kelvin. This is all in the deep green range and looks better than AMD’s reference. Only the memory temperatures of up to 86 °C are too much for the potent cooler. Considering (we remember the teardown) that the RAM is cooled directly via the vapor chamber, the result in the substrate seems a bit too high.
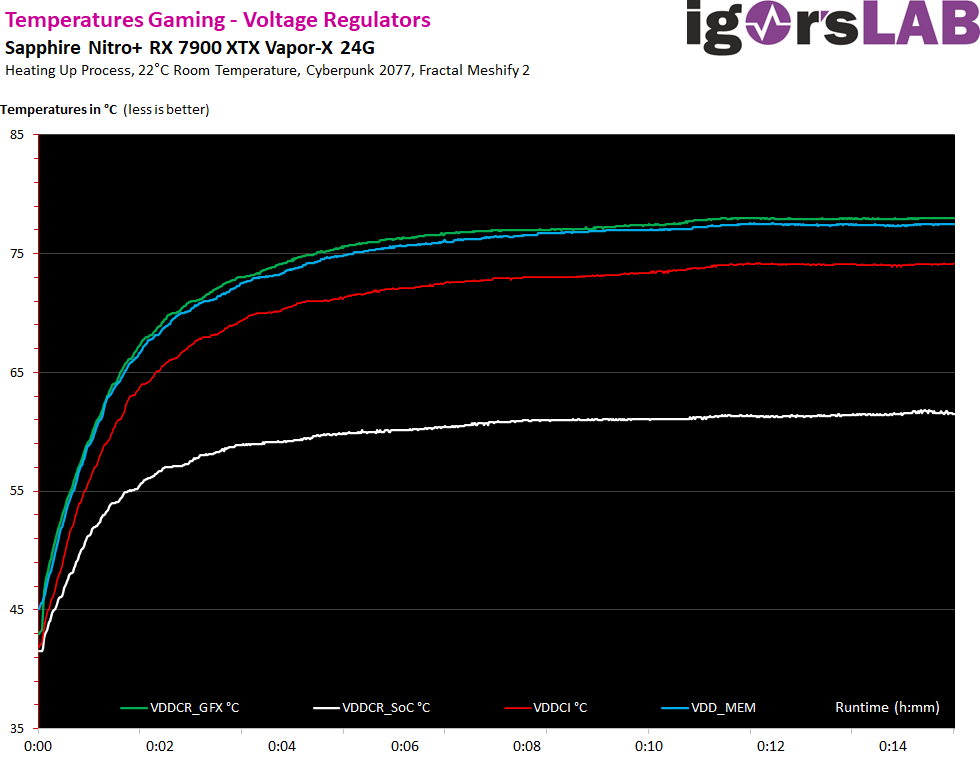
VRM temperatures in the case
Since AMD has to monitor all voltage converters in order to fulfill the goal of a TBP estimation as well as possible, values for the temperatures drop here as well. These in turn can now also be read out via Sensor Loop and they show that the VRMs all stay cool enough, even at values far above 400 watts.
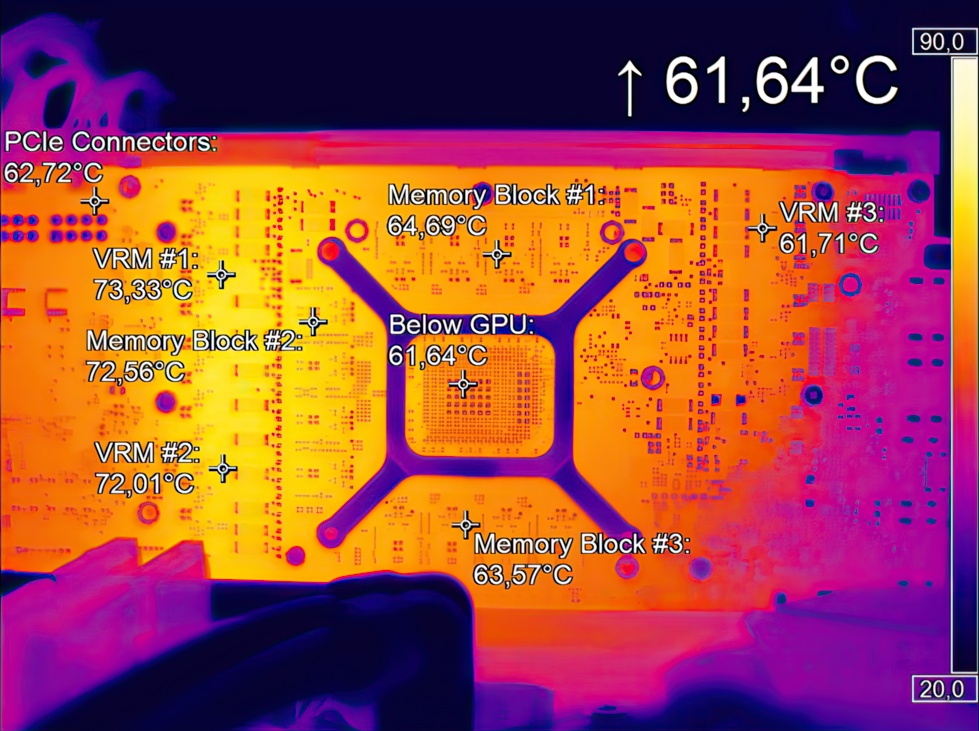
Infrared measurements (heat flow analysis)
Let’s start with the Gaming Loop and we can see that it is almost warmer below the base than in the GPU, which is not surprising. Sapphire has designed the fan control to be very reactive, which we will take a closer look at in the next chapter.
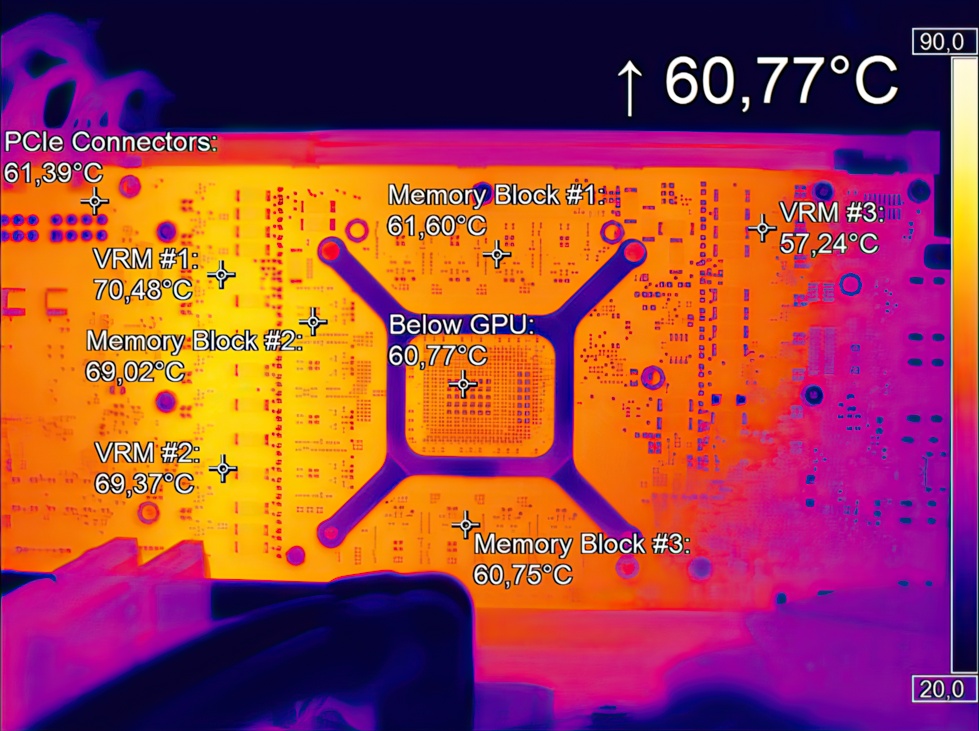
The temperatures increase a bit in the stress test, but the same applies here. Balancing act between cooling performance and fan noise.
- 1 - Introduction, technical data and technology
- 2 - Teardown: PCB and components
- 3 - Teardown: Cooler and disassembly tips
- 4 - Gaming Performance Full-HD (1920 x 1080)
- 5 - Gaming Performance WQHD (2560 x 1440)
- 6 - Summe Gaming-Performance Ultra-HD (3840 x 2160)
- 7 - Power consumption and load balacing
- 8 - Load peaks, capping and power supply recommendation
- 9 - Temperatures, clock rates and infrared analysis
- 10 - Fan curves and volume
- 11 - Summary and conclusion


200 Antworten
Kommentar
Lade neue Kommentare
Mitglied
Veteran
Urgestein
Mitglied
Veteran
Urgestein
Urgestein
1
Veteran
Urgestein
1
Urgestein
Veteran
Urgestein
Urgestein
Urgestein
Mitglied
Urgestein
Alle Kommentare lesen unter igor´sLAB Community →