


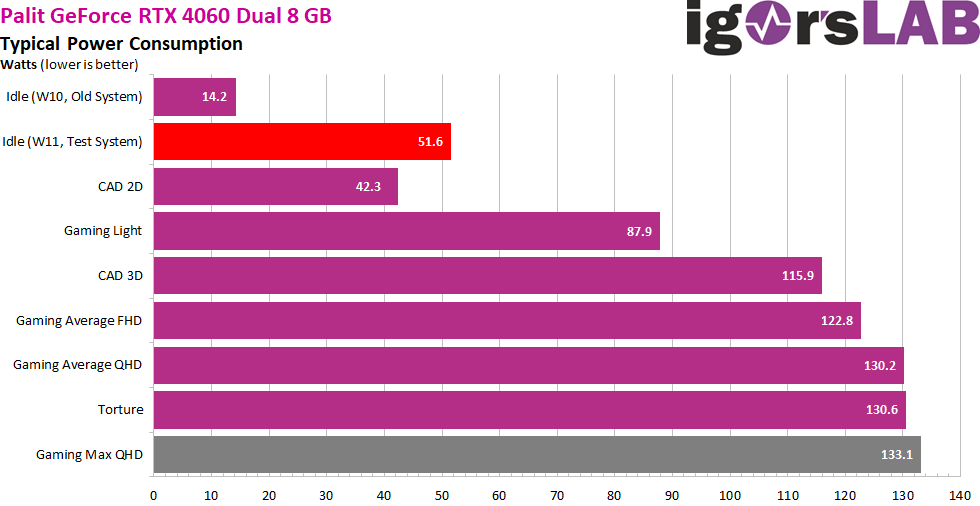
Power consumption in factory state as a summary
The roughly 52 watts at idle is an imposition. I have already communicated the entire problem of the power consumption, i.e. the significantly higher values in gaming (up to 133 watts e.g. in Cyberpunk 2077 or Horizon Zero Dawn) with the non-OC card as well as the insanely high values in idle, to NVIDIA last (!) week, but have not received a satisfactory answer until today. However, it seems to be a homemade driver problem, because on one of my oldest systems and Windows, the card was satisfied with 14 watts.
It could certainly have been 10 or 11 watts, if the voltage converters of the Palit card had been more efficient and the PWM controller could also switch off phases. I have communicated with many colleagues and all had the same problem in idle. So I am not an exception, but unfortunately the rule. Because there were also situations on the current systems, where suddenly 14 watts were measured again, but still 52 watts were shown in the NVAPI. Do we have to understand this? Probably not!
By the way, we can see very nicely that the full TBP of 115 is almost always exceeded, even with the rather undemanding AutoCAD. Even the measured values of NVIDIA’s PCAT and Powenetics V2 confirm my results and clearly refute NVIDIA’s own values via the NVAPI interface. Whoever came up with this should have known that something like this would be noticed. But it fits well to the PR slide with the funny power saving plan.
Load distribution between PCIe slot and the PCIe sockets
NVIDIA uses the PCIe slot a bit, especially for gaming. But you are still far below what is allowed with 5.5 amps maximum in the flowing currents, even with the increased power limit.
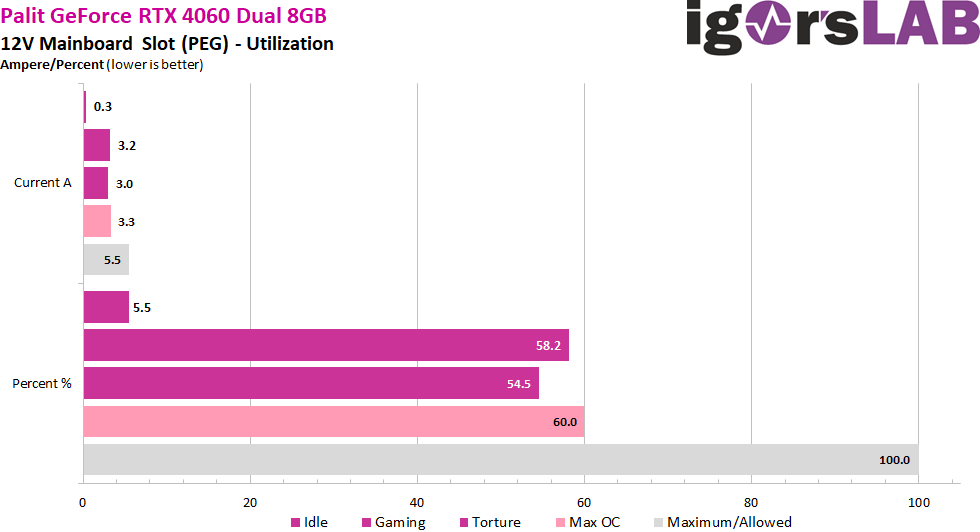
While NVIDIA has significantly reduced the supply via the PEG, AMD continues to use this rail quite excessively.

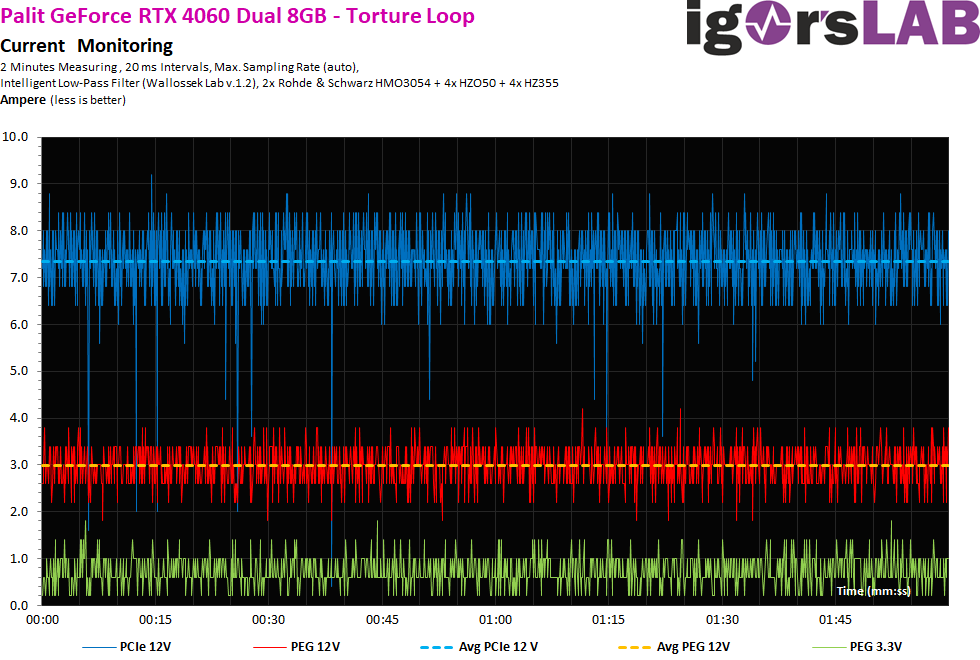
Rough 20-ms intervals
Let’s first take a look at the flowing currents. Measurements were taken in coarser 20-ms intervals, i.e. around 50 times per second, to simulate the load on the supervisor chip of the power supplies (shutdown). We see that even short load peaks are capped at 13 A at the latest. but a real limitation looks different.
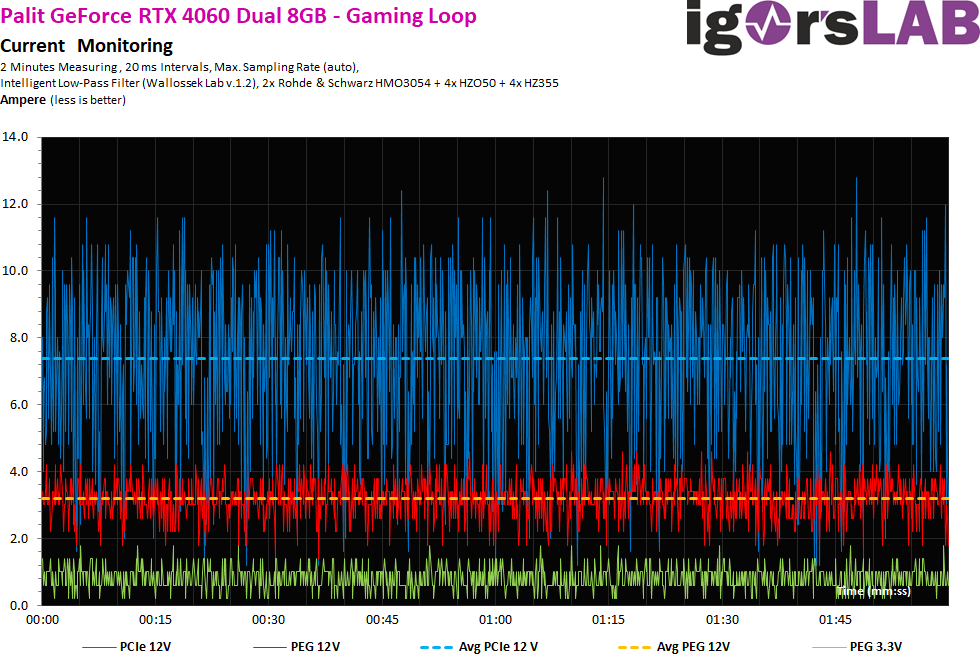
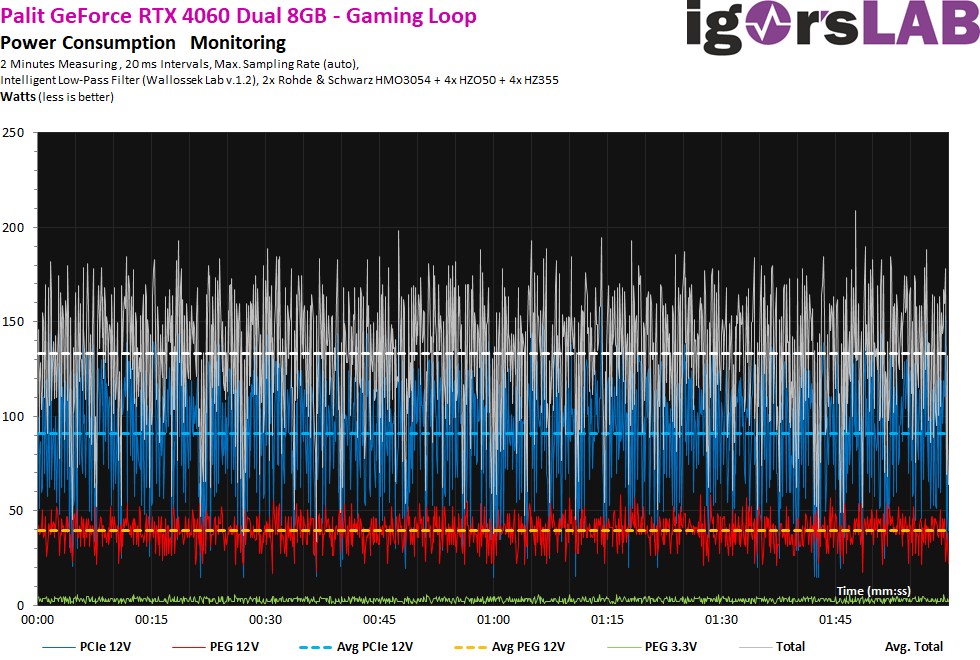
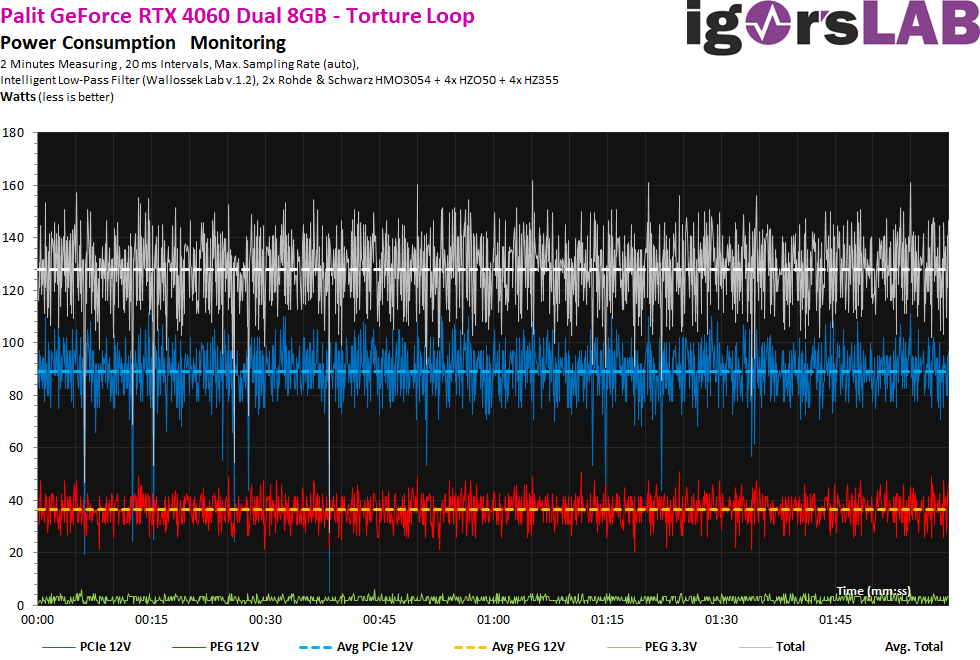
Nevertheless, we still have to take a look at the voltages, or the product of voltage and current flow. I already wrote that I measured here at different power supply connections, even if in the end on the board of the graphics card all connections meet again somehow. What we can see here now as much clearer fluctuations and peaks is due to the partially a little bit overvolting power supply and thus the voltage and not the currents. This is due to technical reasons, but it’s not a big deal. However, we can also see that the few peaks at a bit over 200 watts are not caused by the flowing current (graphics card), but actually result from the power supply! This is also due to the topology and especially the rather puny input filter with only one coil on the single rail.
The torture test is hardly any different.
If you now add the voltage again, then you see a stronger ripple, which again results from the somewhat jittery operating voltage. However, to save the power supply’s honor, it has to be said that this affects all current products of all manufacturers and can hardly be avoided.

- 1 - Introduction, technical data and technology
- 2 - Test system in the igor'sLAB MIFCOM PC
- 3 - Teardown: PCB, components and cooler
- 4 - Gaming performance FHD (1920 x 1080)
- 5 - Gaming performance WQHD (2560 x 1440)
- 6 - Gaming performance DLSS vs. DLSS3 vs. FSR
- 7 - Latency and DLSS 3.0
- 8 - Power consumption and load balancing
- 9 - Transients, cutting and PSU recommendation
- 10 - Temperatures, clock speeds, fans and noise
- 11 - Summary and conclusion


44 Antworten
Kommentar
Lade neue Kommentare
Neuling
1
Neuling
Neuling
Urgestein
Moderator
Urgestein
1
Urgestein
Urgestein
Veteran
Mitglied
1
Mitglied
Urgestein
Urgestein
Urgestein
Mitglied
1
Alle Kommentare lesen unter igor´sLAB Community →