


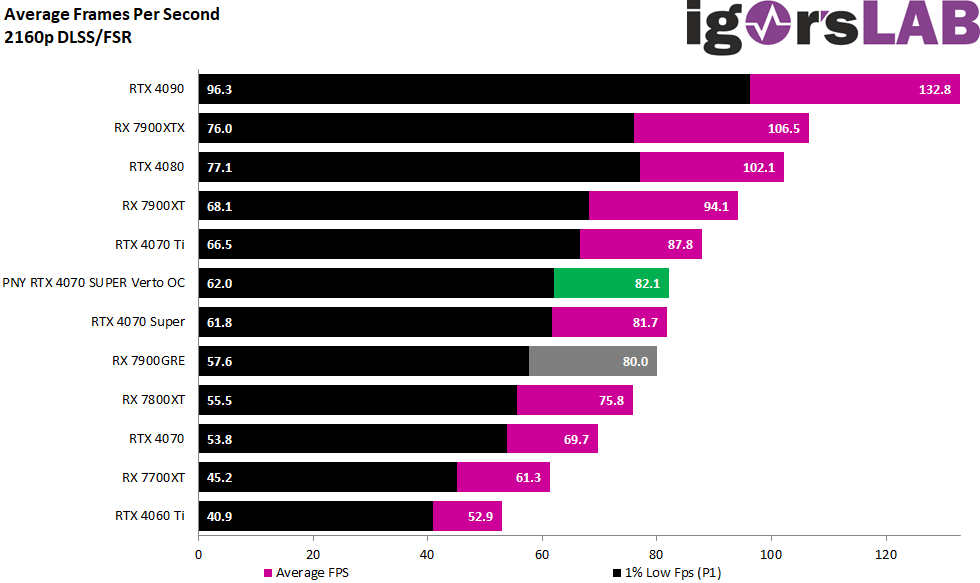
If it’s not enough for native Ultra HD or you want to dominate the ultimate FPS chart show in WQHD, you have to resort to AI-based super sampling. Both NVIDIA and AMD offer the right tools for this with DLSS and FSR respectively.
Sum of all games
I normalized the FPS and percentiles again and formed a geometric mean (Geomean) because this is simply more accurate from a statistical point of view and is also used in the industry. And yes, something is happening, because the bars are getting longer again:
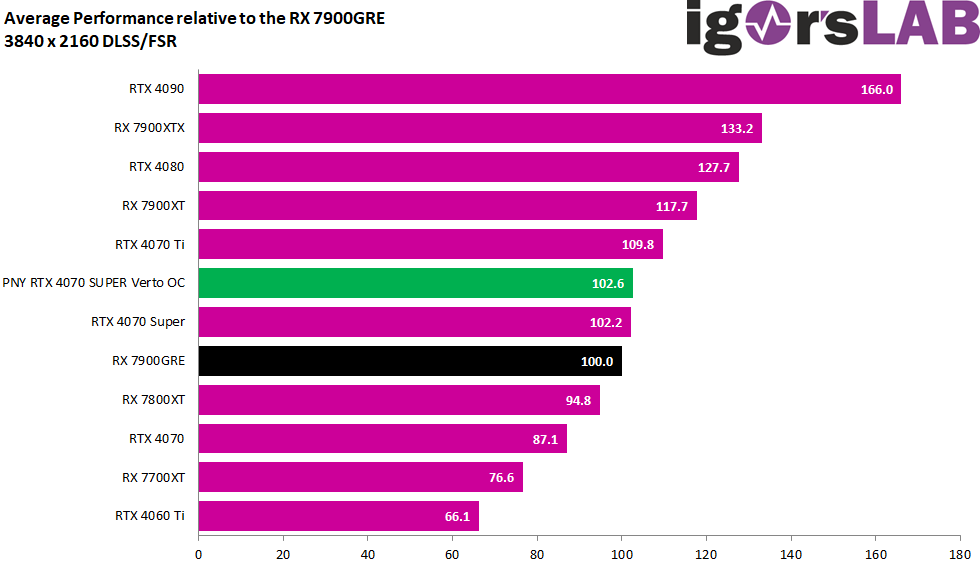
The performance and therefore also the order are similar to the values in WQHD. The rest is again self-explanatory.
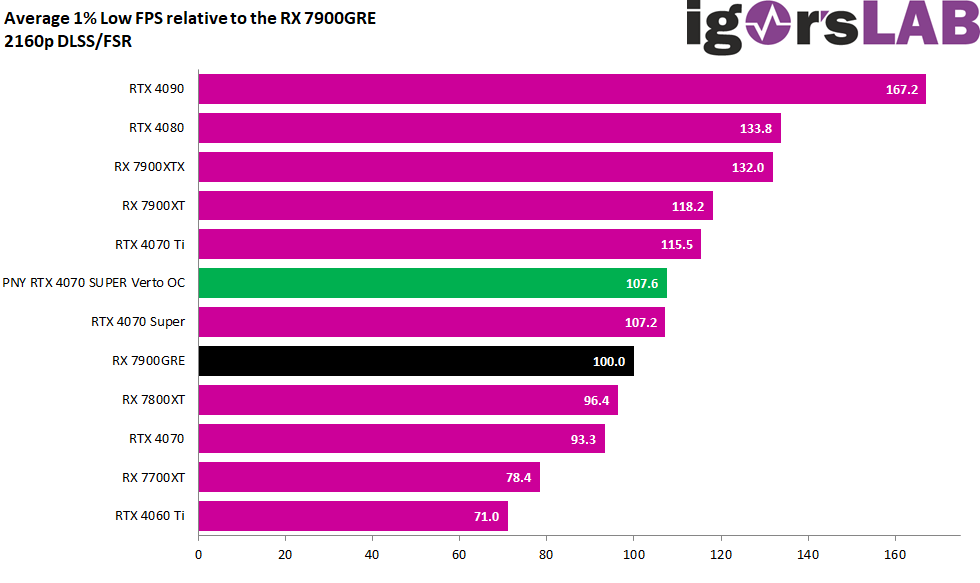
With the P1, the lead over the RX 7900GRE increases to 7.6 percent, which is quite respectable.
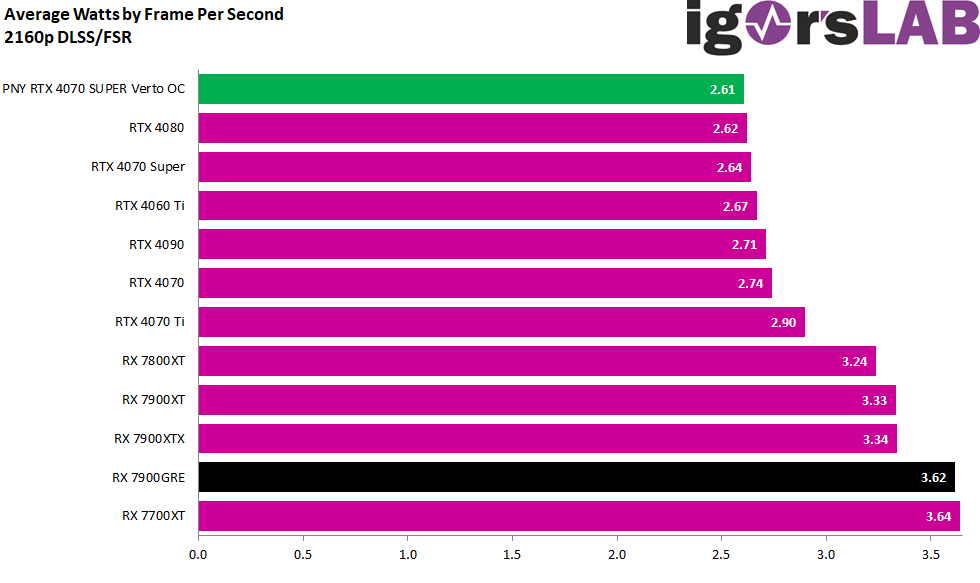
The power consumption is once again the disadvantage of the RX 7900GRE, which requires around 75 watts for a slightly worse performance. That is downright humiliating.
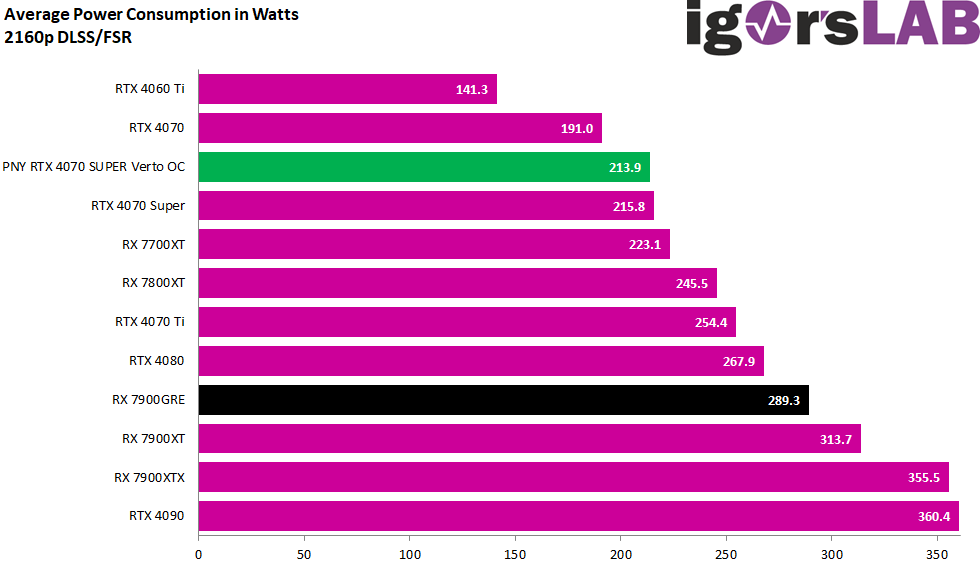
This can also be seen very clearly from the efficiency calculation:

- 1 - Introduction, technical data and technology
- 2 - Test system and measuring equipment
- 3 - Teardown: Disassembling and cooler
- 4 - Teardown: PCB and components
- 5 - Teardown: Material analysis
- 6 - Gaming Performance FHD (1920 x 1080)
- 7 - Gaming-Performance WQHD (2560 x 1440)
- 8 - Gaming Performance Ultra-HD (3840 x 2160)
- 9 - Gaming Performance DLSS & FSR
- 10 - Power consumption and load balancing
- 11 - Transients, capping and PSU recommendation
- 12 - Temperatures, clock rate and tehrmal imaging
- 13 - Fan curves, noise and audio samples
- 14 - Summary and conclusion


64 Antworten
Kommentar
Lade neue Kommentare
Urgestein
Veteran
Urgestein
Urgestein
Urgestein
Urgestein
Urgestein
Urgestein
Urgestein
Urgestein
Urgestein
Urgestein
Urgestein
Veteran
Mitglied
Alle Kommentare lesen unter igor´sLAB Community →