


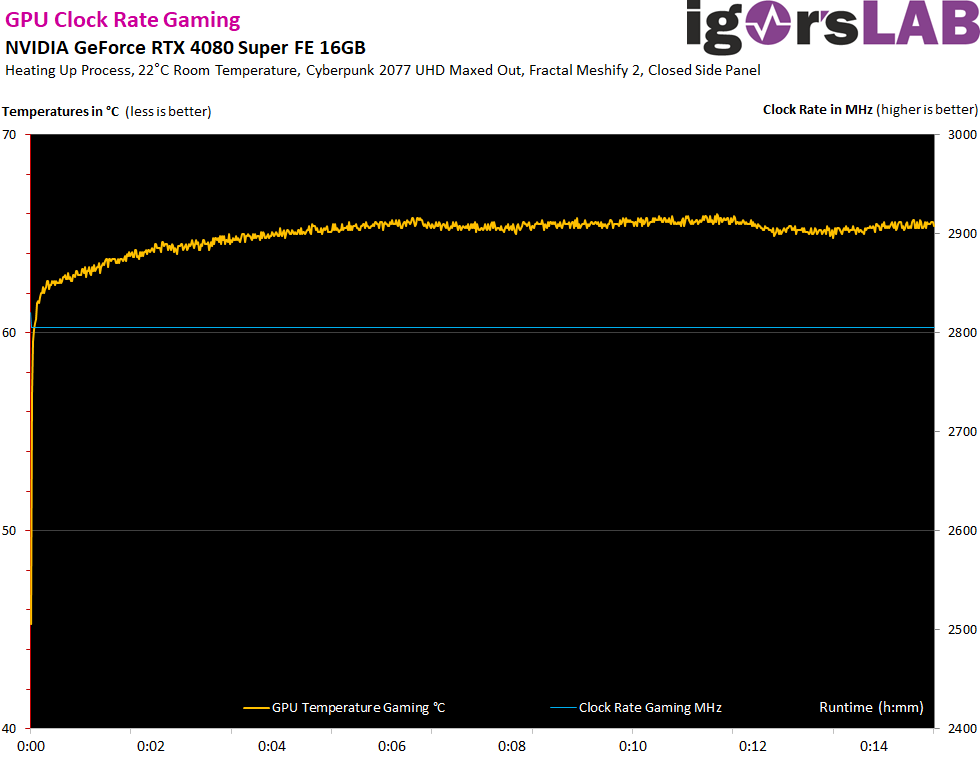
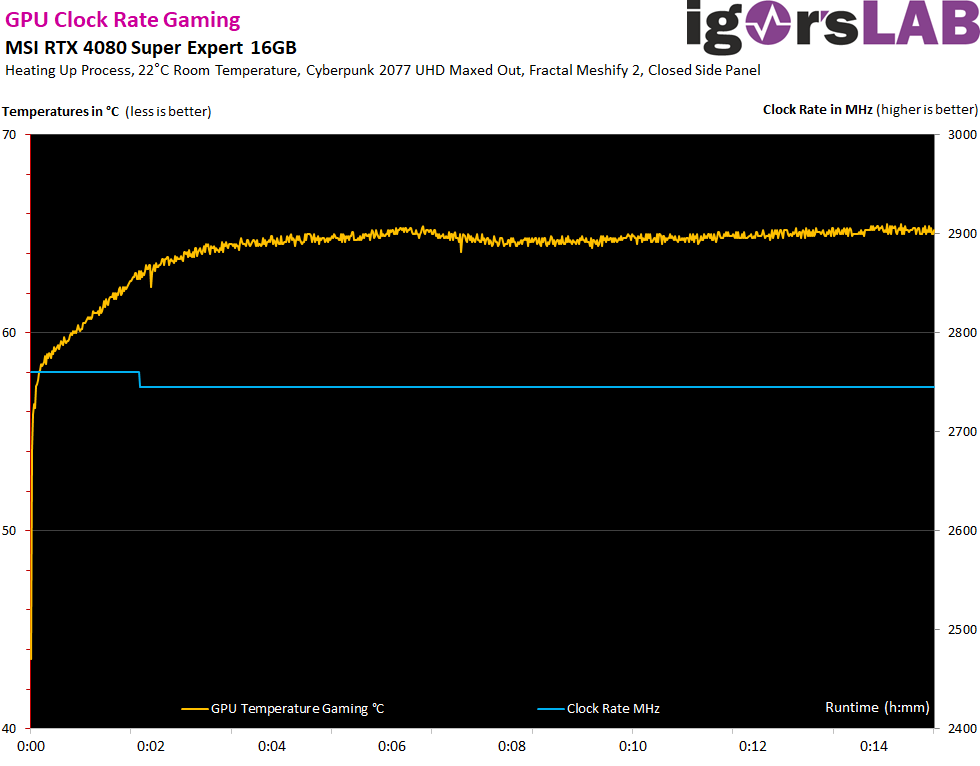
Real achievable clock rates and overclocking
With the clock rates, we can finally see where the approximately 0.4 to 0.6 percent performance advantage of the Founders Edition comes from. Whereby a 60 MHz difference in the clock rate is rather nonsense, because it could be easily equalized again using the slider and is not at all noticeable in practice. MSI could have shifted the offset a little, but as always, they took a more conservative approach. The GPU lottery takes care of the rest anyway and it will be interesting to see what differences can be found.

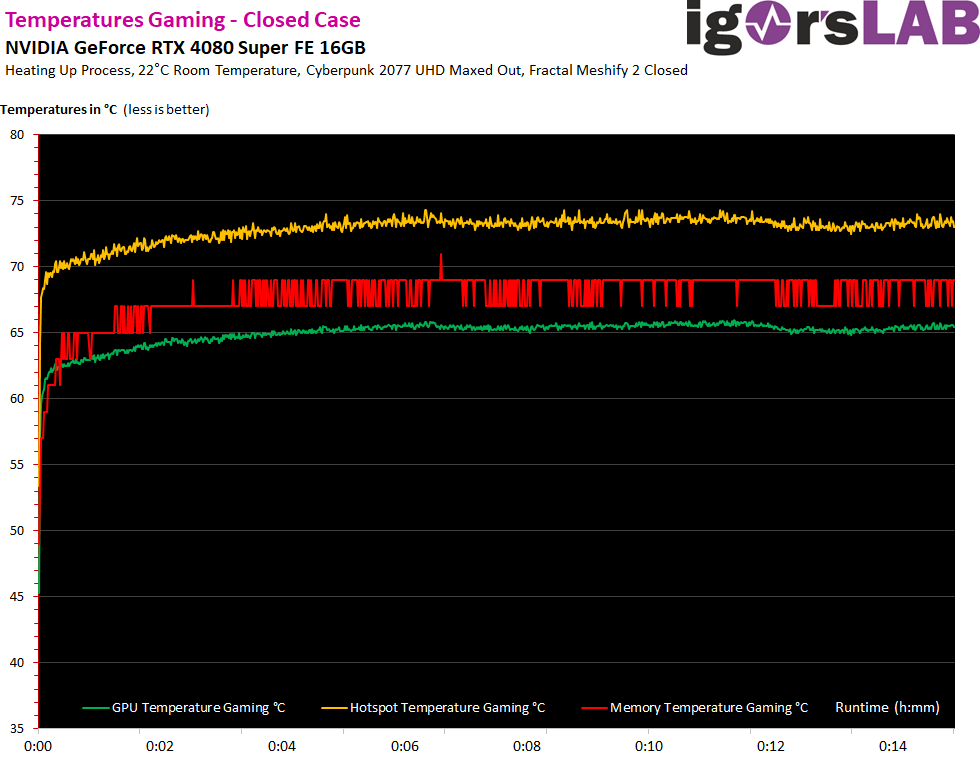
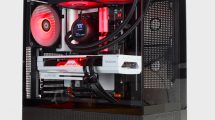
GPU temperatures in the housing
The differences are also not particularly large. If you close the panel, the GPU temperature (Edge) rises by around 3 Kelvin, while the CPU hotspot rises by up to 4 Kelvin. Nevertheless, the values of 65 to 66 °C (Edge), 74 °C (Hotspot FE) and 76 °C (Expert) are nothing to worry about. With OC, the values rise to a good 70 °C or 80 °C (Hotspot), which is just about right. However, since neither card is loud, the fan curves should perhaps be set a little more aggressively. There are enough reserves for this and you gain additional boost steps.
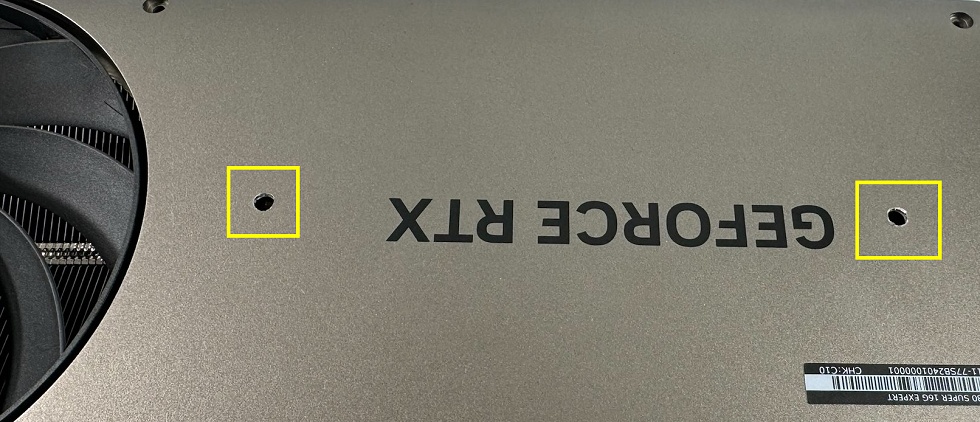
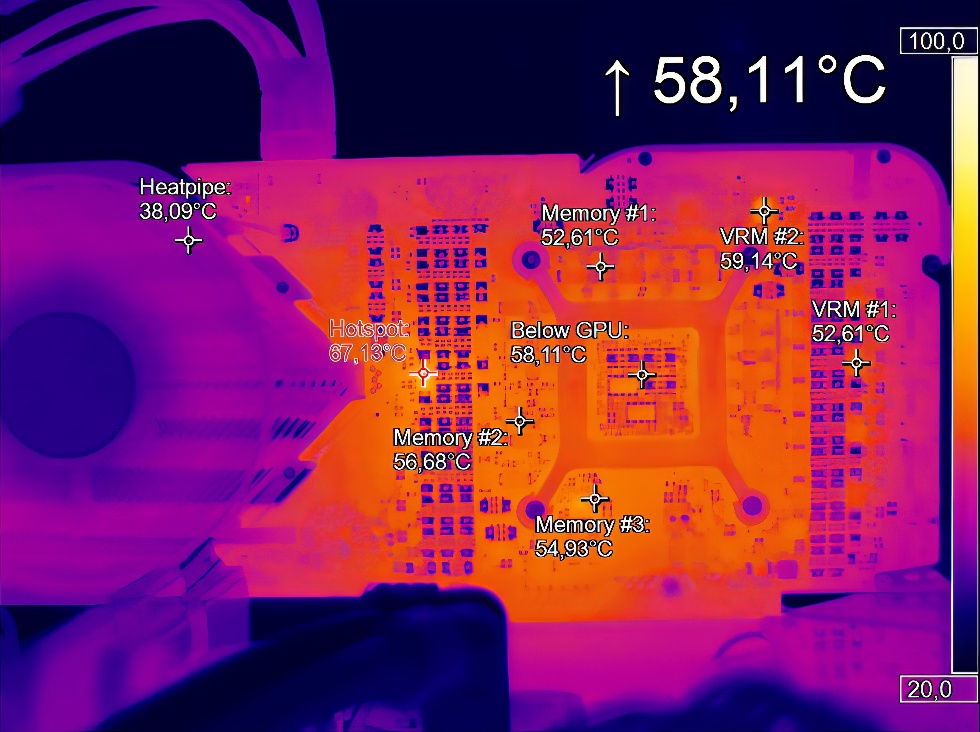
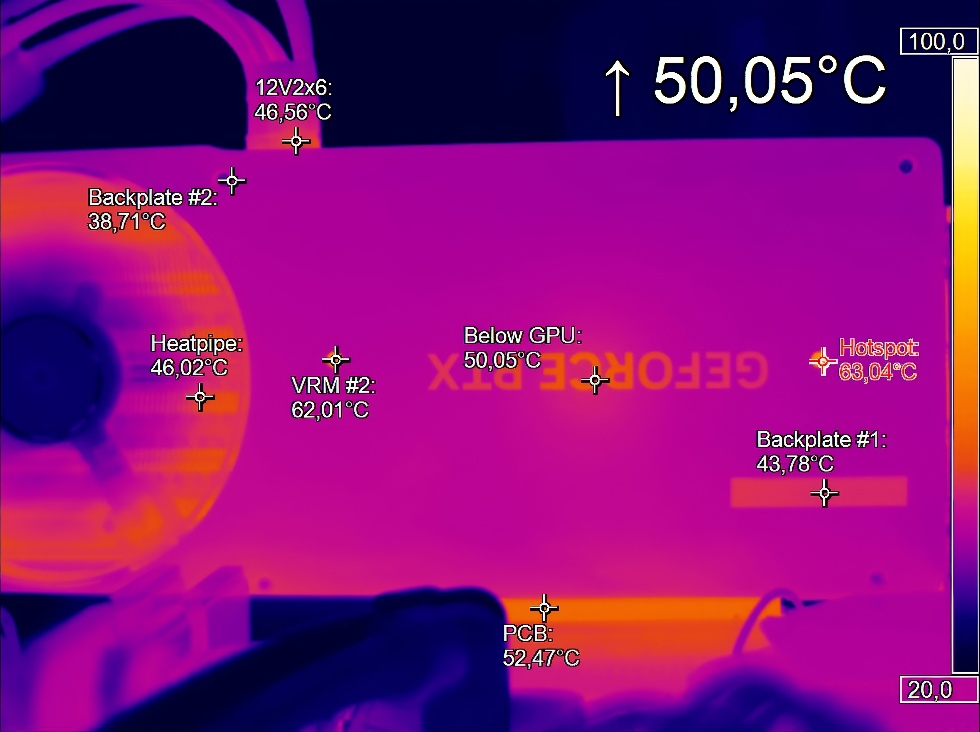
Infrared measurements (heat flow analysis)
Since the backplate of the MSI card carries the rear fan, I had to play a little trick and drill some holes for my measurements.
Let’s start with the gaming loop and compare the FE and the Expert. You can see the slightly different hotspot distribution due to the completely different voltage converter design. Both manufacturers have done their homework here.
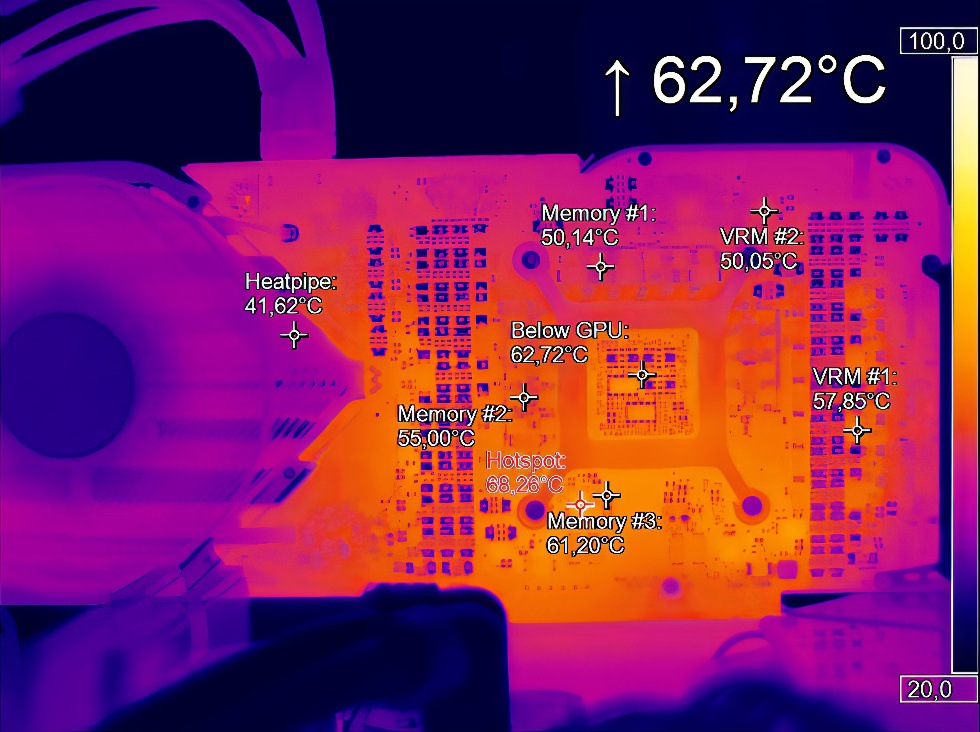
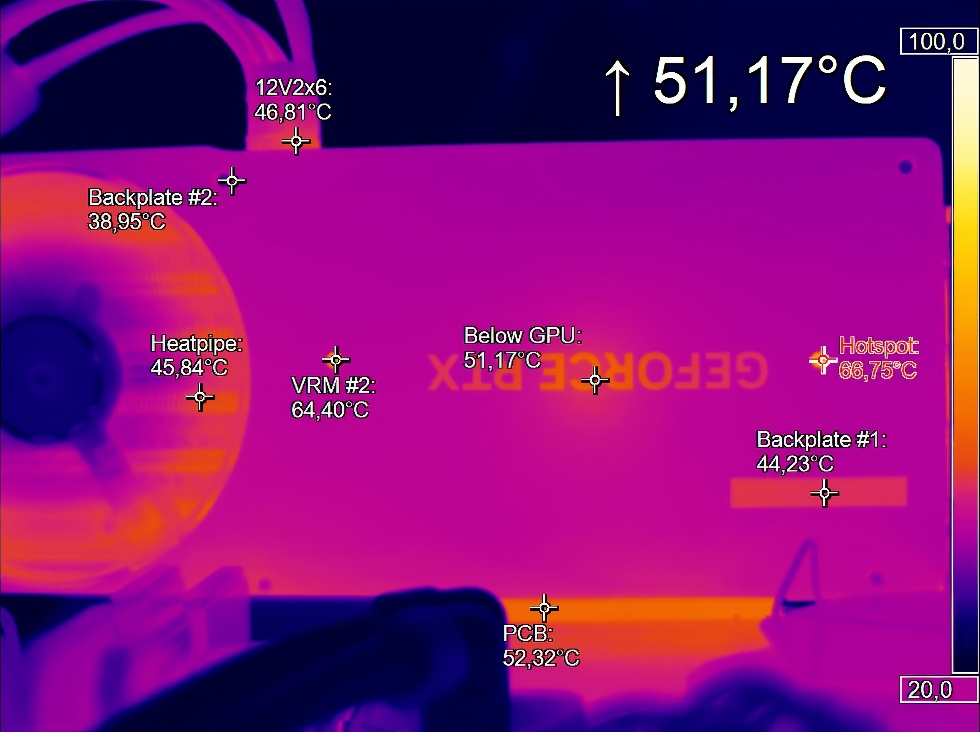
In the stress test, the temperatures of the voltage regulators continue to rise, but the same applies here. However, the hotspot of the Founders Edition now shifts to a voltage converter below the PEXVDD (PCIe Voltage).

- 1 - Introduction, technical data and technology
- 2 - Unboxing and technical details of both cards
- 3 - Test system and measuring equipment
- 4 - Teardown: PCB and components
- 5 - Teardown: Cooler and fans
- 6 - Material analysis: NVIDIA RTX 4080 Super FE 16GB
- 7 - Material analysis: MSI RTX 4080 Super Expert 16GB
- 8 - Gaming-Performance WQHD (2560 x 1440)
- 9 - Gaming Performance Ultra-HD (3840 x 2160)
- 10 - Gaming Performance DLSS vs. FSR
- 11 - Gaming performance with Frame Generation
- 12 - Latencies and lags
- 13 - Workstation graphics and rendering
- 14 - Details: Power consumption and load balancing
- 15 - Load peaks, capping and power supply recommendation
- 16 - Temperatures, clock rates and infrared analysis
- 17 - Fan curves, noise level and audio samples
- 18 - Summary and conclusion


38 Antworten
Kommentar
Lade neue Kommentare
Veteran
Urgestein
Mitglied
Mitglied
Urgestein
Veteran
Veteran
Urgestein
Urgestein
Urgestein
Urgestein
Moderator
Veteran
Urgestein
Mitglied
Urgestein
Urgestein
Alle Kommentare lesen unter igor´sLAB Community →