


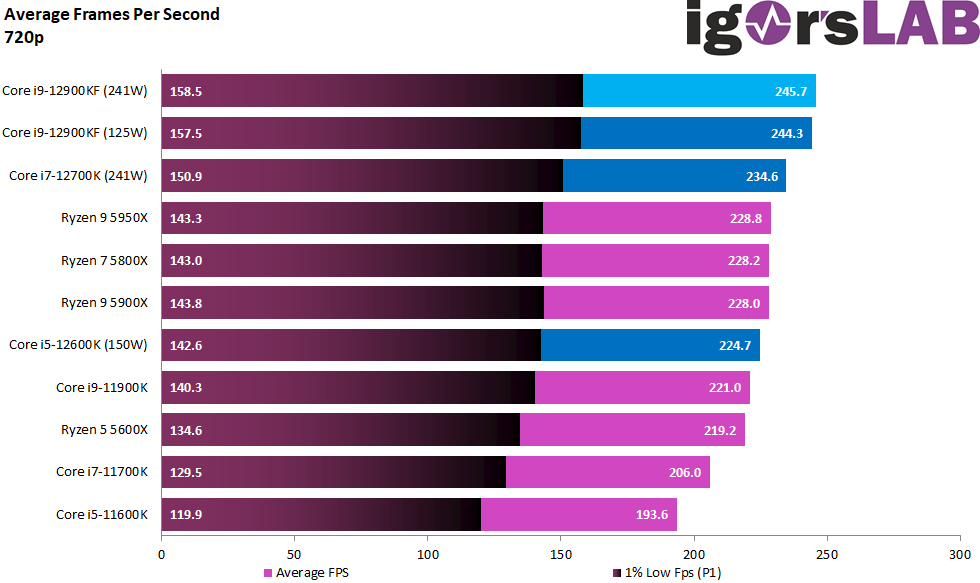
Performance in 1280 x 720 pixels resolution (“720p”) and provoked CPU limit
I’d like to remind you again that in both 720p and 1080p, I fairly didn’t cumulate the two limiting games, even though the difference would have ended up being only 0.2 and 0.1 percentage points respectively, and there’s no change in power consumption or efficiency. But one should also remain correct. Let’s first look at the normalized and cumulative average FPS. The first finding is that it hardly matters for the Core i9-12900KF whether PL1 is set to PL2 or not. This also applies to the Core i7-12700K, which the two tested motherboards had hoisted to 241 watts each, as well as the Core i5-12600K with its 150 watts for PL1. I wanted to test with factory defaults of the mainboard manufacturer, which I did. Due to time constraints, I didn’t test the two smaller SKUs with the actual PL1, but the differences were even smaller than the i9-12900KF in some plausibility tests.
If we now look at the whole thing as a representation of the average FPS in percent and set the Ryzen 9 5950X as a base value with 100%, then the Core i9-12900KF has a lead of 7.4 or 6.8 percentage points, depending on the PL1. We’ll see later on in the cumulative power consumption and efficiency review how superfluous this PL1 gimmick actually is for gaming, where you’re not rendering on the CPU for hours on end.
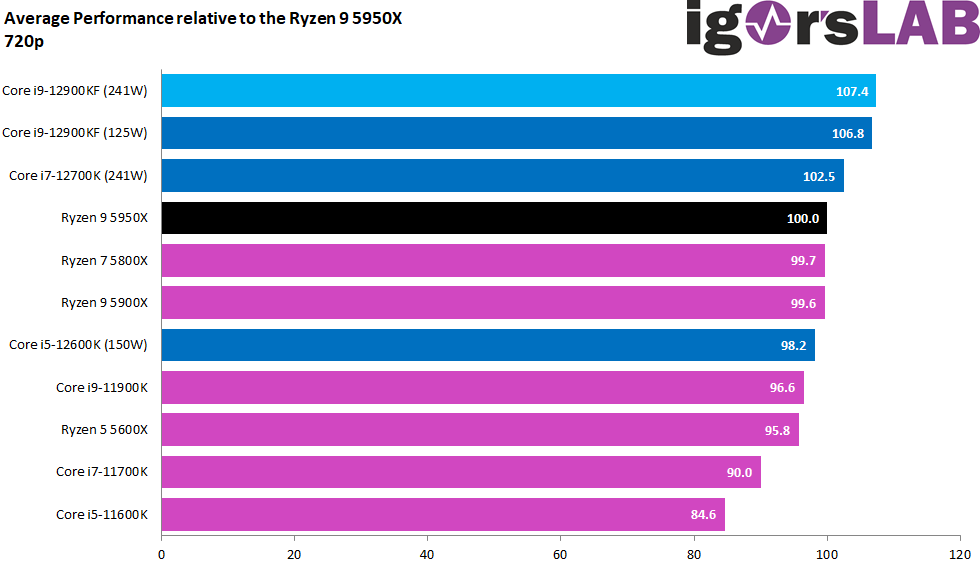
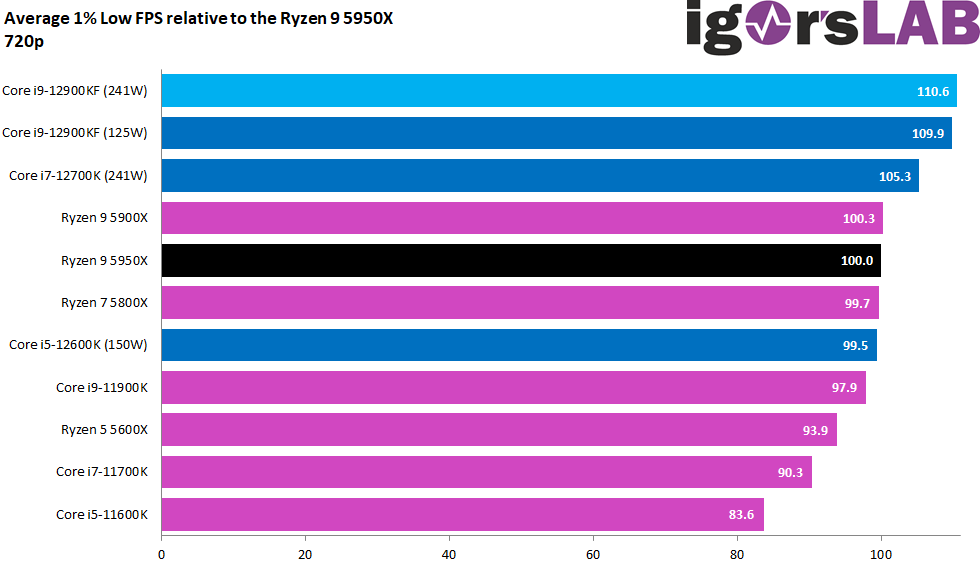
Much more interesting, however, is the value for 1% low FPS, that is the first percentile (P1), where the Core i9-12900KF already has an advantage of 10.6 or 9.9 percentage points, depending on PL1. Ergo, Alder Lake S can add another 3 percentage points to the Ryzen when it comes to the so-called Min-FPS. And it’s very similar in every game, so it’s not a partial exception.
Performance in 1920 x 1080 pixels resolution (“1080p”) and CPU and GPU limit
The gap is narrowing, of course, though I must point out again that the picture looked significantly different before AMD’s new chipset drivers and with the unpatched Windows. There was still a difference of well over 10 percentage points, but I already mentioned that on the first page. First of all, the cumulative average FPS again:
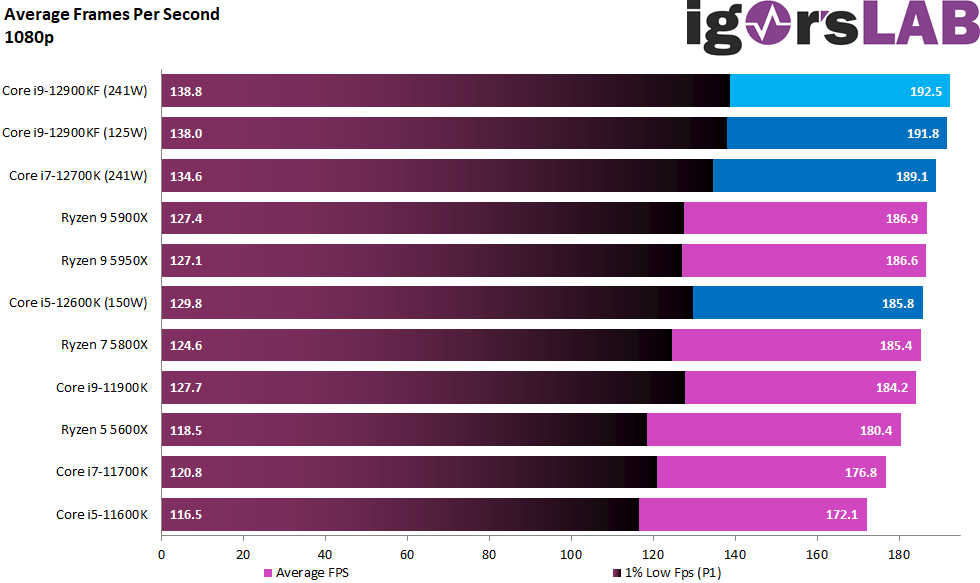
Expressed in percentages, the advantage is only about 3 percentage points when the CPU limit sets in, and one really wonders where the reason for upgrading or retooling is supposed to lie here. But there are other metrics that quickly prove us wrong.
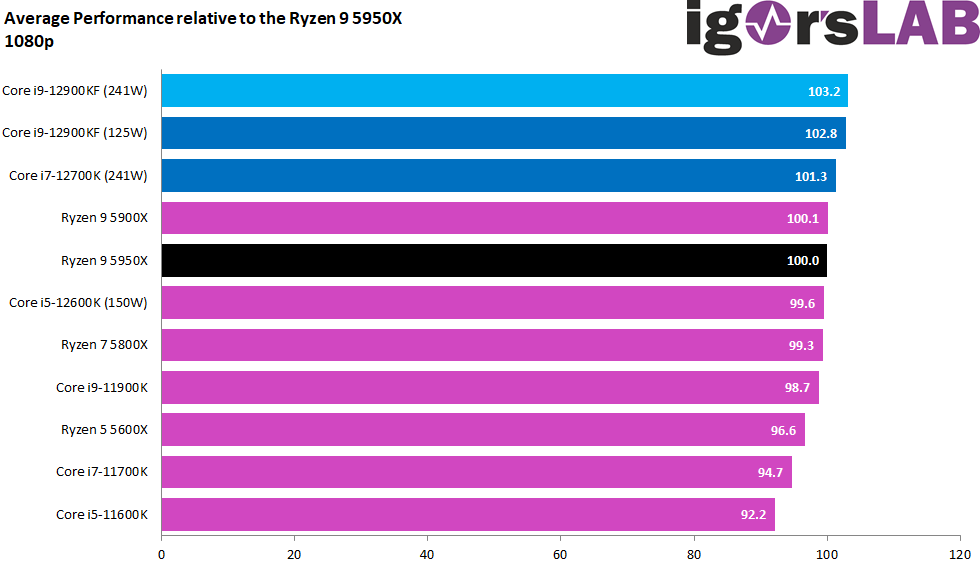
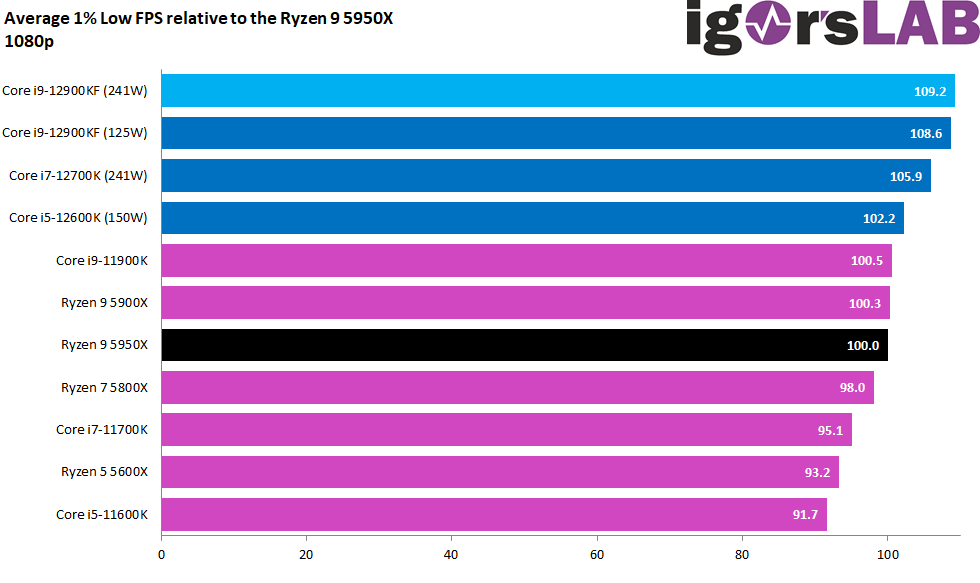
One way of looking at it that almost restores the old gap from the 720p tests is the evaluation of the min-FPS, the so-called P1. Intel can add about 9 percentage points to the Core i9-12900KF compared to the Ryzen 9 5950X. Sure, these aren’t galaxies yet, but it’s still a decent amount.
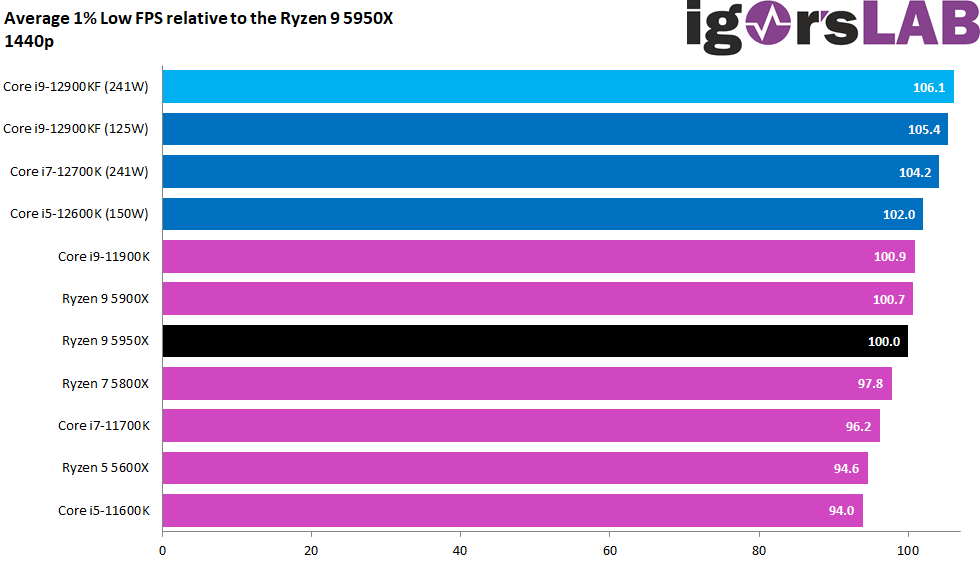
Performance in 2560 x 1440 pixels resolution (“1440p”) and GPU limit
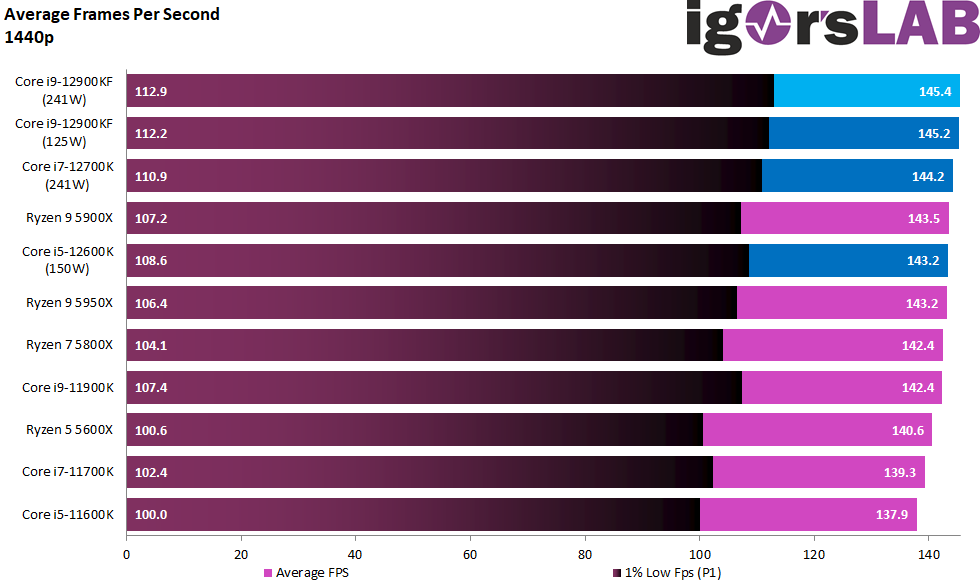
The gap narrows once again, where you can also see that the CPU actually hardly plays a role for the average FPS, which are all very close to each other. Except for the P1, but I’ll get to that in a minute.
In absolute terms, the 1.6 percentage points between the Core i9-12900KF and the Ryzen 9 5950X is almost within the realm of tolerance, even if the result remained consistent over a few runs. So the average FPS are quite fitting from AMD’s point of view.
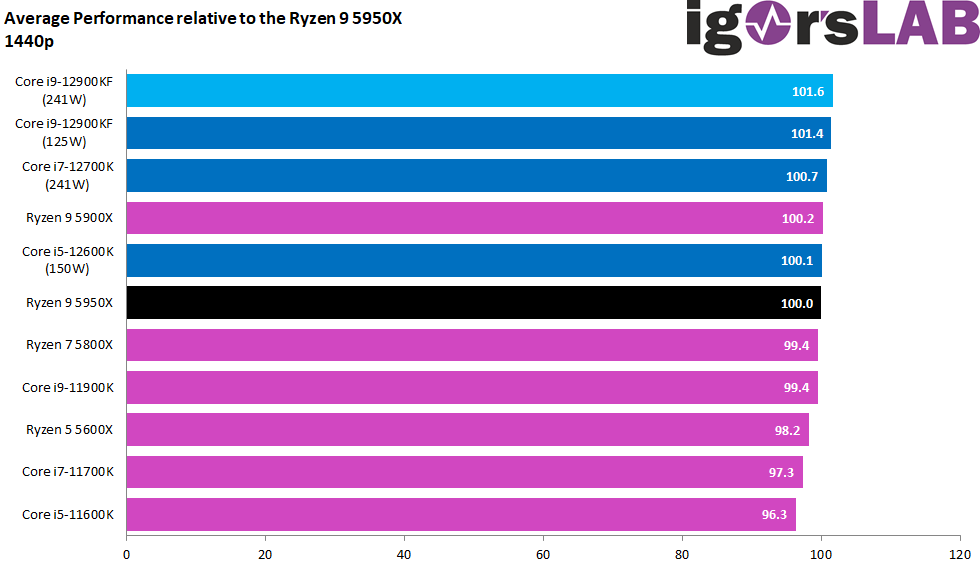
If it weren’t for the P1 and the darn Min FPS! It’s still 6 percentage points that AMD is now missing on Intel. More or less pronounced depending on the game, but in total really not negligible.
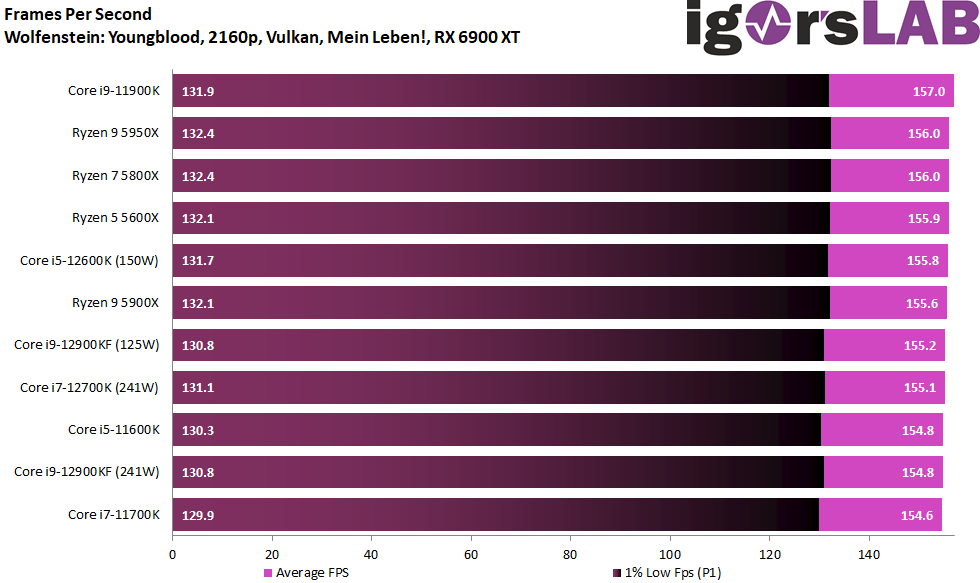
Performance in 3840 x 2160 pixels resolution (“2160p”) and absolute GPU limit
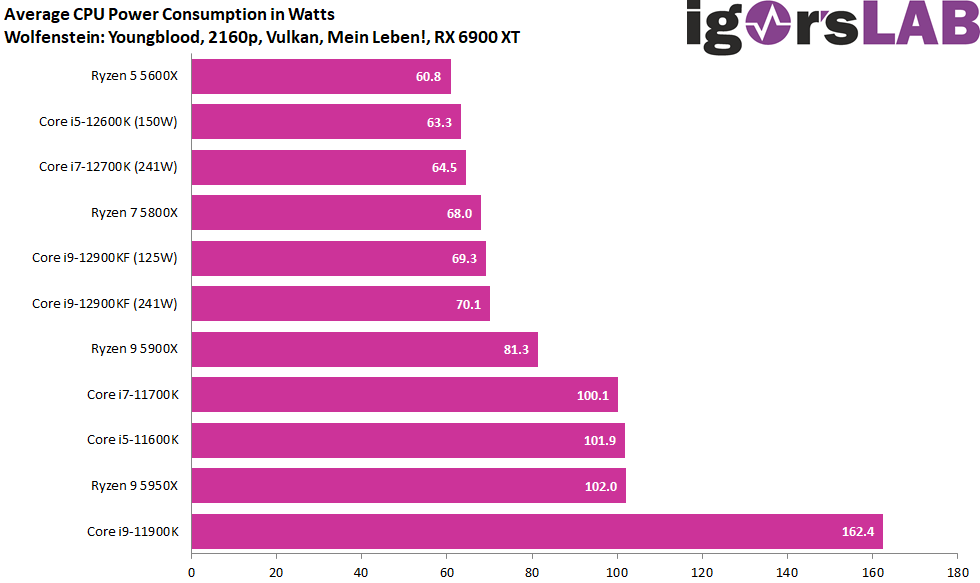
Yes, they also exist, the games in Ultra HD, where marginal differences are still measurable. Far Cry 6, for example, is one of the very , very rare exceptions. Most of the time, though, the bars look like they do here in Wolfenstein: Youngblood, so I just ended up leaving it alone. It simply also a matter of sense and time to argue over individual percentage points. By the way, in the test below the old Rocket-Lake-Bolide wins with its whopping 162.4 watts at the line. This is more than twice as much as the I9-12900KF with 241 Watt PL1. Good night, everybody.

- 1 - Introduction, preface and test systems
- 2 - 720p - Gaming performance
- 3 - 720p - Power consumption and efficiency
- 4 - 1080p - Gaming performance
- 5 - 1080p - Power consumption and efficiency
- 6 - 1440p - Gaming performance
- 7 - 1440p - Power consumption and efficiency
- 8 - Overall evaluation of gaming performance
- 9 - Overall evaluation of power consumption and efficiency
- 10 - Summary and conclusion for gaming


163 Antworten
Kommentar
Lade neue Kommentare
Veteran
Urgestein
Urgestein
Urgestein
Veteran
Urgestein
Urgestein
Urgestein
Veteran
Urgestein
Veteran
Urgestein
1
Moderator
Urgestein
Urgestein
Mitglied
1
Urgestein
Alle Kommentare lesen unter igor´sLAB Community →