


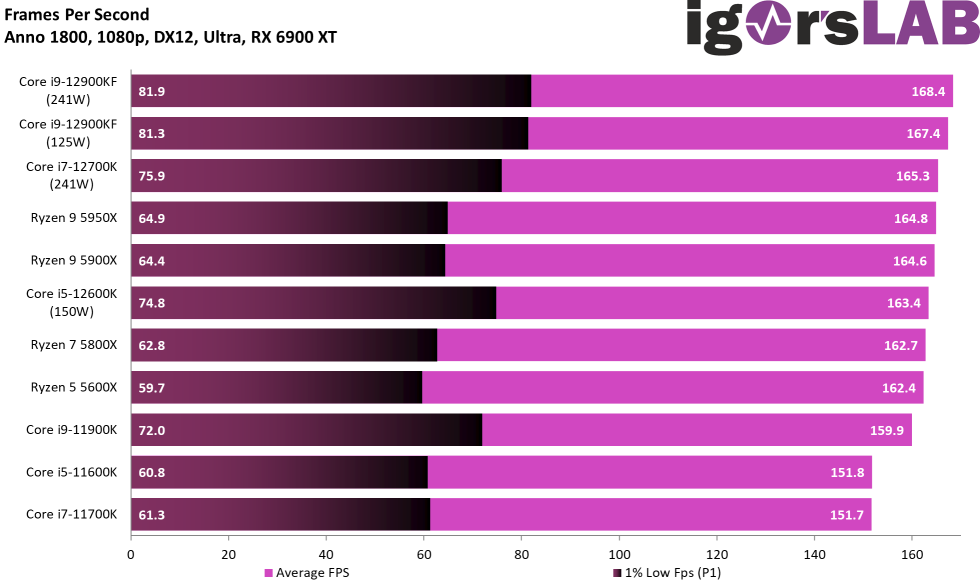
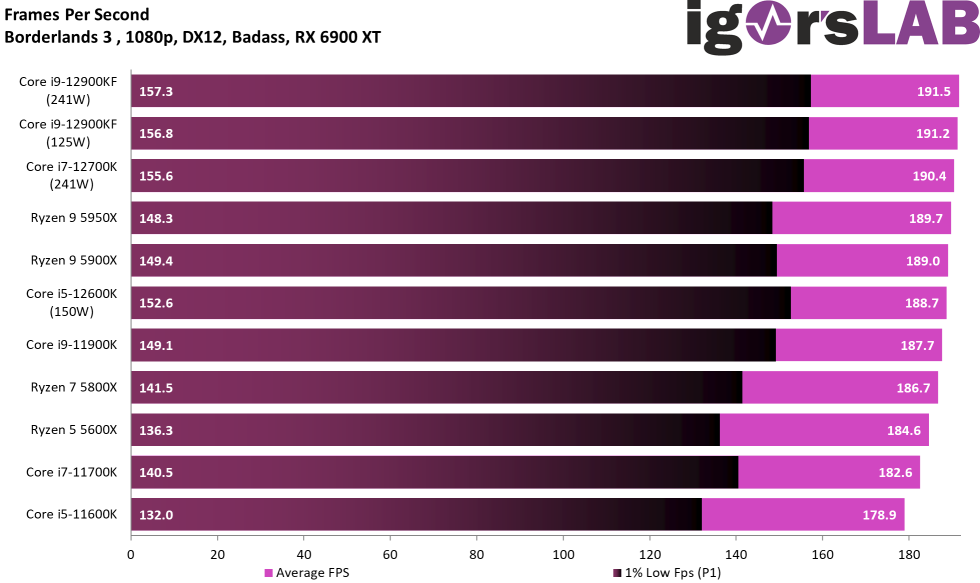
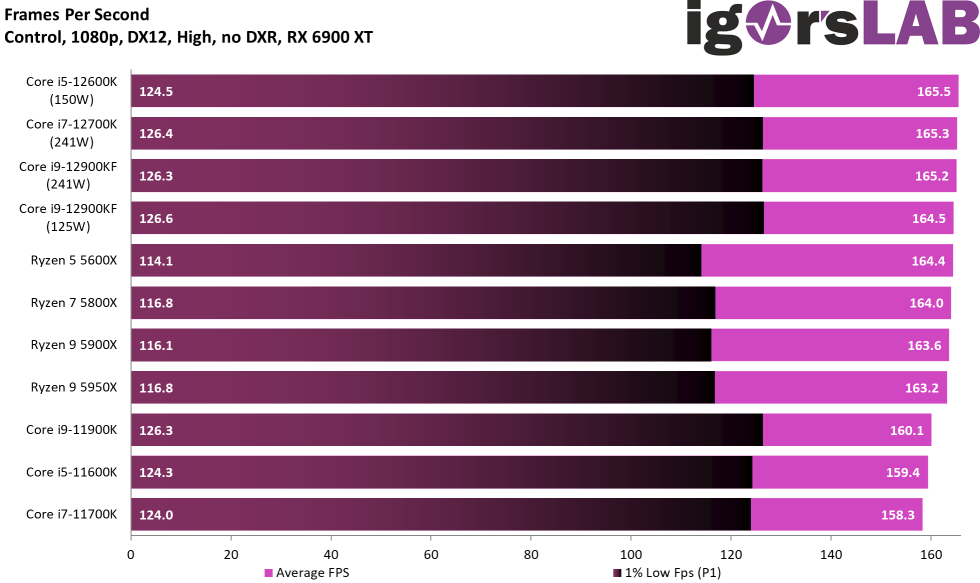
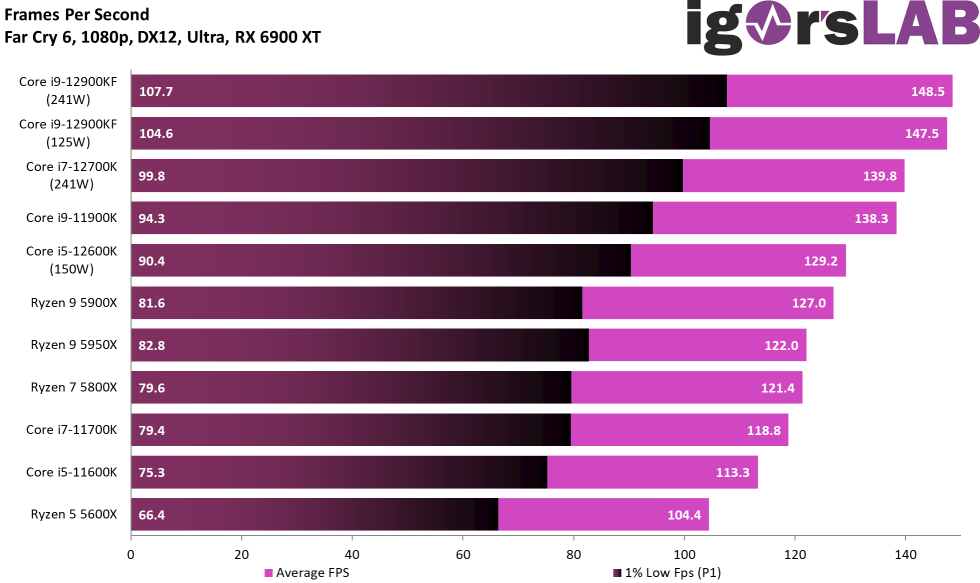
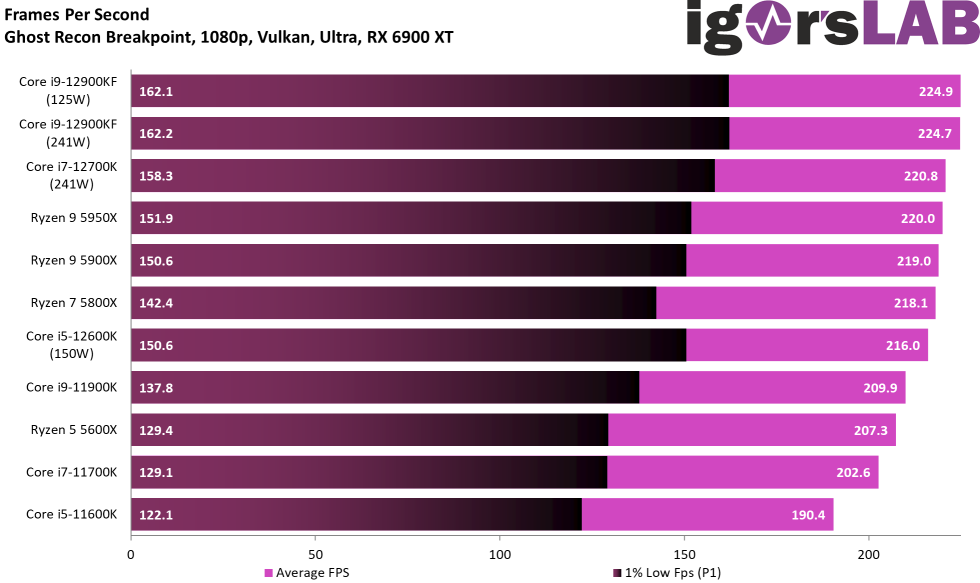
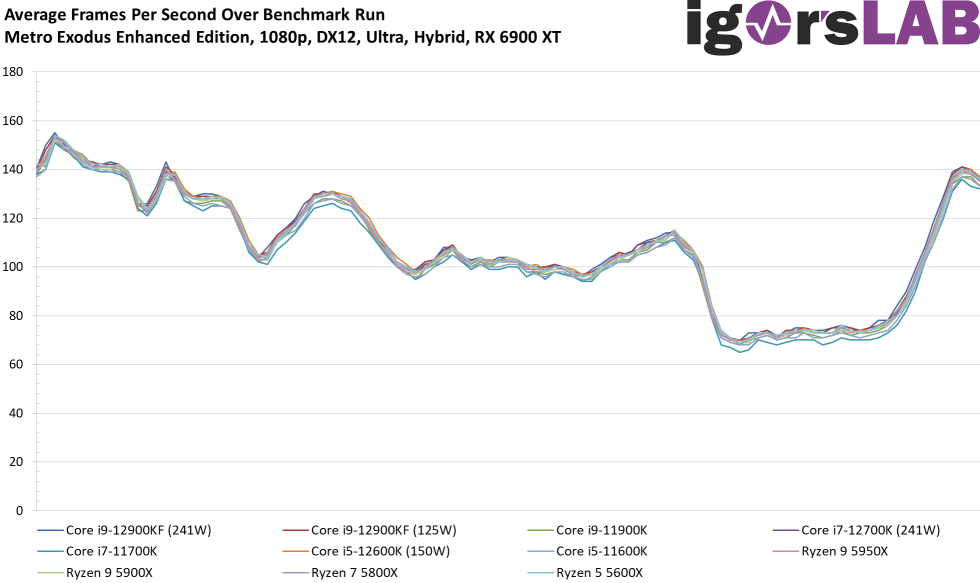
Now the measurements are available in 1080p, which is a resolution of 1920 x 1080 pixels. If I had tested the recommended graphic lightweights now, the graphics card would also be on a relaxed holiday trip. But neither Counter Strike nor Valorant require the kind of hardware we tested today in real life. The 720p tests will have to do as a substitute for the GPU limit. The bars are also moving closer together now, as the graphics card is brought more into play. Of course, one could also forcefully look for negative examples for the individual competitors, but this is not purposeful for a review.
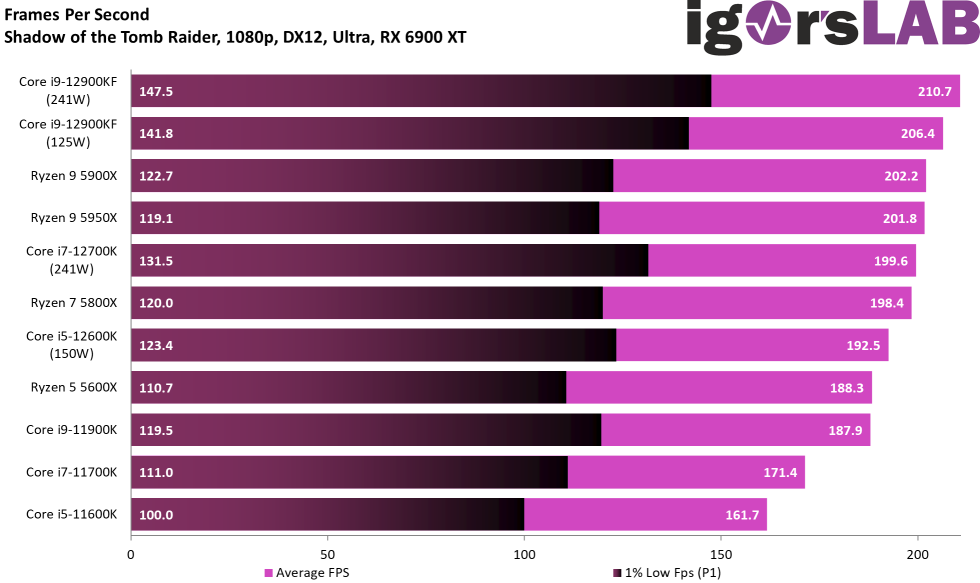
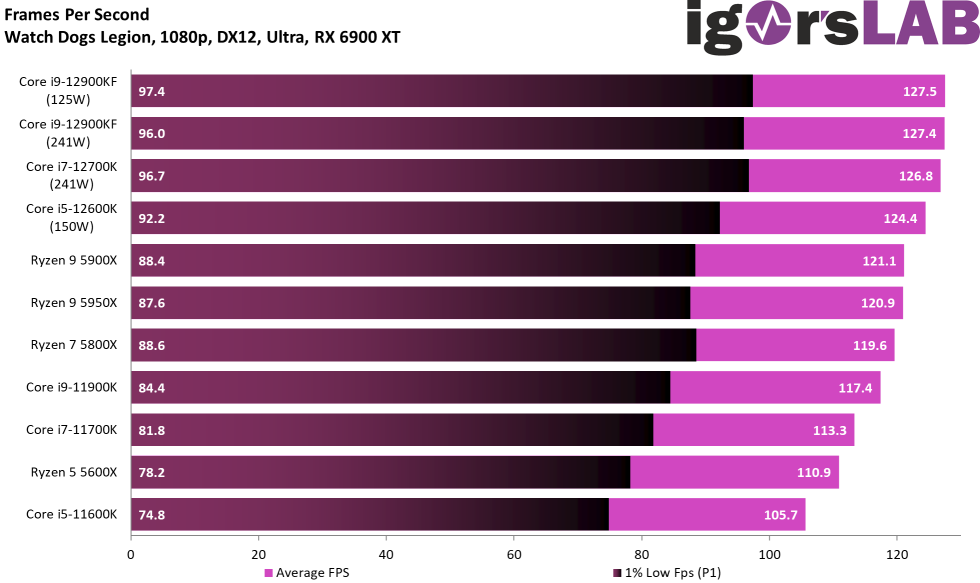
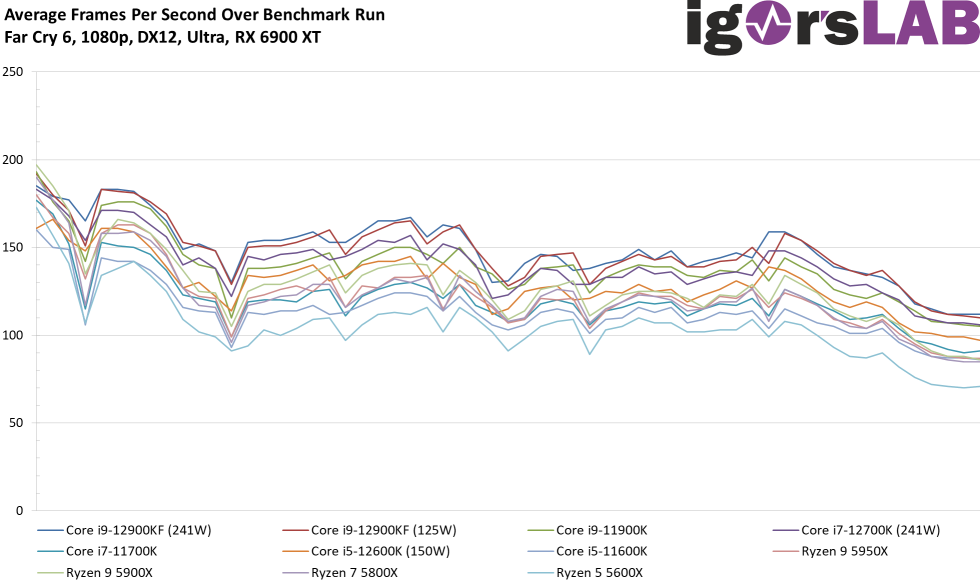
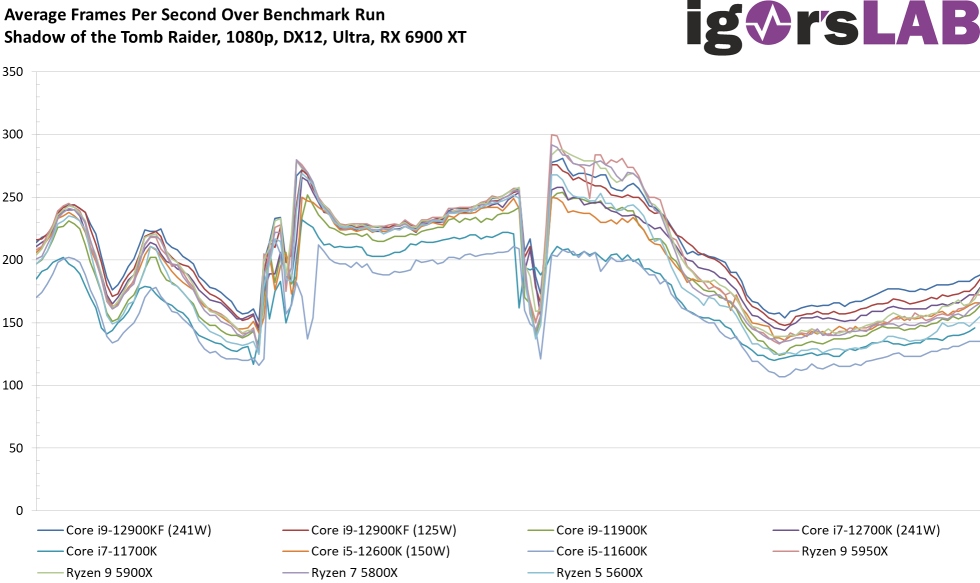
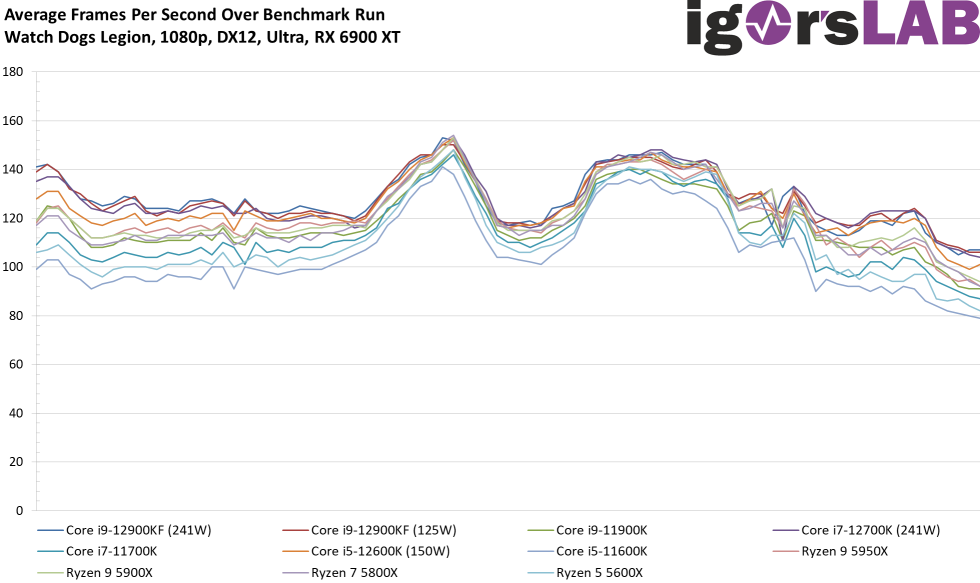
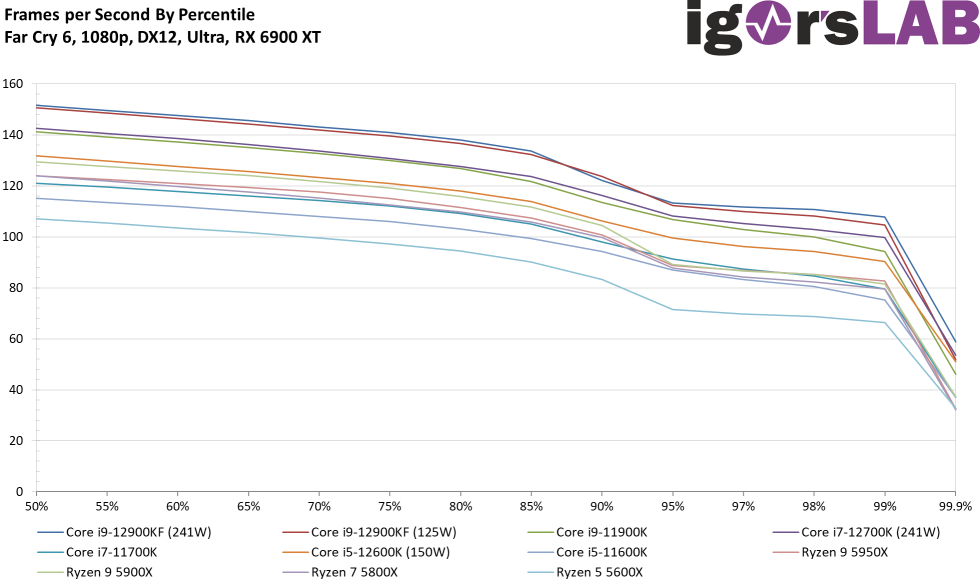
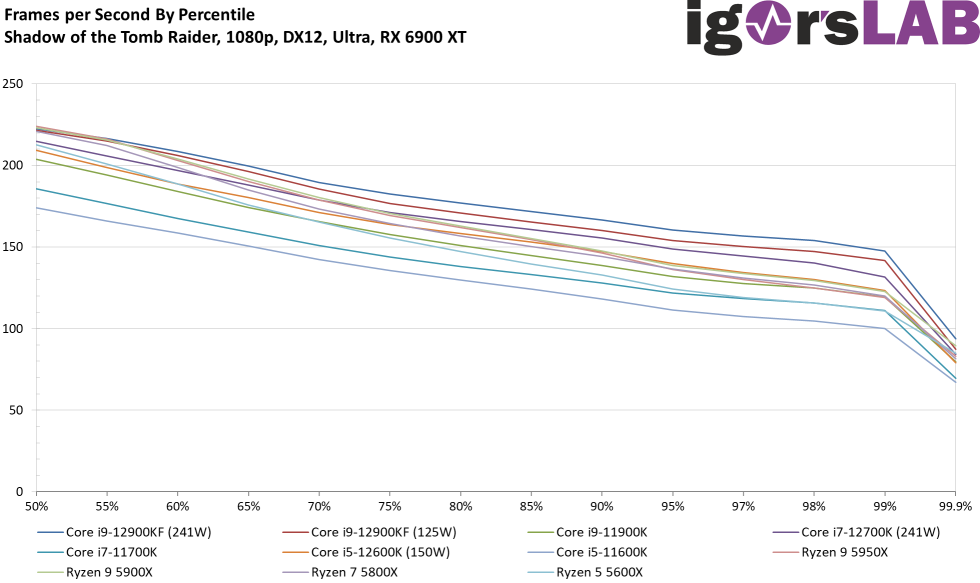
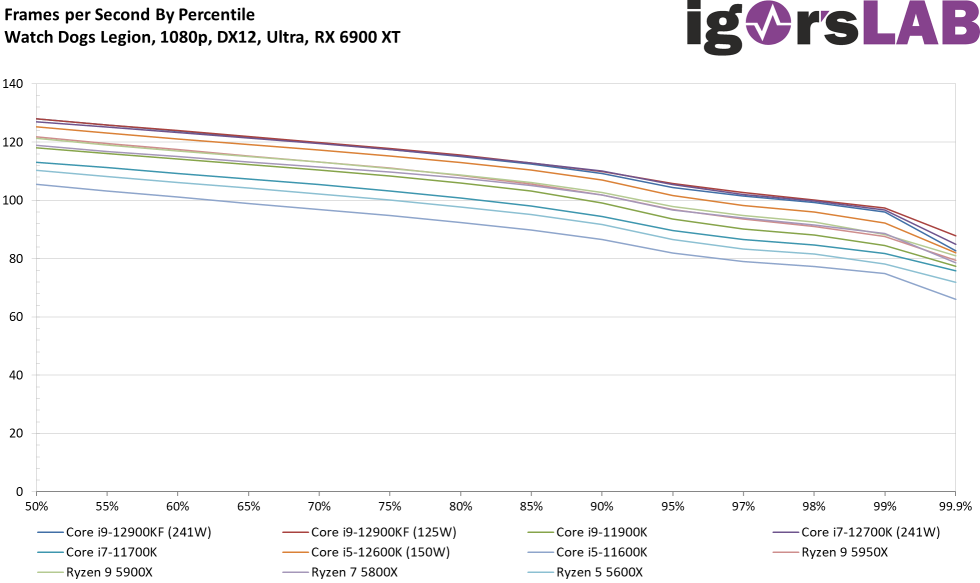
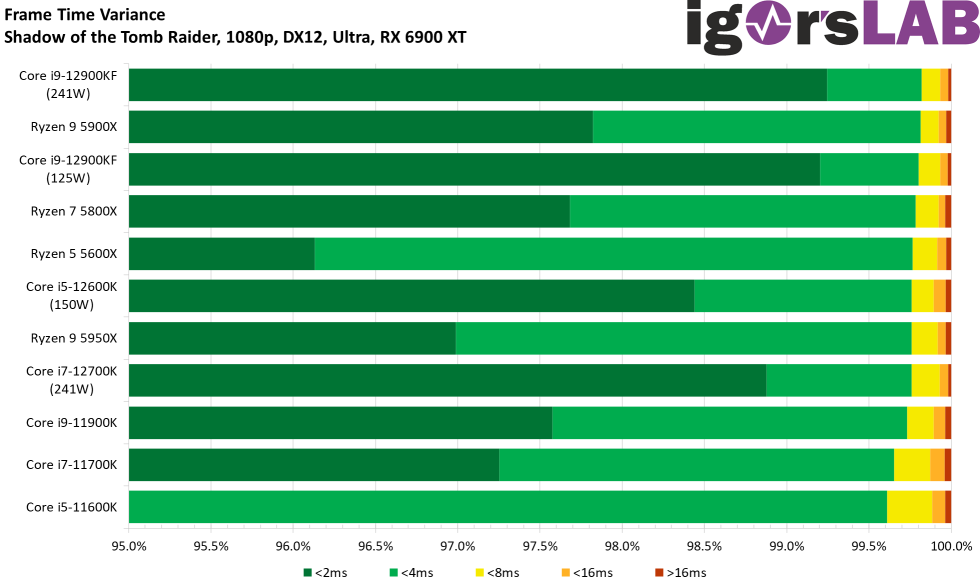
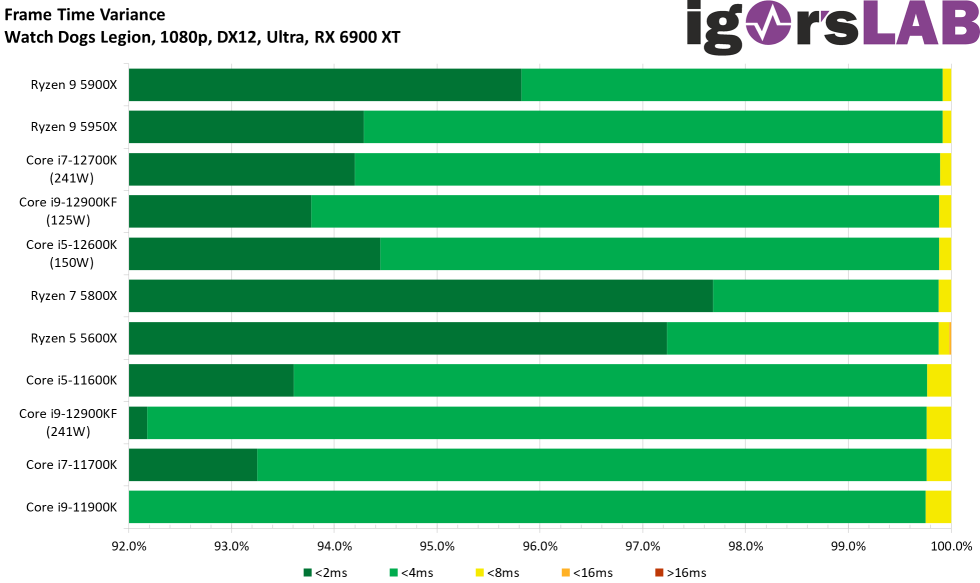
In Shadow of the Tomb Raider I even see a 4.5 percentage point advantage for Intel after the last BIOS update of the Z690 board for better memory management, although the in-house slides still reported a defficiency. In Watch Dogs Legion, the lead melts from 20 to just under 6 percentage points, but this would have happened the same way with a potent NVIDIA graphics card. In Far Cry 6, the advantage of the Core i9-12900K over the Ryzen 9 5950X even increases to 21.7 percentage points, while the other 7 games are partly far below 3 percentage points. Yes, it can make a difference in well-suited titles, but it’s also not really a blanket statement, and if there is a difference, it’s guaranteed not to make or break playability.
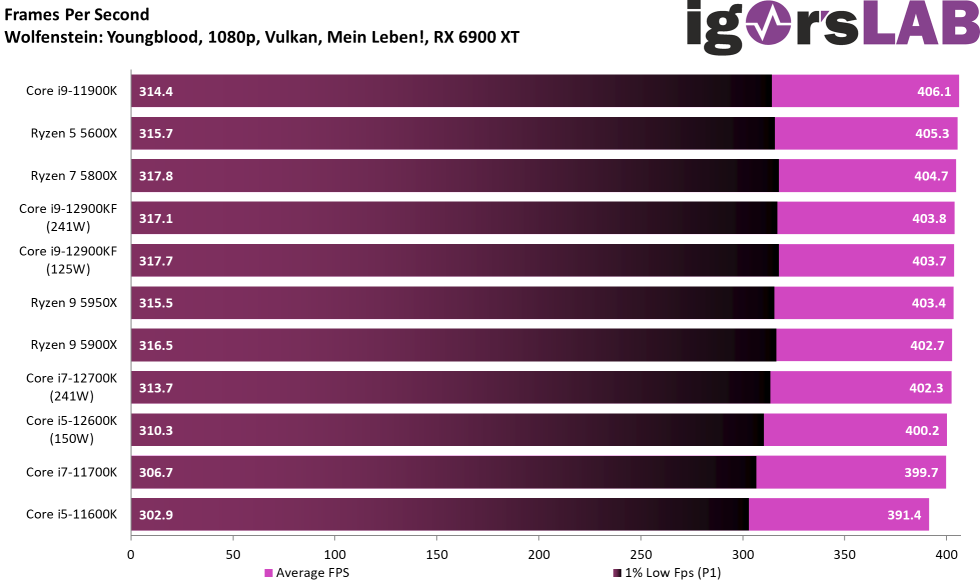
First, again, all games as FPS bars, with Intel CPUs leading the way on the P1. That’s quite a show of force, especially with the min-FPS, and I didn’t see that coming.
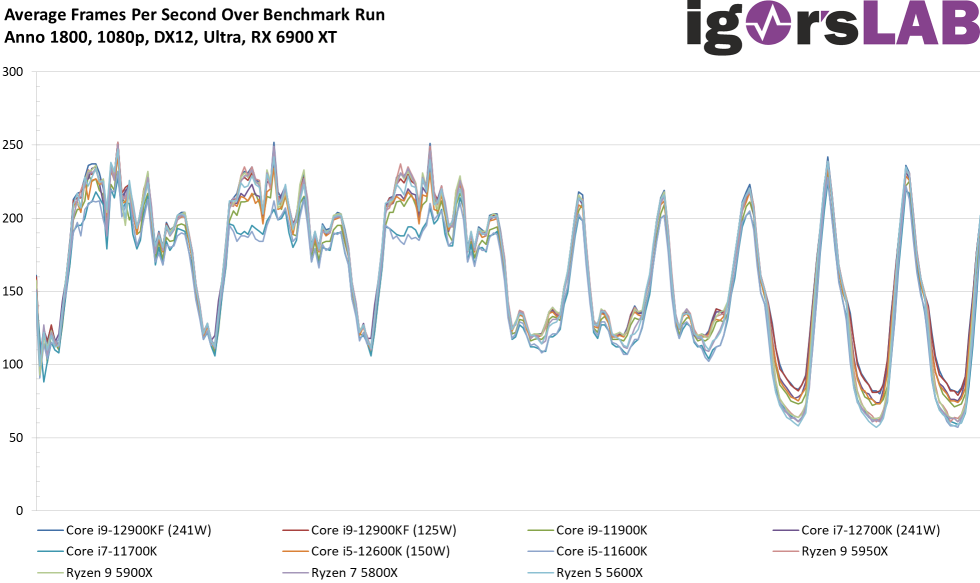
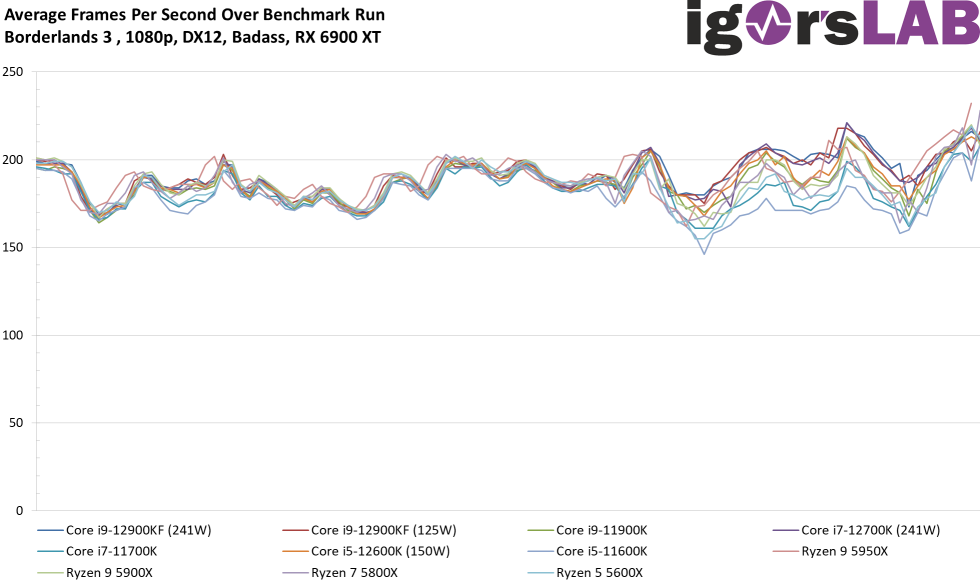
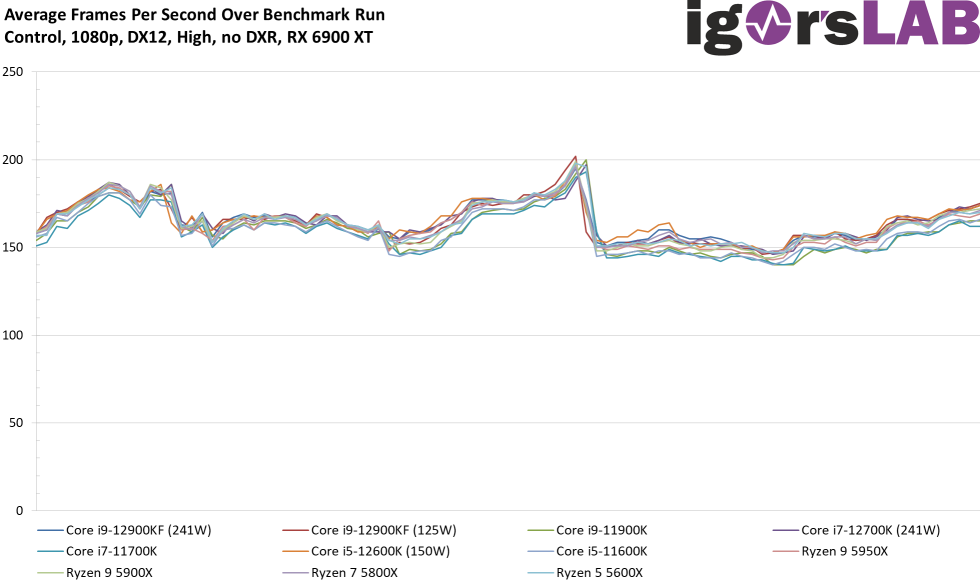
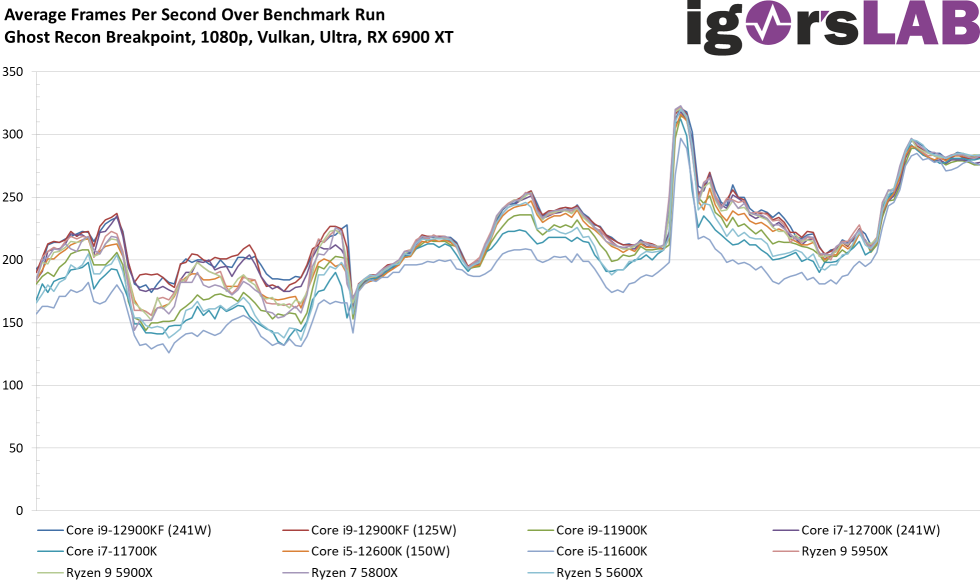
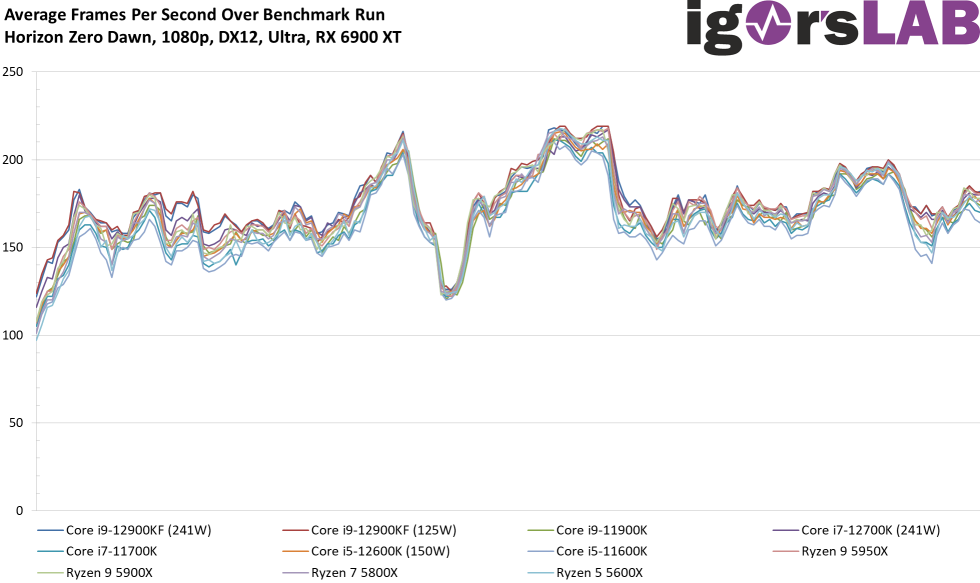
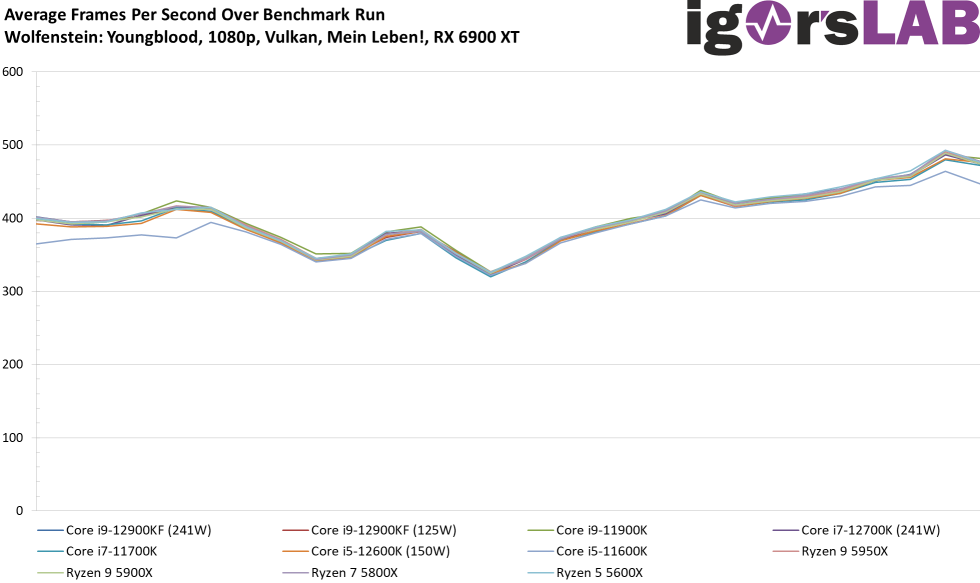
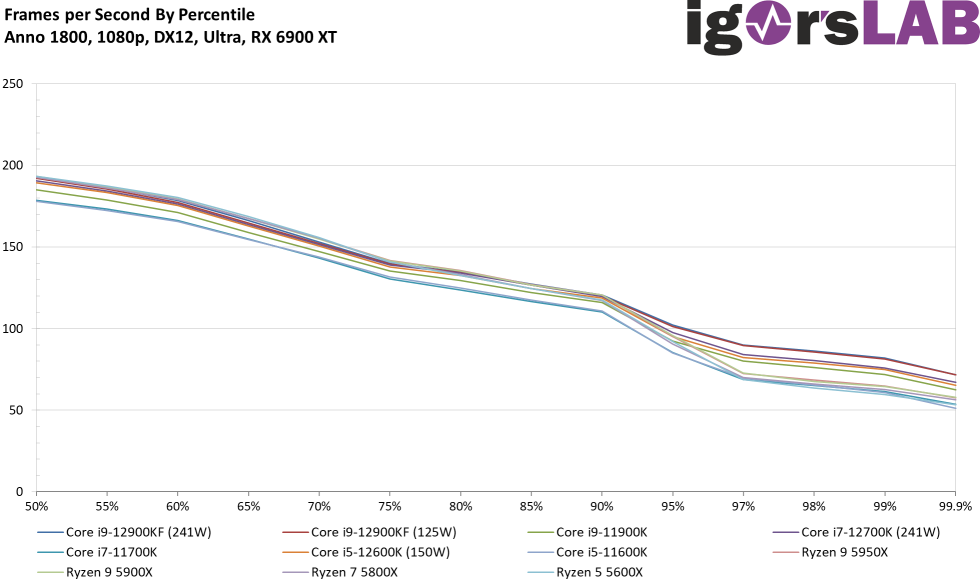
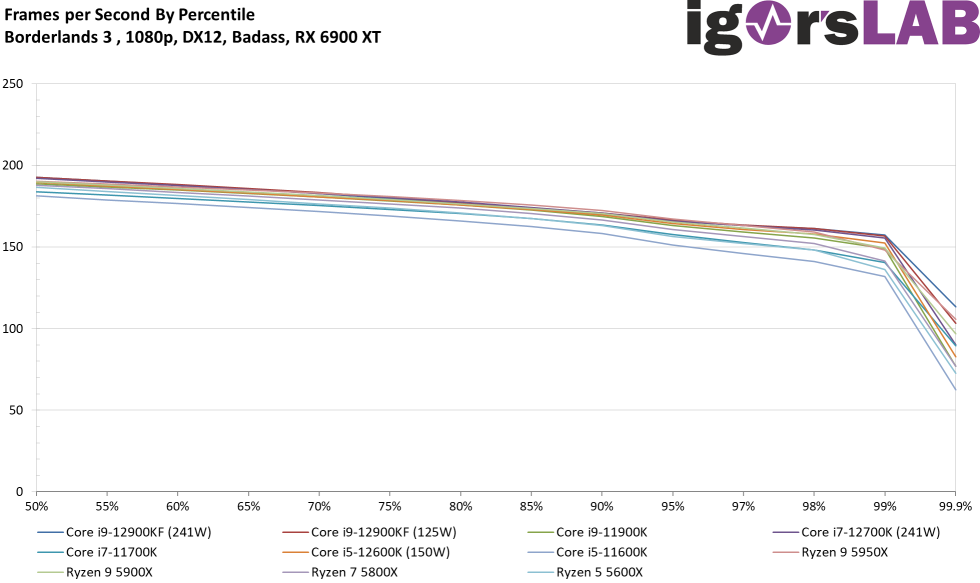
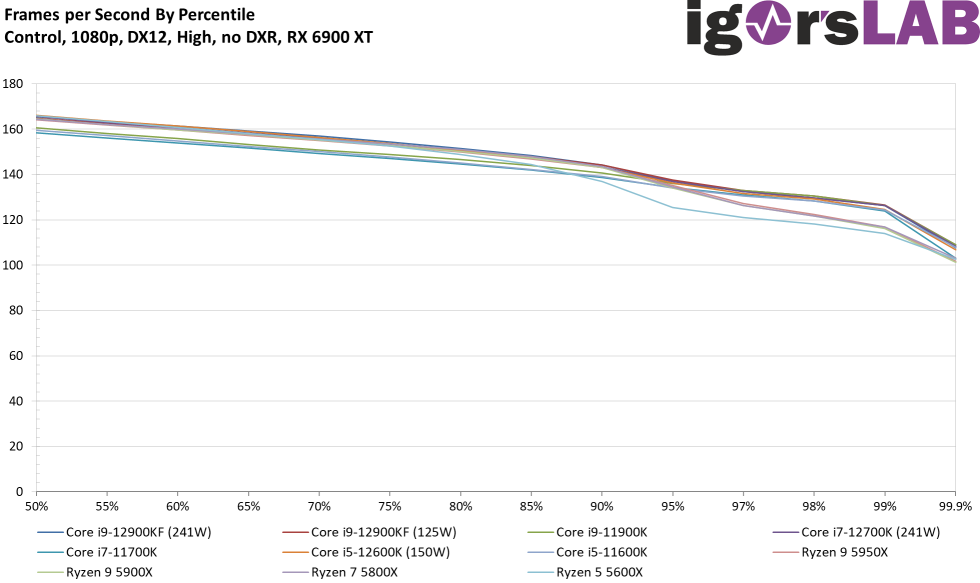
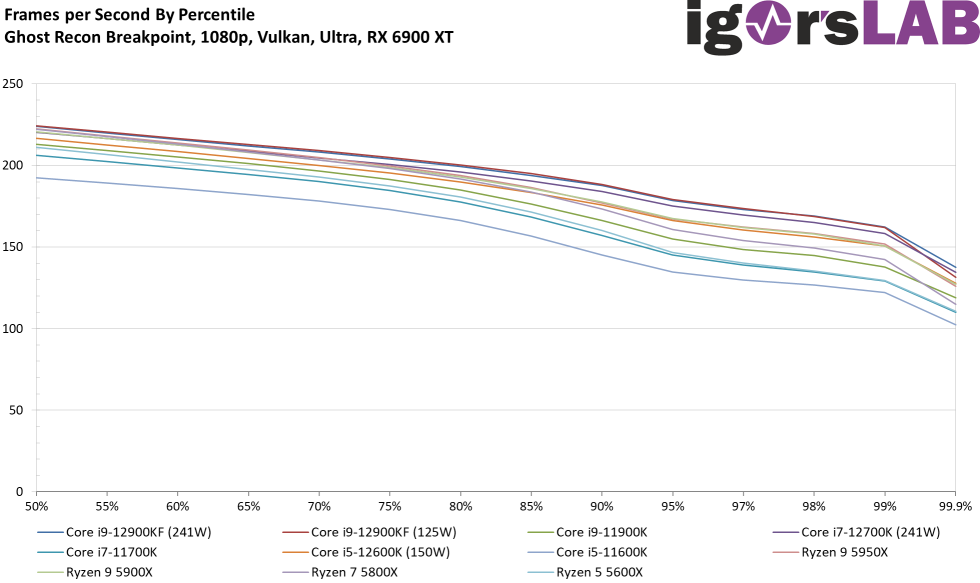
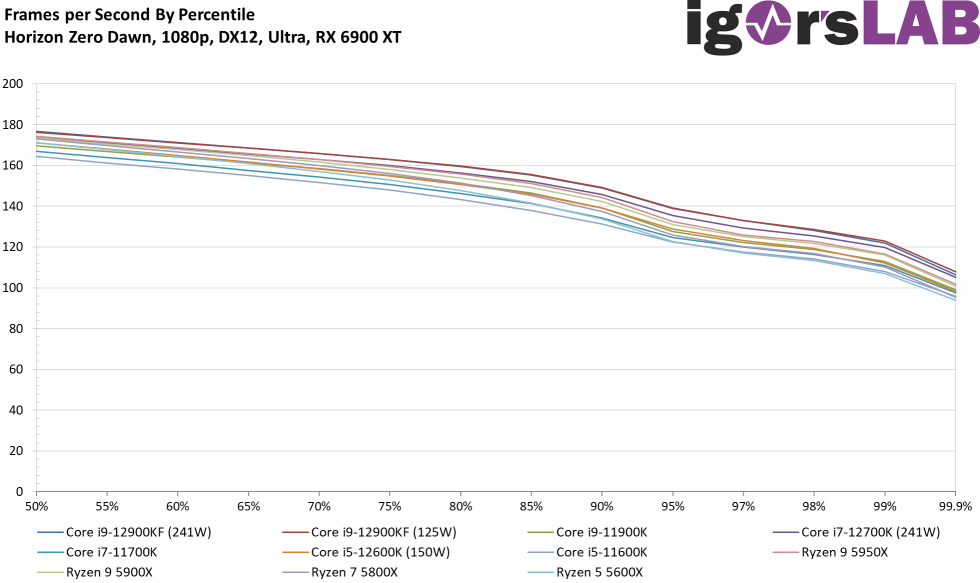
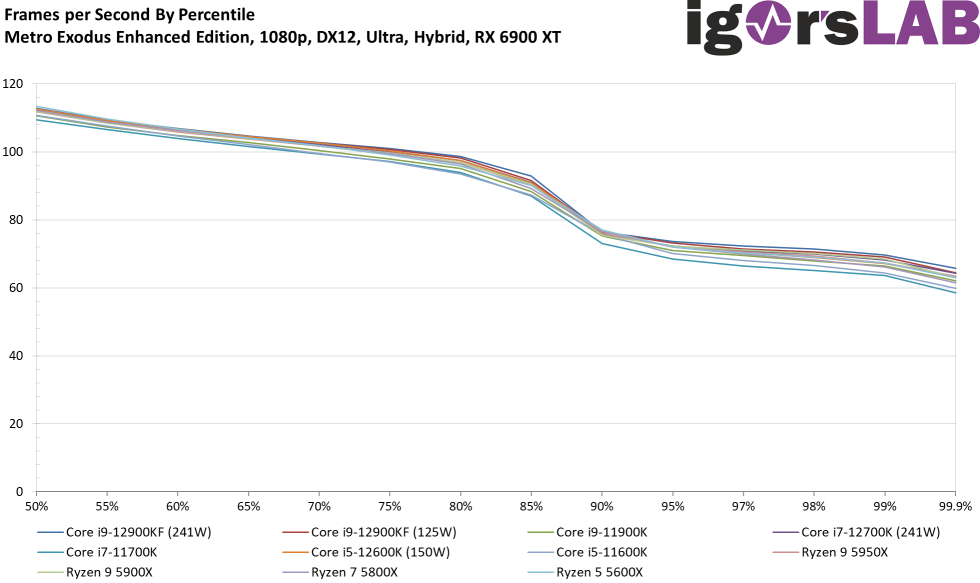
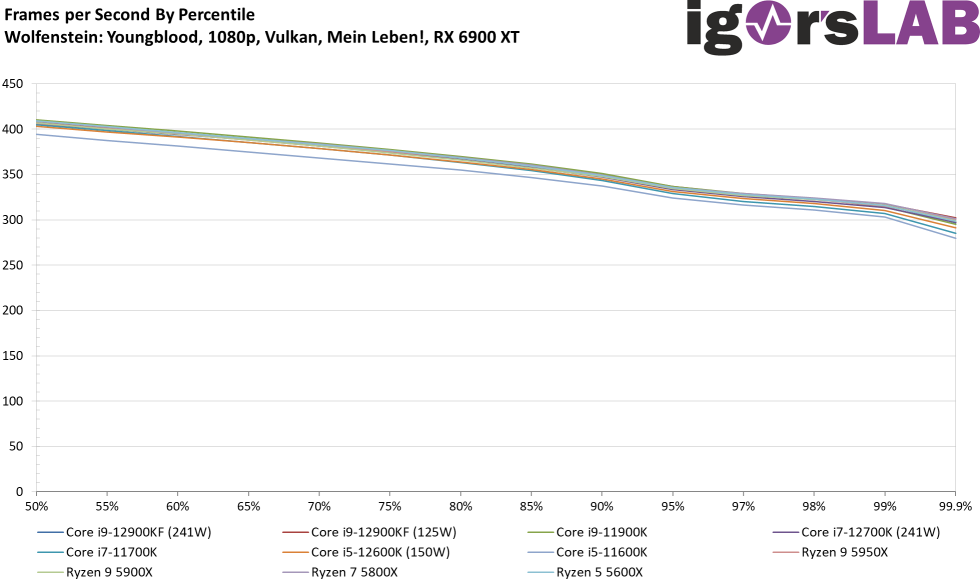
The whole thing now again as a curve with the well visible load distribution over the whole run:
Which brings us back to percentiles. And that’s where you’re actually interested not only in the P1 (1% low), but actually the whole rest of the process. From 97% upwards there is also a kink, which is usually only seen from the P1 (99%) in most graphics card tests:
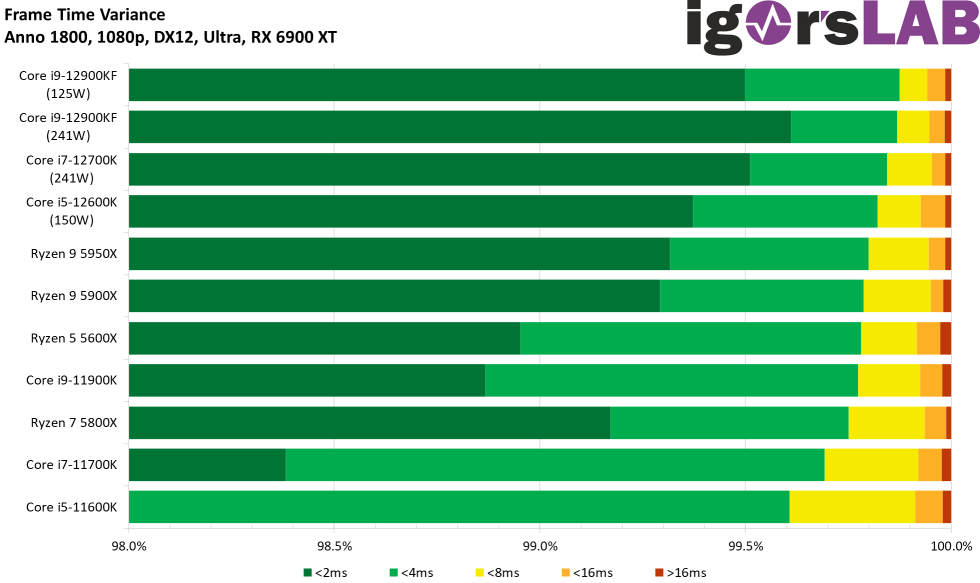
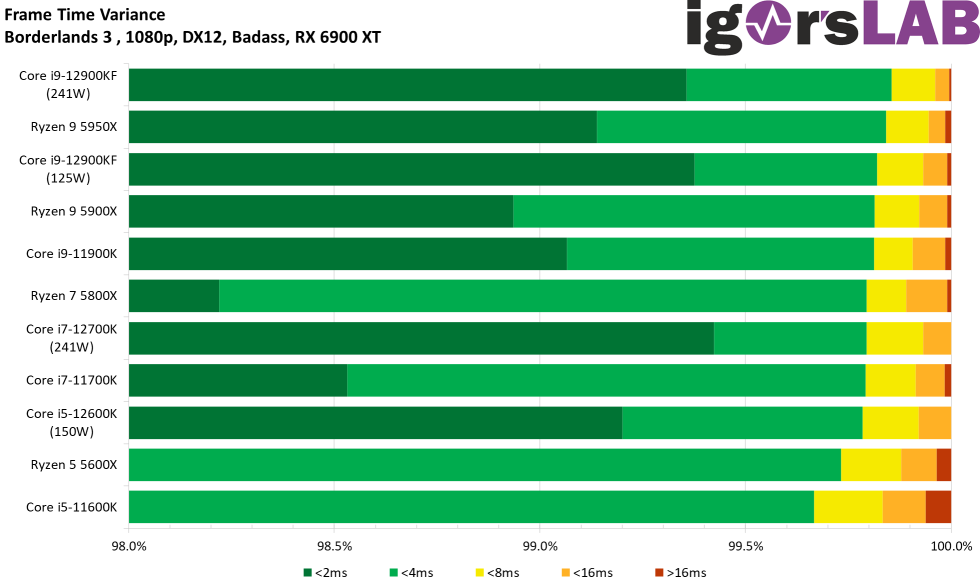
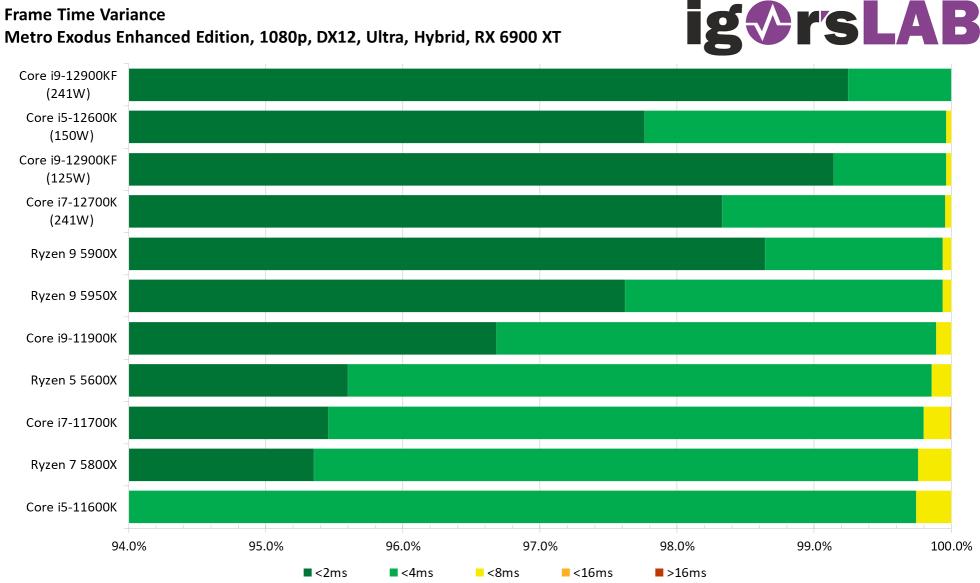
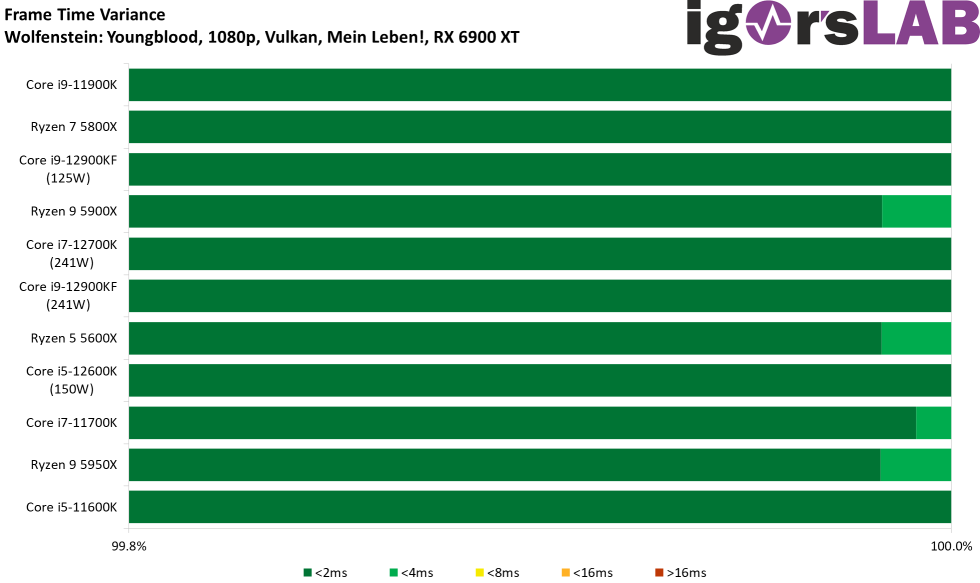
The frame times as such are again very good on all CPUs, so we’d rather look at the variances again, i.e. the image of possible stutters that could bother us:
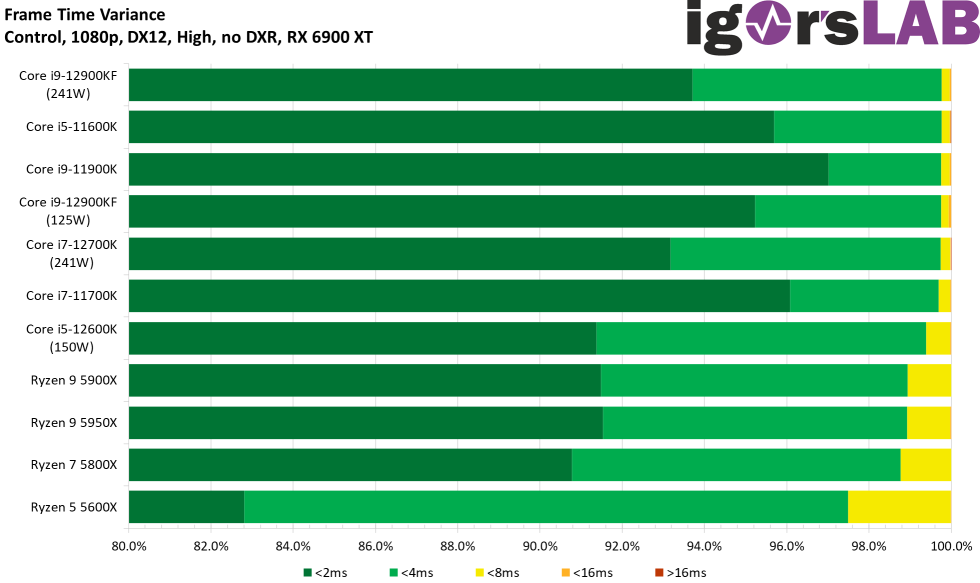
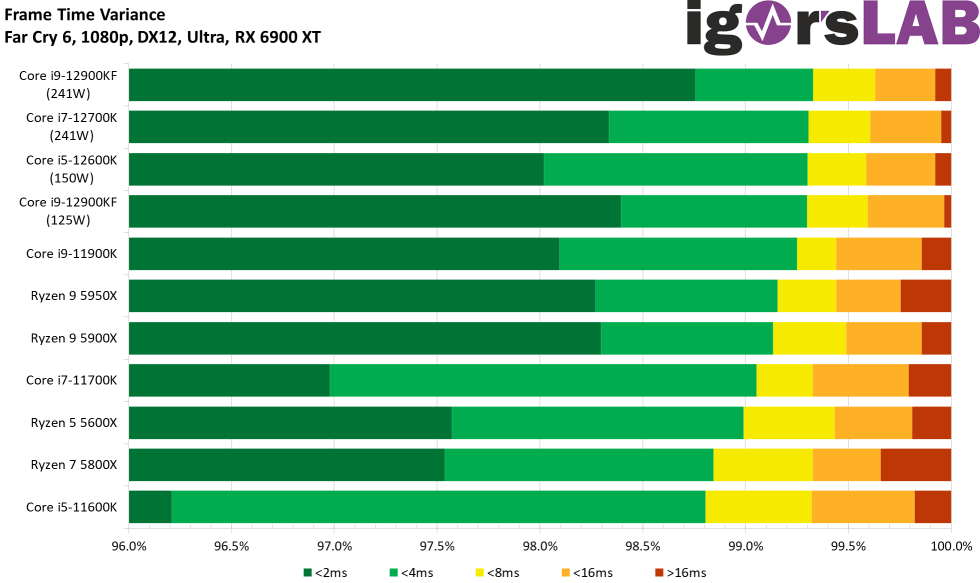
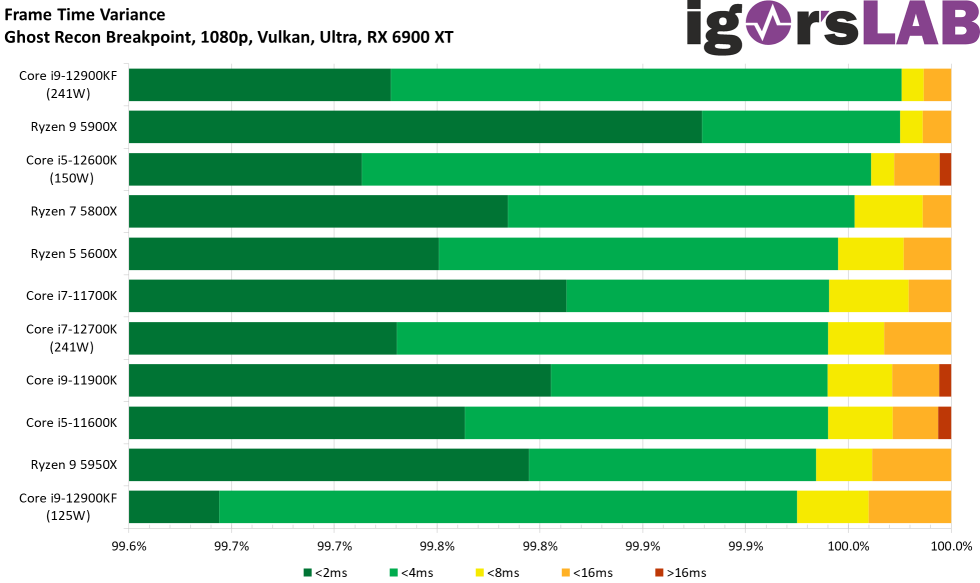
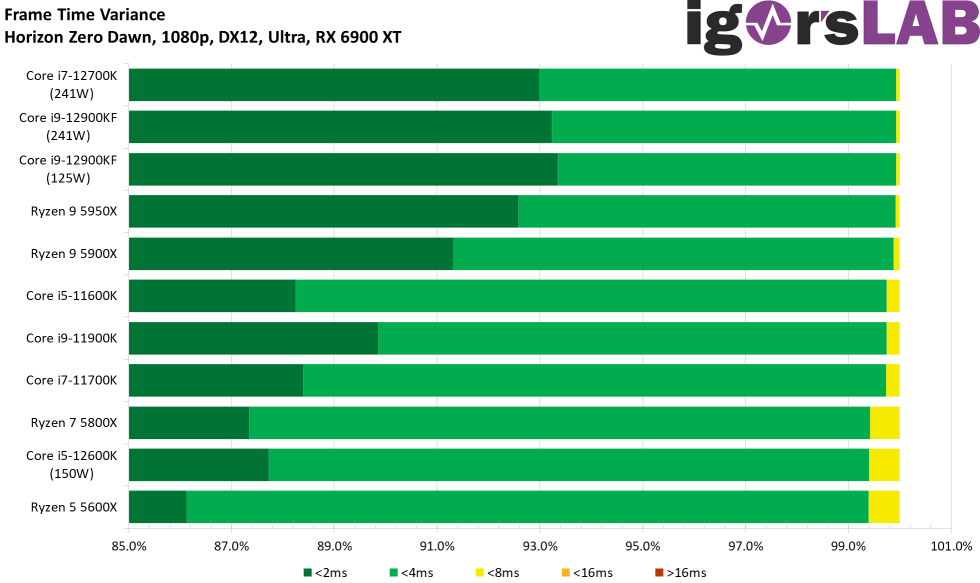
A cumulation of all games and values can be found later in the summary and overview.

- 1 - Introduction, preface and test systems
- 2 - 720p - Gaming performance
- 3 - 720p - Power consumption and efficiency
- 4 - 1080p - Gaming performance
- 5 - 1080p - Power consumption and efficiency
- 6 - 1440p - Gaming performance
- 7 - 1440p - Power consumption and efficiency
- 8 - Overall evaluation of gaming performance
- 9 - Overall evaluation of power consumption and efficiency
- 10 - Summary and conclusion for gaming


163 Antworten
Kommentar
Lade neue Kommentare
Veteran
Urgestein
Urgestein
Urgestein
Veteran
Urgestein
Urgestein
Urgestein
Veteran
Urgestein
Veteran
Urgestein
1
Moderator
Urgestein
Urgestein
Mitglied
1
Urgestein
Alle Kommentare lesen unter igor´sLAB Community →