


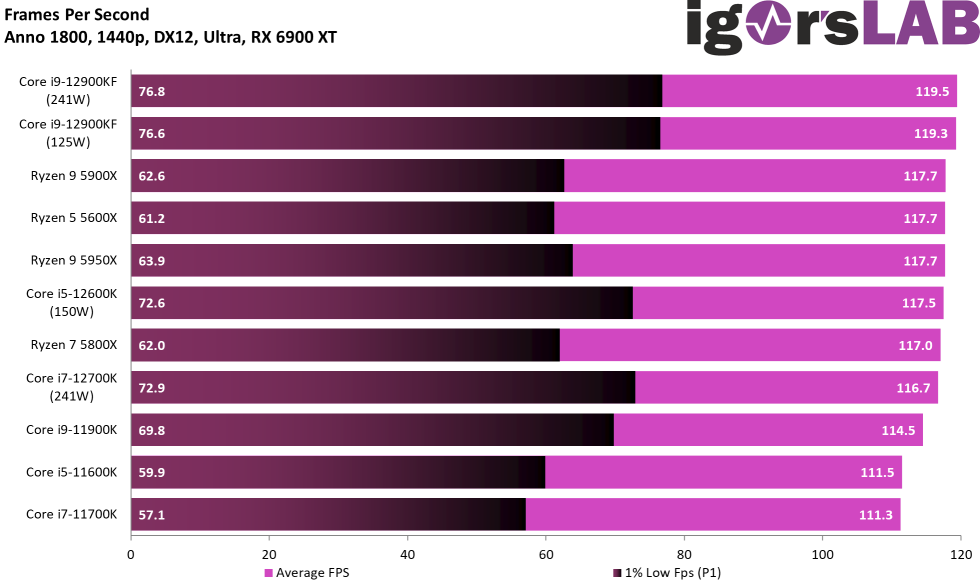
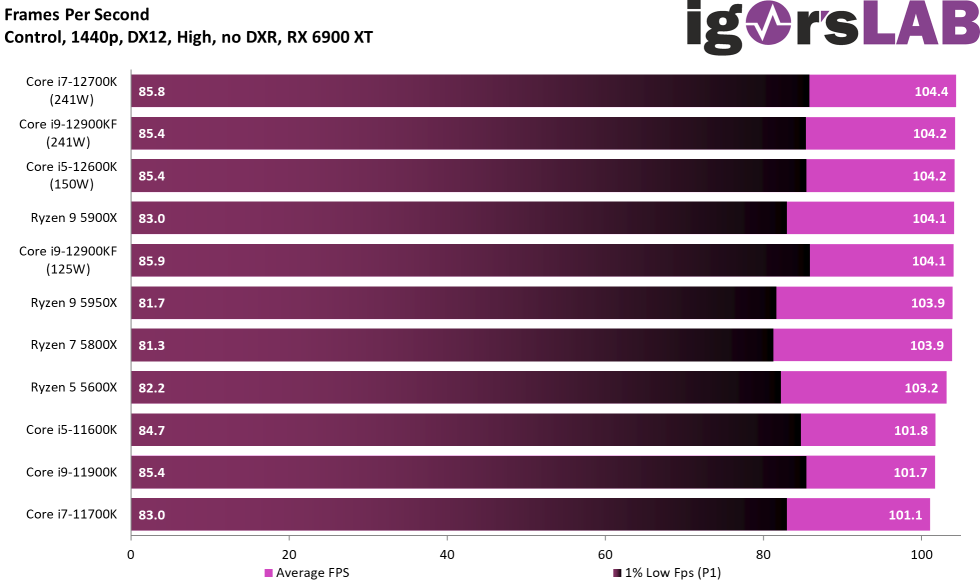
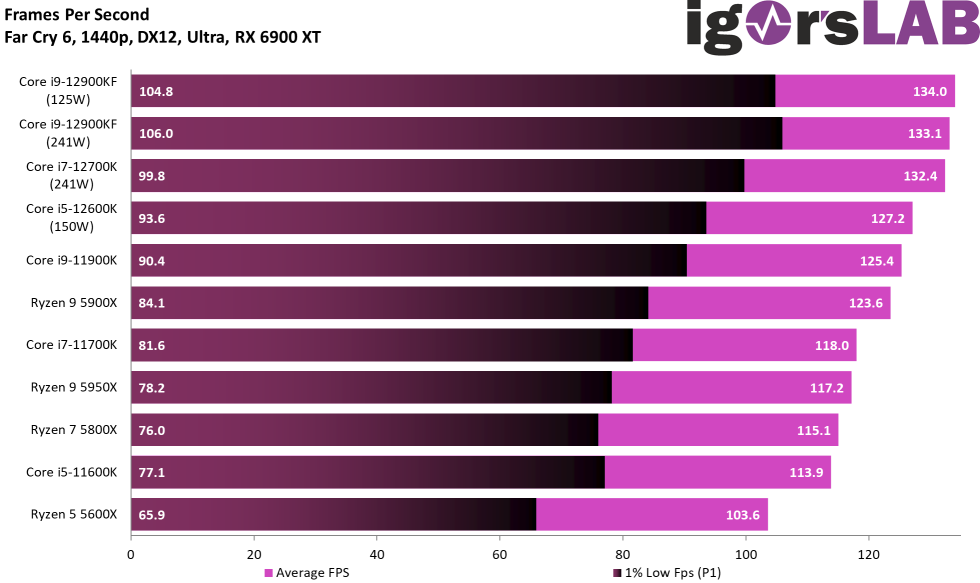
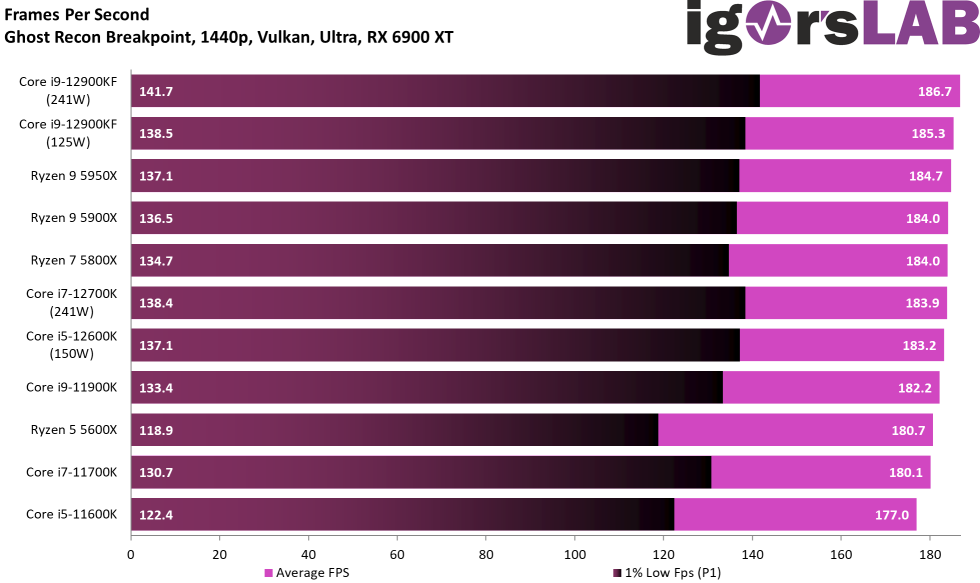
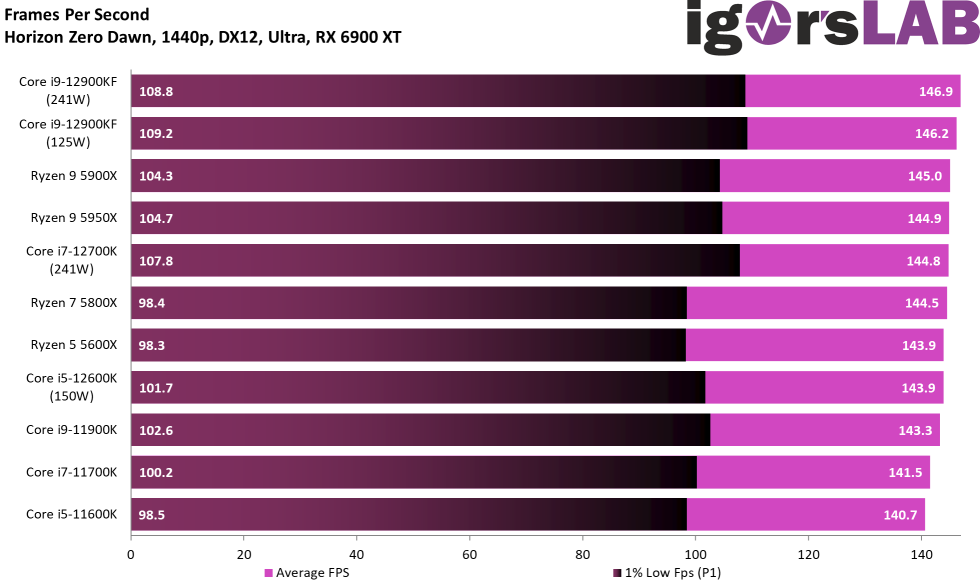
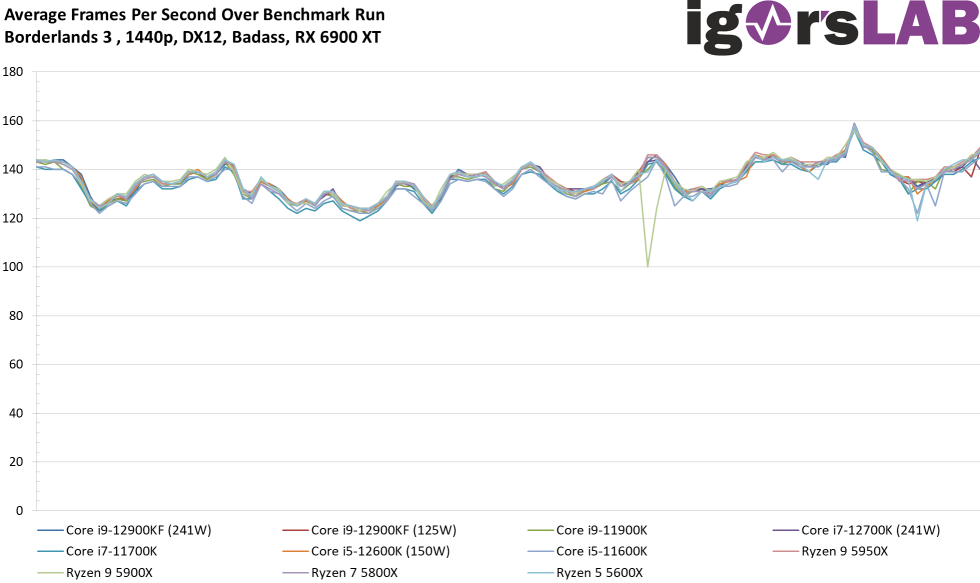
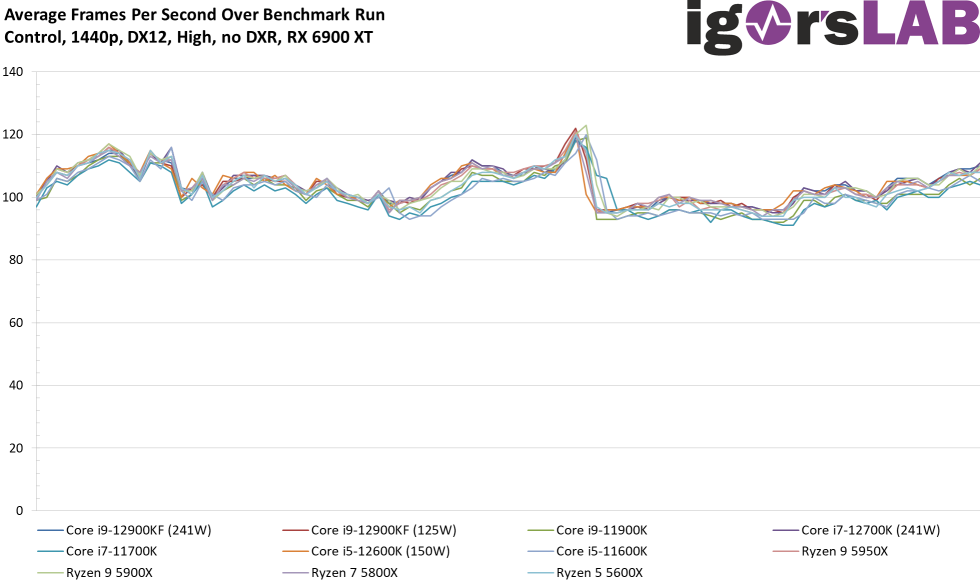
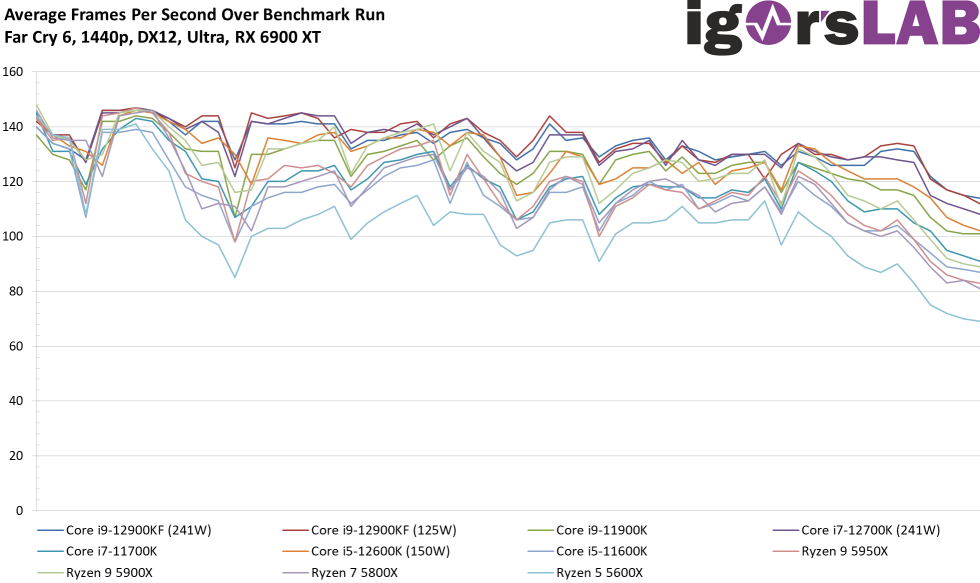
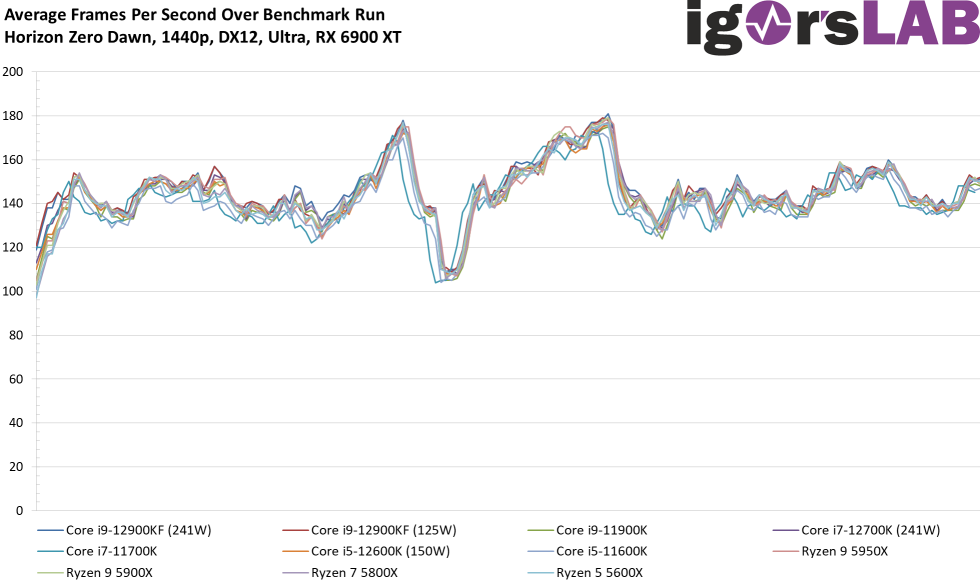
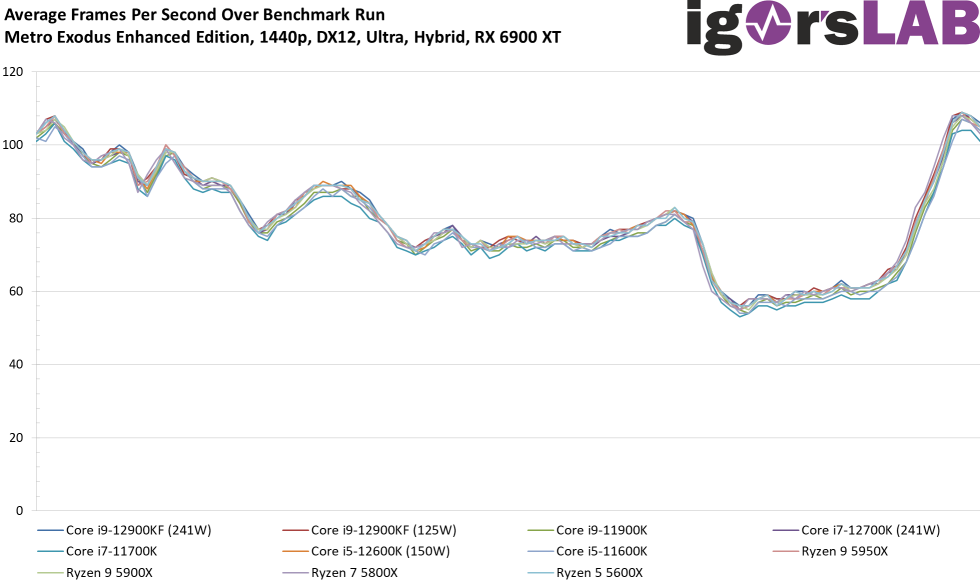
In WQHD, which is a resolution of 2560 x 1440 pixels, it now looks like the graphics card mercilessly sets the pace and the CPUs are already starting to get abysmally bored. That’s exactly why, after much deliberation, I also nixed Ultra-HD in the review just before the gate closed. But I will at least briefly show why exactly at the end. But even in WQHD, the test field of CPUs can hardly be distinguished in terms of FPS. However, it also has advantages, because you then get the power consumption later almost normalized to the almost everywhere identical performance presented.
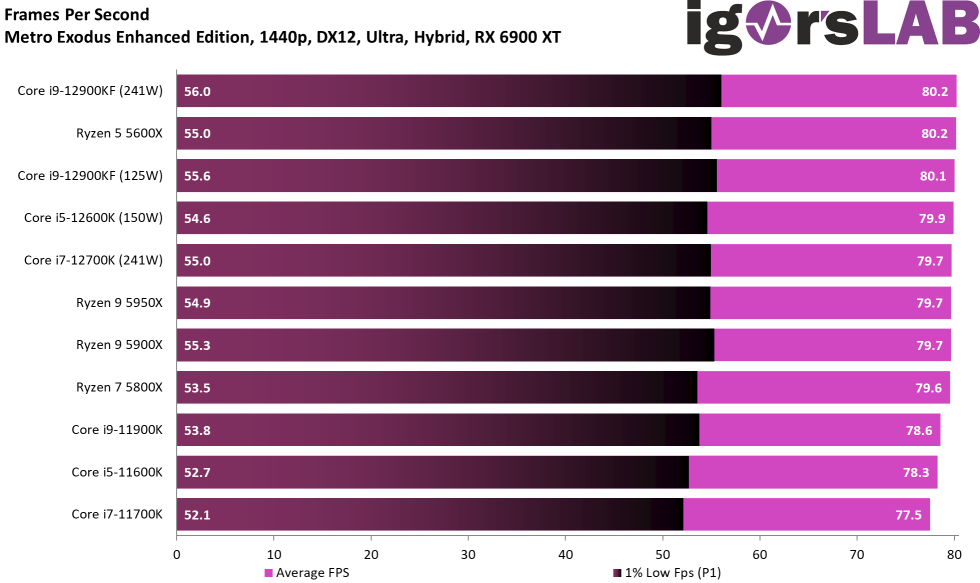
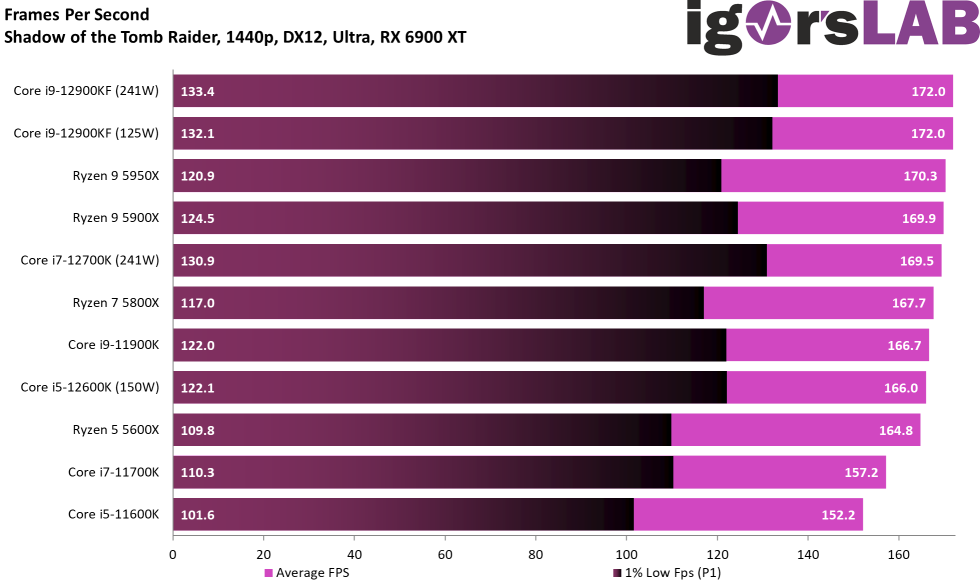
But first, all games as FPS bars again, whereby the Intel CPUs are once again ahead in the P1. Good, we’ve seen this before and it will be a pleasure to see it cumulatively later.


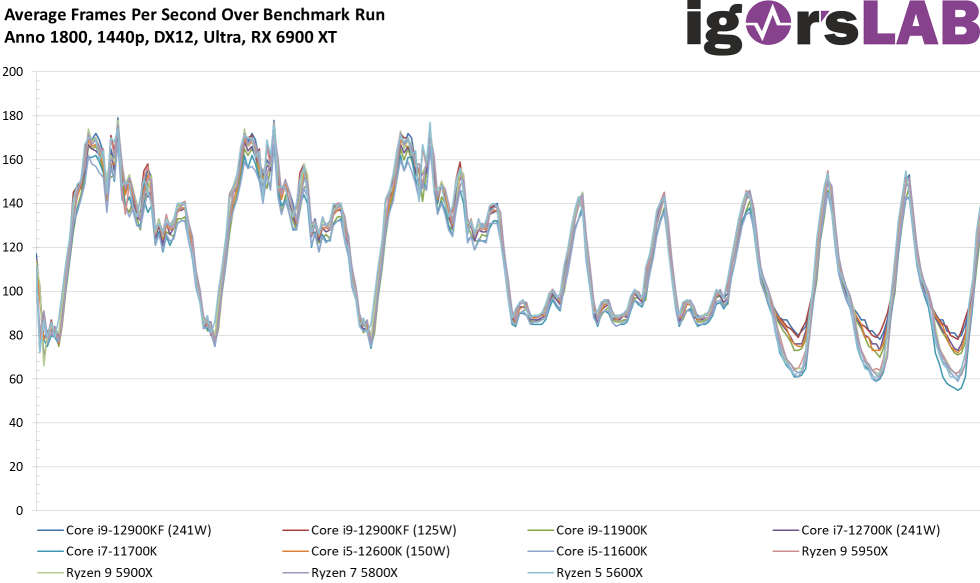
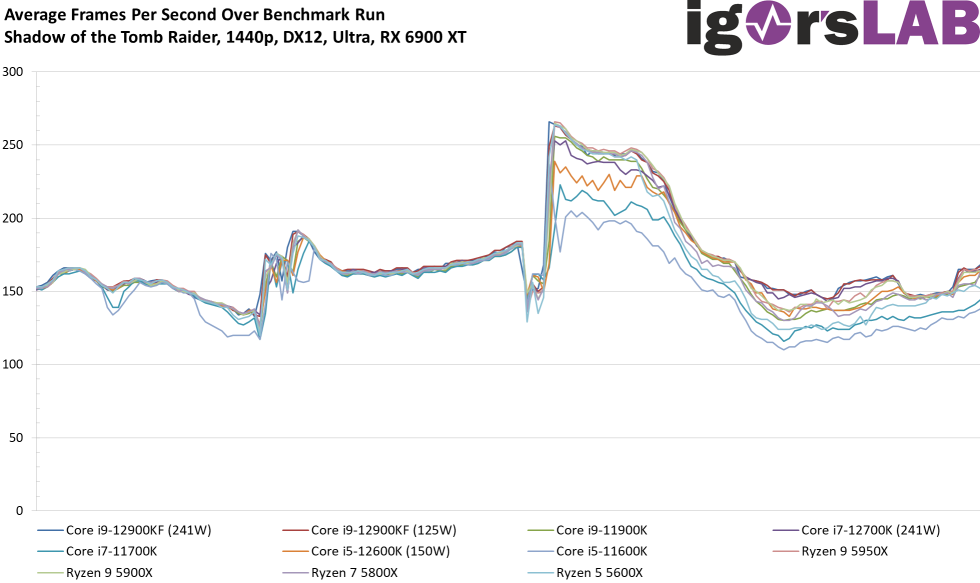
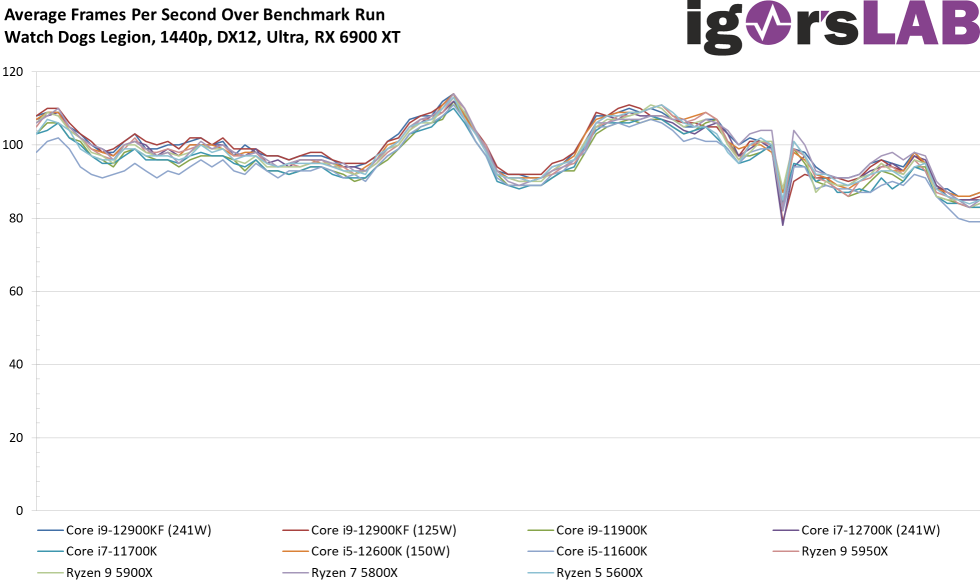
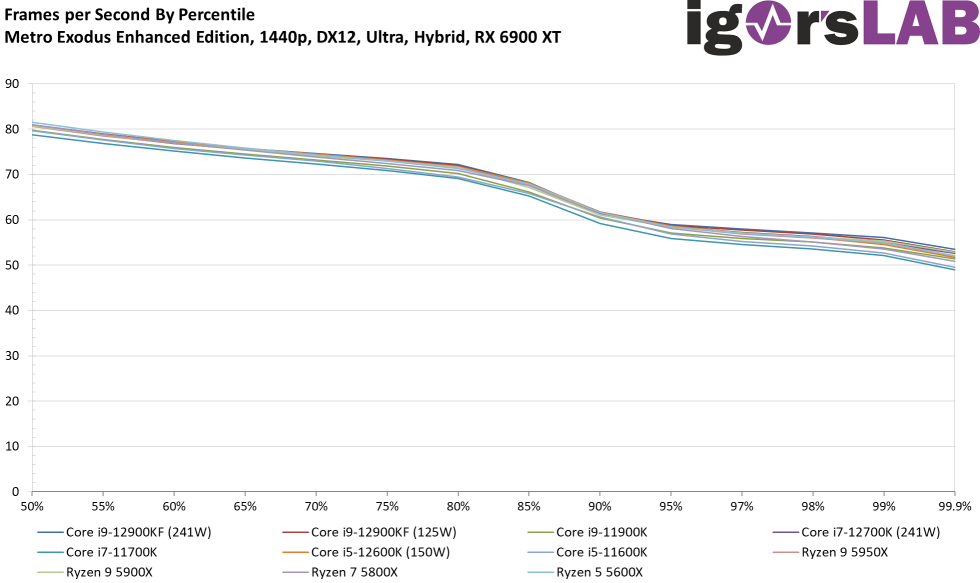
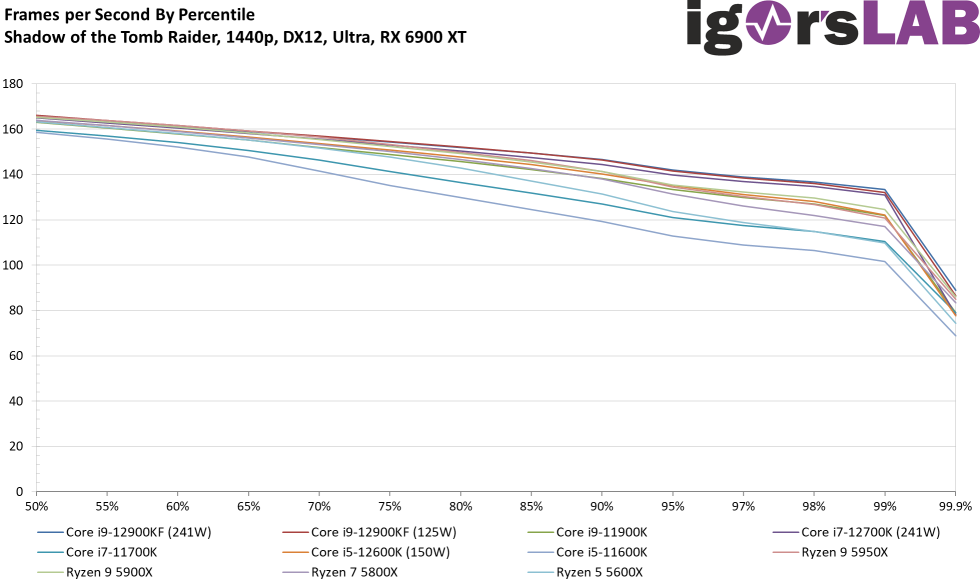
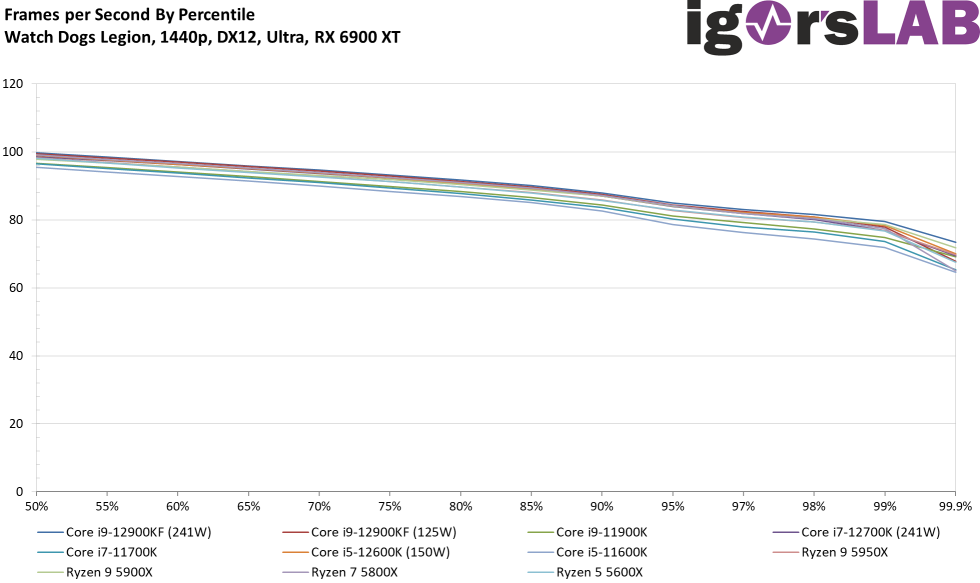
The whole thing now again as a curve with the well visible load distribution over the whole run:

Which brings us back to percentiles. And that’s where you’re actually interested not only in the P1 (1% low), but actually the whole rest of the process.
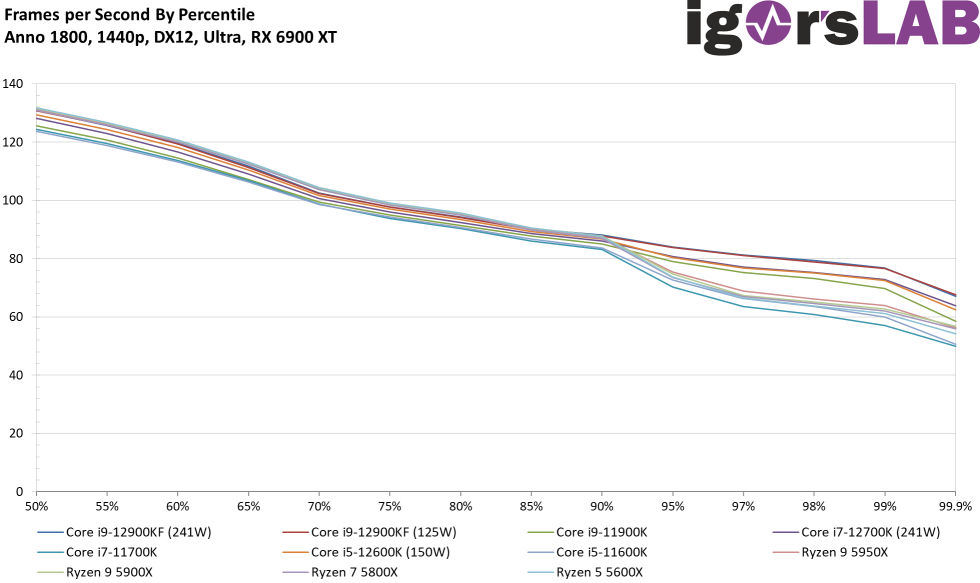
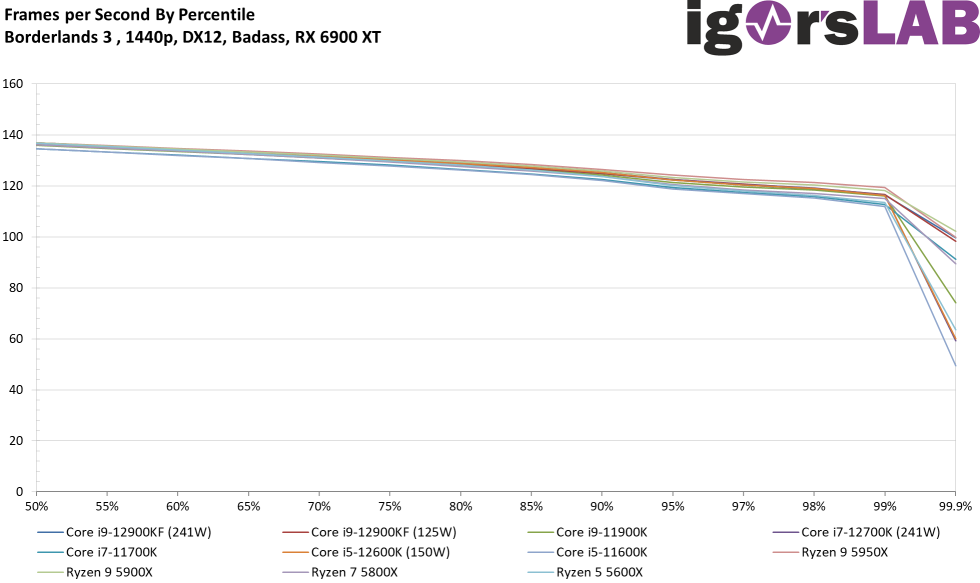
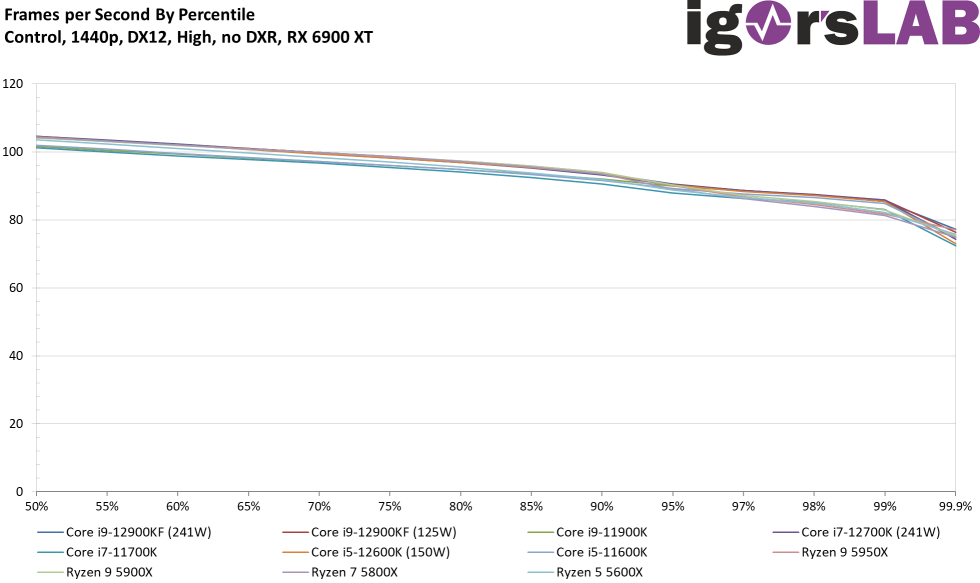
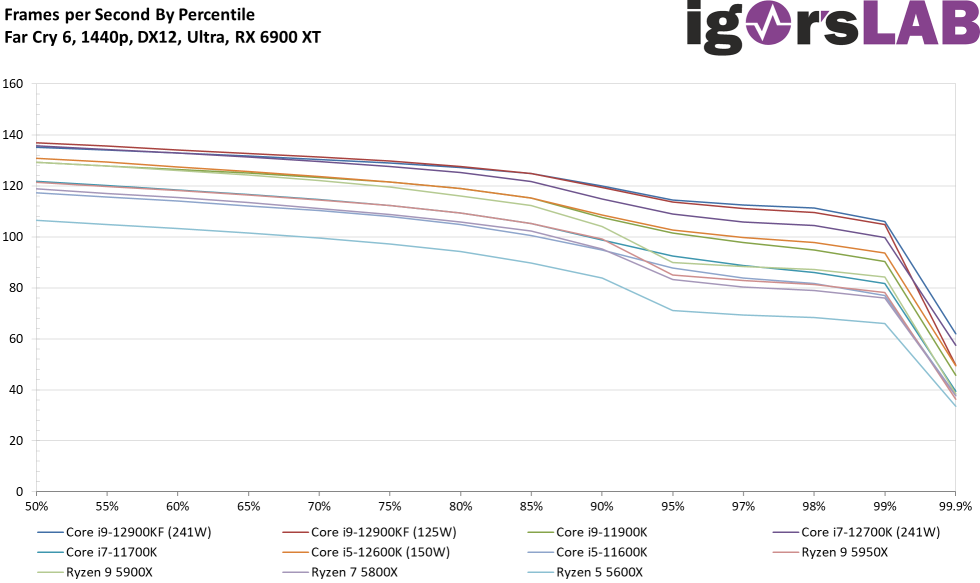
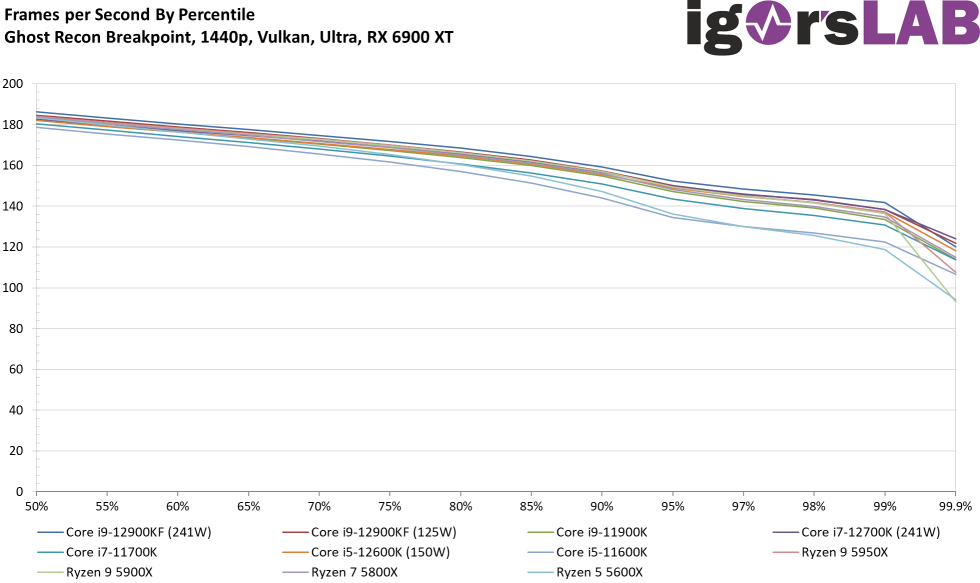

The frame times as such are again very good on all CPUs, so we’d rather look at the variances again, i.e. the image of possible jerks that could bother us:
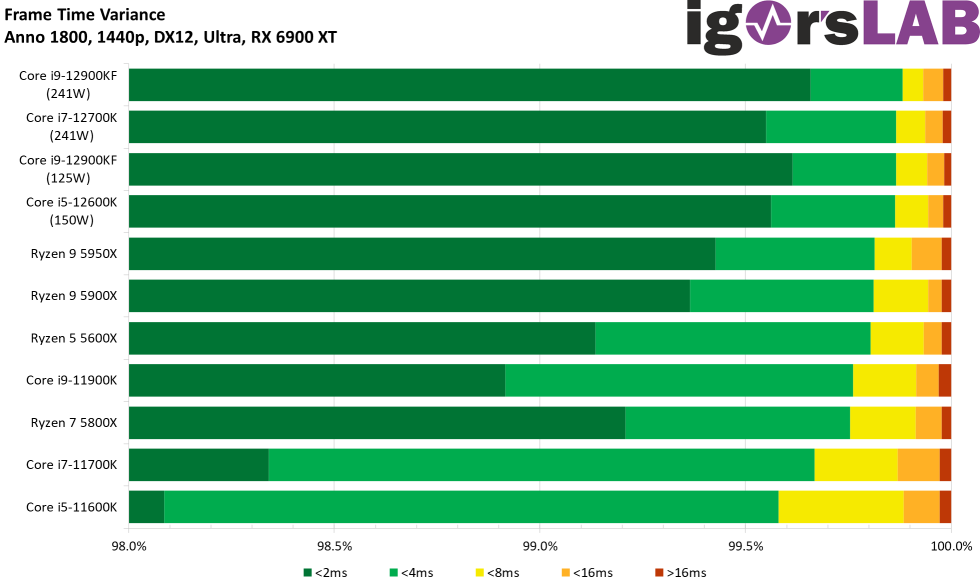
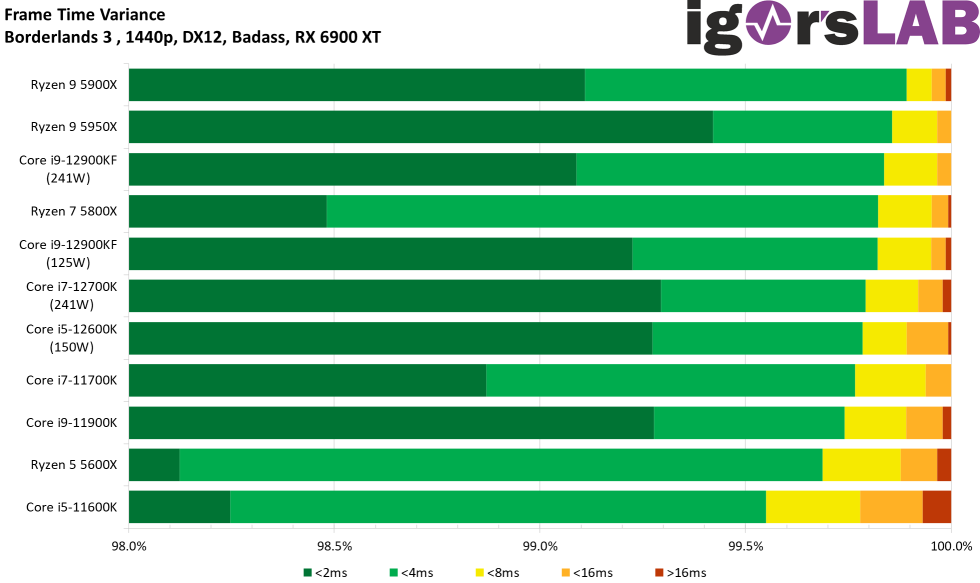
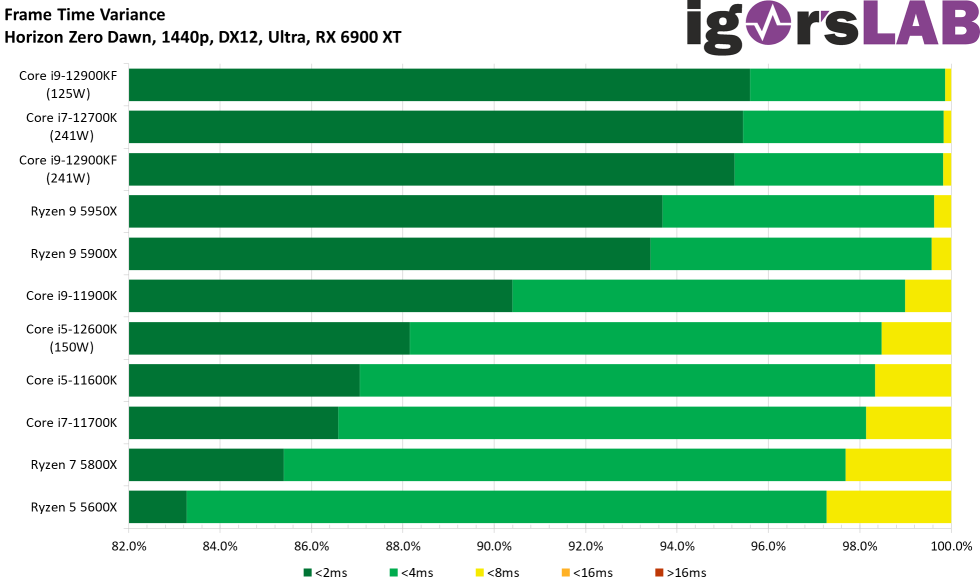

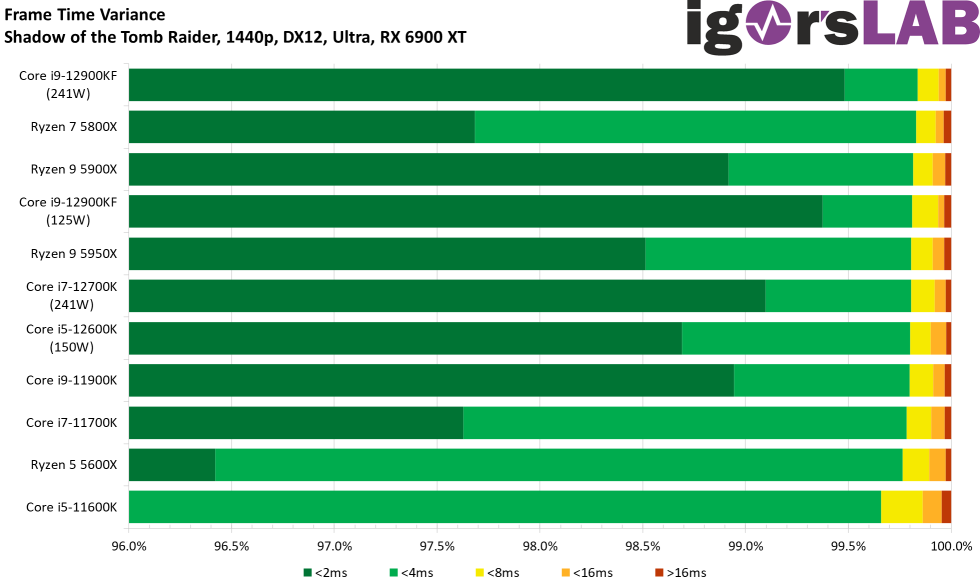

A cumulation of all games and values can be found later in the summary and overview.

- 1 - Introduction, preface and test systems
- 2 - 720p - Gaming performance
- 3 - 720p - Power consumption and efficiency
- 4 - 1080p - Gaming performance
- 5 - 1080p - Power consumption and efficiency
- 6 - 1440p - Gaming performance
- 7 - 1440p - Power consumption and efficiency
- 8 - Overall evaluation of gaming performance
- 9 - Overall evaluation of power consumption and efficiency
- 10 - Summary and conclusion for gaming


163 Antworten
Kommentar
Lade neue Kommentare
Veteran
Urgestein
Urgestein
Urgestein
Veteran
Urgestein
Urgestein
Urgestein
Veteran
Urgestein
Veteran
Urgestein
1
Moderator
Urgestein
Urgestein
Mitglied
1
Urgestein
Alle Kommentare lesen unter igor´sLAB Community →