


Important preliminary remark
We’ll do the benchmarks a bit differently today, because the characteristics of the respective architectures quickly blur in the sum of all games. In the end, these are only specially selected games, but I chose them as examples from over 20 titles and the pre-tests with two cards, because the result was almost exactly the same in the end. The weighting between the titles with pure raster graphics without DXR and with DXR was done in a ratio of 6:4, with the four DXR titles being very different. Full ray tracing fun in Cyberpunk 2077, combined with more mid-range effects like in Metro Exodus EE and the hybrid implementation of lighting all the way to Marvel’s Guardians of the Galaxy and Shadow of the Tomb Raider, where ray tracing really only comes into play humanely.
DXR is being implemented in more and more games and the current engines almost all allow it by now. From this point of view, it would be just as unfair to completely abandon such titles as it would be to use them exclusively with DXR. Since every user has different preferences and some prefer to do without DXR completely (why actually?), I accommodate all target groups a bit for once. Today’s summary is thus in three parts. Once only pure raster graphics, once only games with DXR and at the end the average of all games. I did that for WQHD and Ultra HD, because the faster cards would have run into the CPU bottleneck mercilessly in Full HD. Who wants to admire many bars of almost the same length?
The tested Radeon RX 6950XT is unfortunately the only one that is a factory overclocked board partner card, which makes the comparison a bit more difficult. However, unfortunately, nothing else was to be found. I have then summarized all the individual benchmarks on two additional pages in galleries, because transparency must of course be, also with regard to all the interesting metrics.
Sum of all games without DXR (RT Off)
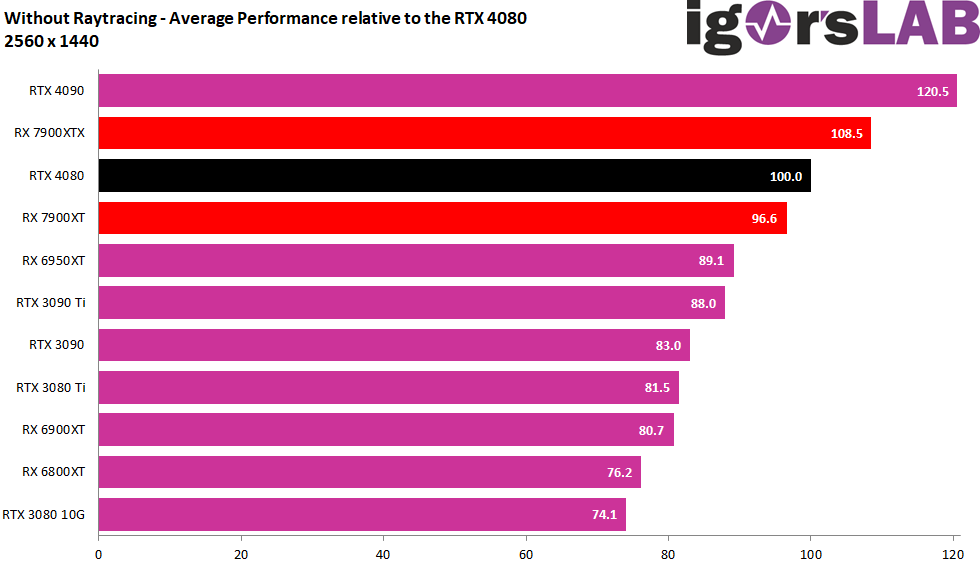
In WQHD, we still notice the slight influence of the CPU limitation in pure rasterization, but it is definitely already meaningful. The Radeon RX 7900XTX is 8.5 percentage points ahead of the GeForce RTX 4080 FE here, which in turn is 3.4 percentage points ahead of the Radeon RX 7900XT. The gap to the predecessor Radeon RX 6950XT (with factory OC) is 19.4 percentage points and without OC it would certainly be well over 20. The GeForce RTX 4090 is 12 percentage points ahead of the RX 7900XTX.
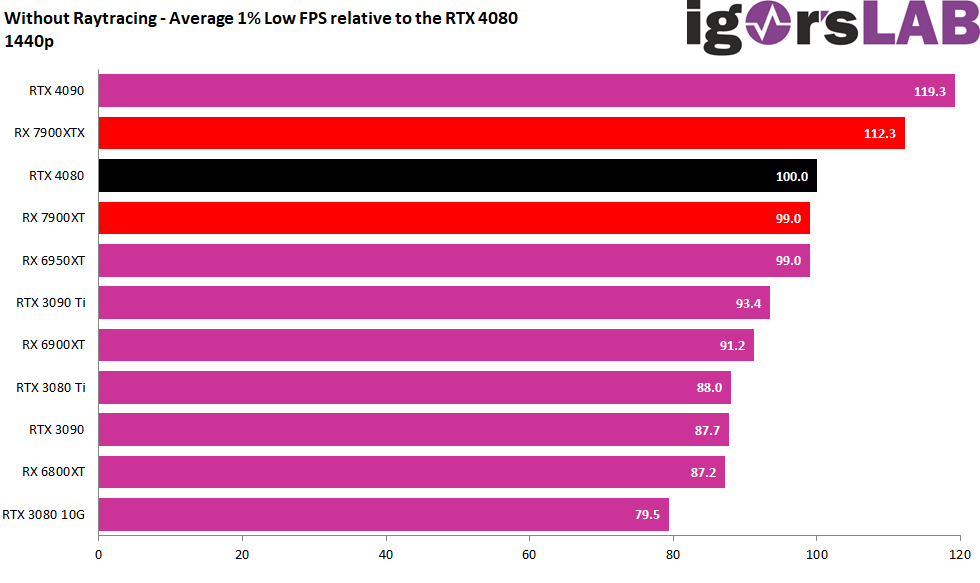
 Now let’s look at the Min-FPS, which is the one percent of the slowest rendered frames (P1 Low). Here, the Radeon RX 7900XTX is only 7 percentage points behind the GeForce RTX 4090 and the RX 7900XT is only one percentage point behind the RTX 4080.
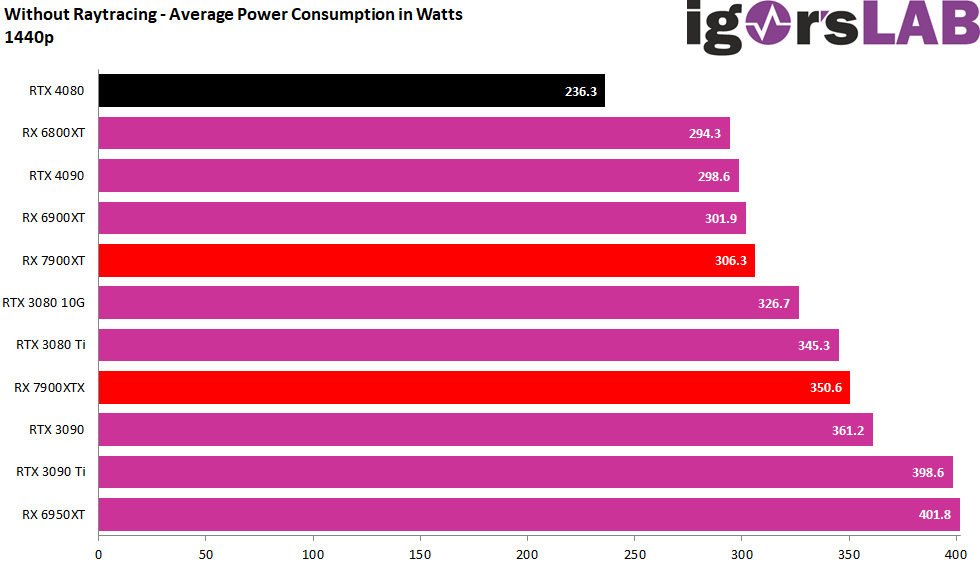
Even though I will have a very detailed chapter on power consumption and load peaks later (be sure to read it!), I also logged the power consumption over every benchmark for this game selection and also cumulated it at the end, so that a very clear picture already emerges here. The GeForce RTX 4080 is uncatchably ahead, while the only slightly slower RX 7900XT allows itself almost 70 watts more! Yes, this puts the RX 7900XT within the range of what the TBP hinted at, but it really is worlds apart. Compared to the RX 6900XT and RX 6950XT, this is of course a step forward, but a real revolution has not yet become visible, even if raster graphics is AMD’s favorite discipline. The RX 7900XT also almost fully utilizes its performance budget. The difference to the RTX 4080 is already 114.3 watts. This is a small universe.
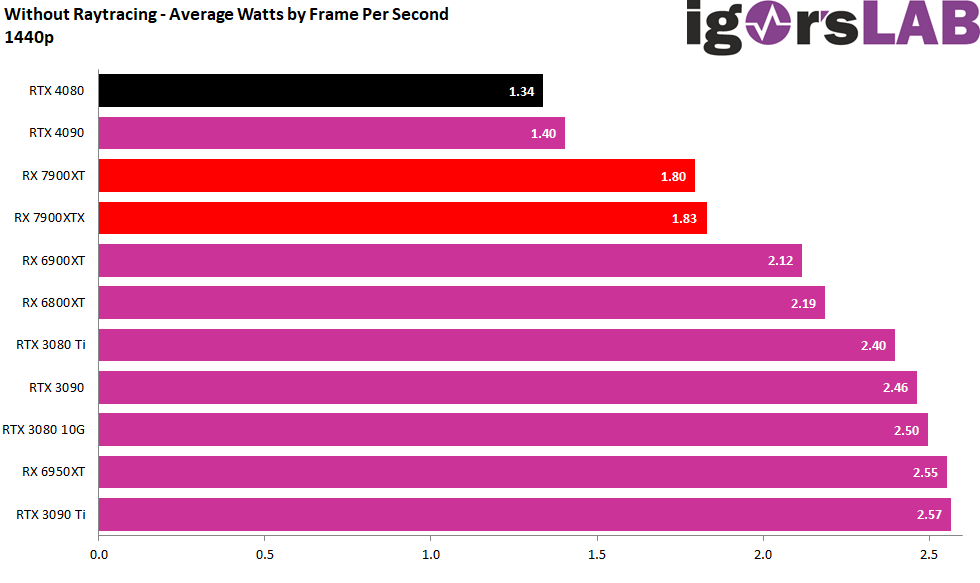
 If you now look at the resulting efficiency, you can see the difference almost more clearly. Yes, the old generation is beaten by up to 42 percent (RX 6950XT) and 18 percent (RX 6900XT) in efficiency, but that is not as great as announced as an average. However, it is interesting that the smaller RX 7900XT is a bit more efficient than the XTX.

Sum of all games with DXR (RT On)
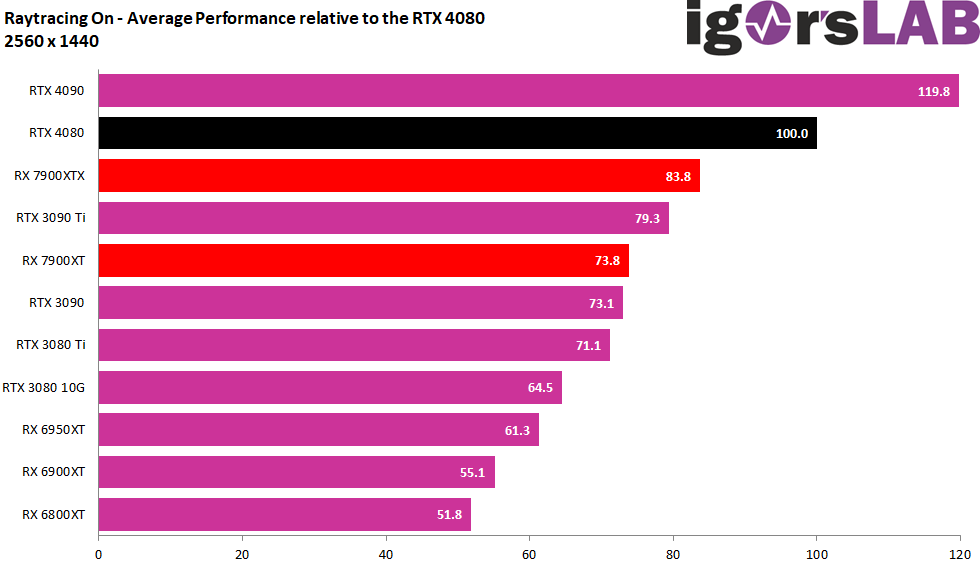
Let’s now turn things around and only evaluate the games where ray tracing is also used. AMD had promised an improvement, and that is definitely something to report. Thus, the Radeon RX 7900XTX is only 16.2 percentage points behind the GeForce RTX 4080 and it beats the formerly fastest GeForce RTX 3090 Ti by 4.5 percentage points. The RX 7900XT is 26.2 percentage points behind the RTX 4080, but still wafer-thin ahead of an RTX 3090. The increase compared to the RX 6900XT is a whopping 28.7 percentage points, compared to the factory overclocked RX 6950XT it’s still 22.5 percentage points.
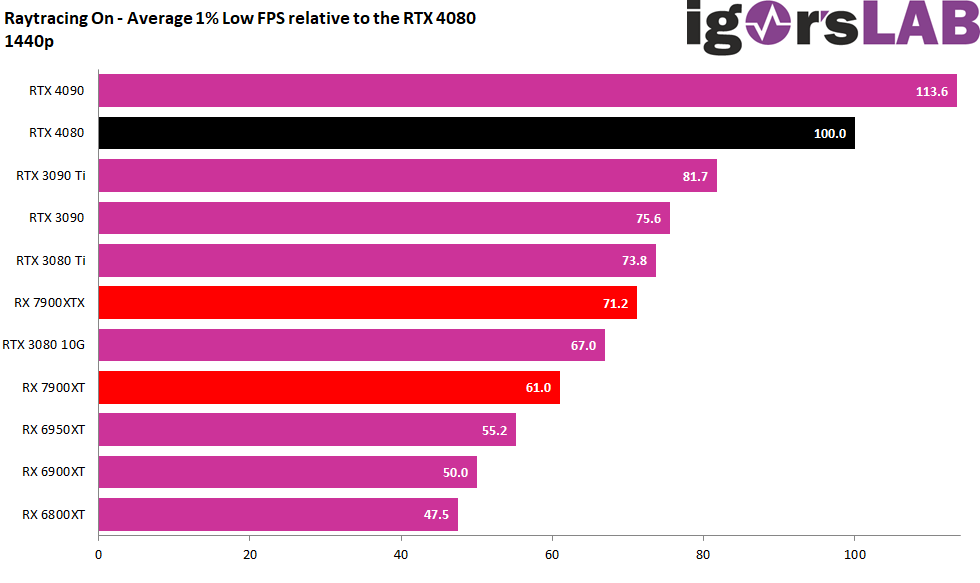
But average FPS are unfortunately not everything. The new cards then completely collapse in P1 Low compared to the RTX 4080. The 28.8 percentage points of the RX 7900XTX or even 39% of the RX 7900XT are nothing that could really calm down the scrolling. I would like to refer interested parties to the individual metrics on the following pages.
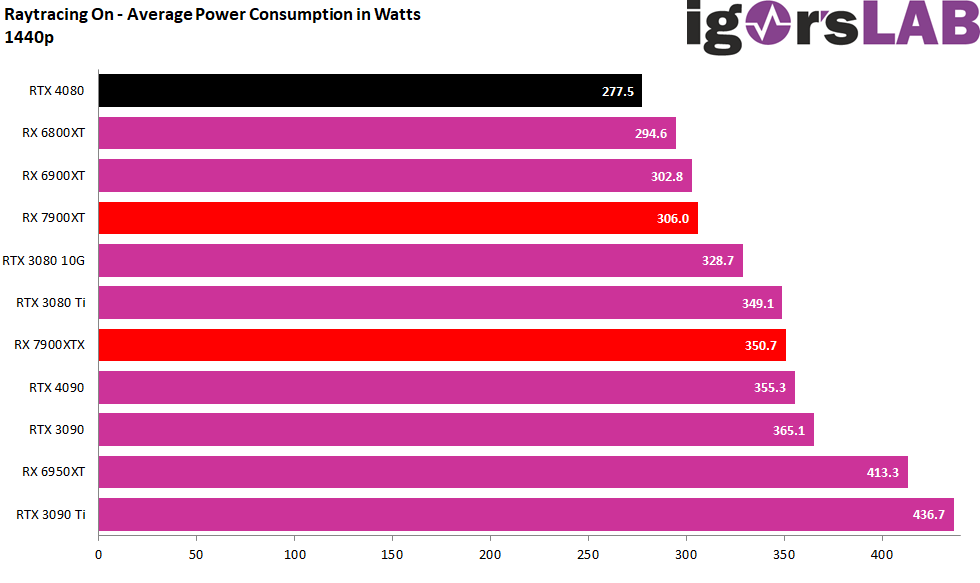
 And what happens to the power consumption? It increases to 277.5 watts for the GeForce RTX 4080, while those of the RX 7900XT and RX 7900XTX remain almost the same. However, the considerably slower cards consume 28.5 watts (RX 7900XT) and 73.2 watts more compared to the RTX 4080. That, too, is still more than clear.
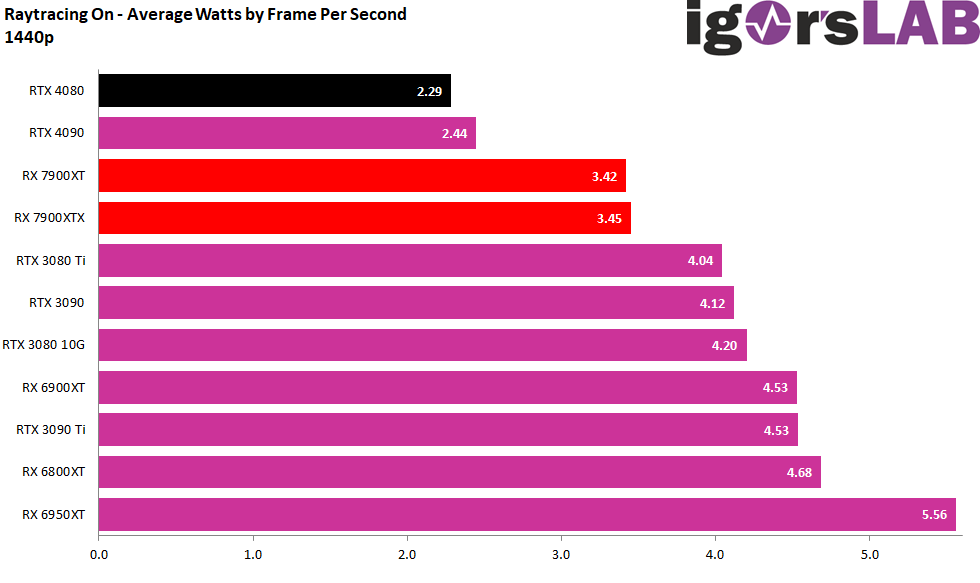
The efficiency is then the result of these differences, even if they can set the Radeons apart a bit more clearly compared to the predecessor. So DXR is still anything but a parade discipline for the new Radeon cards.

Sum of all games
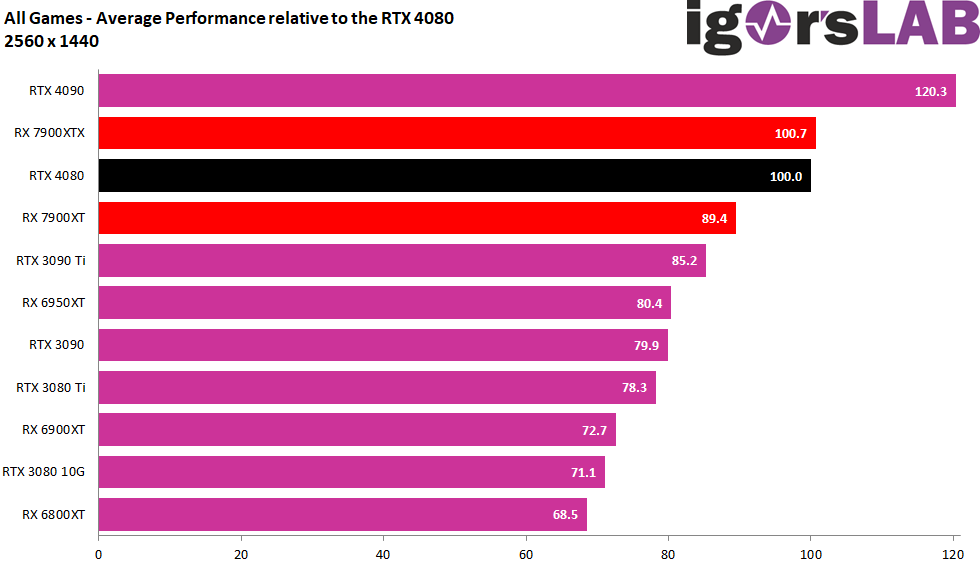
For the third evaluation I use all games, whether with or without DXR. This is certainly the best representation of everyday life, where the number of games without DXR still clearly outweighs the number of games without DXR, but you don’t want to do without it anymore. For now, the picture looks like the Radeon RX 7900XTX and the GeForce RTX 4080 are virtually on par in WQHD, while the RX 7900XT has a gap of 10.6 percentage points. This is all tighter than expected, but also shows that you would actually be enough for WQHD even with a Radeon RX 7900XT.
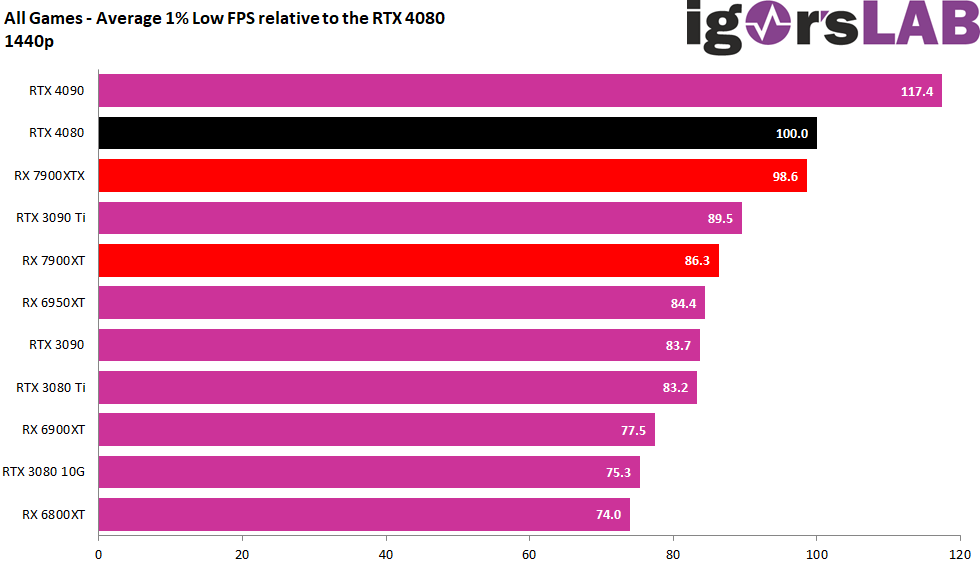
The P1 Low, on the other hand, is a different story. While the RX 7900XT is only a scant 1.4 percentage points behind the RTX 4080, it is already 13.7 percentage points for the RX 7900XT, which then also falls behind the RTX 3090 Ti. We already know the reasons (DXR).
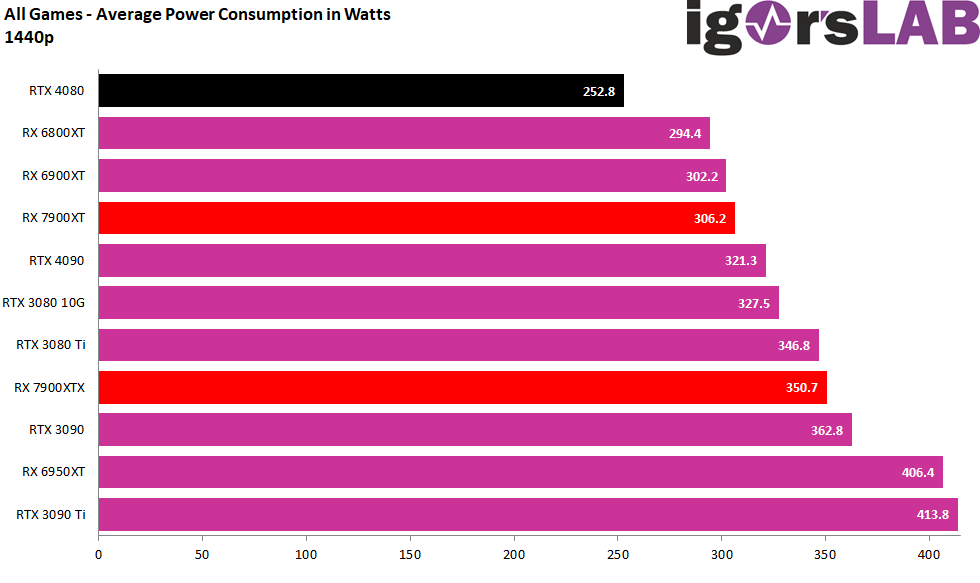
But what about the power consumption? On average, the Radeon RX 7900XTX is almost 98 watts behind the GeForce RTX 4080, which is still 38.7% more! The RX 7900XT looks at least a bit better with 53.4 watts or 21.1%. But even these values are still a small humiliation, unfortunately.
 That brings us to the end of WQHD and we want to see if anything changes in Ultra HD. Please turn the page once!

- 1 - Introduction, technical data and technology
- 2 - Test system with the igor'sLAB PC from MIFCOM
- 3 - Teardown: PCB and Components
- 4 - Teardown: Cooler and disassembly help
- 5 - Summary gaming performance WQHD (2560 x 1440)
- 6 - Summary gaming performance Ultra-HD (3840 x 2160)
- 7 - Single charts for WQHD (2560 x 1440)
- 8 - Single charts for Ultra-HD (3840 x 2160)
- 9 - Workstation graphics and rendering
- 10 - Power consumption in detail and load balancing
- 11 - Transients, limits and PSU recommendation
- 12 - Clock rates, temperatures and infrared
- 13 - Fan speed and Noise
- 14 - Summary and conclusion


892 Antworten
Kommentar
Lade neue Kommentare
Mitglied
1
Urgestein
Urgestein
Mitglied
Mitglied
Neuling
Urgestein
Veteran
Urgestein
Neuling
Urgestein
1
Urgestein
Veteran
Mitglied
Mitglied
Urgestein
Mitglied
Alle Kommentare lesen unter igor´sLAB Community →