


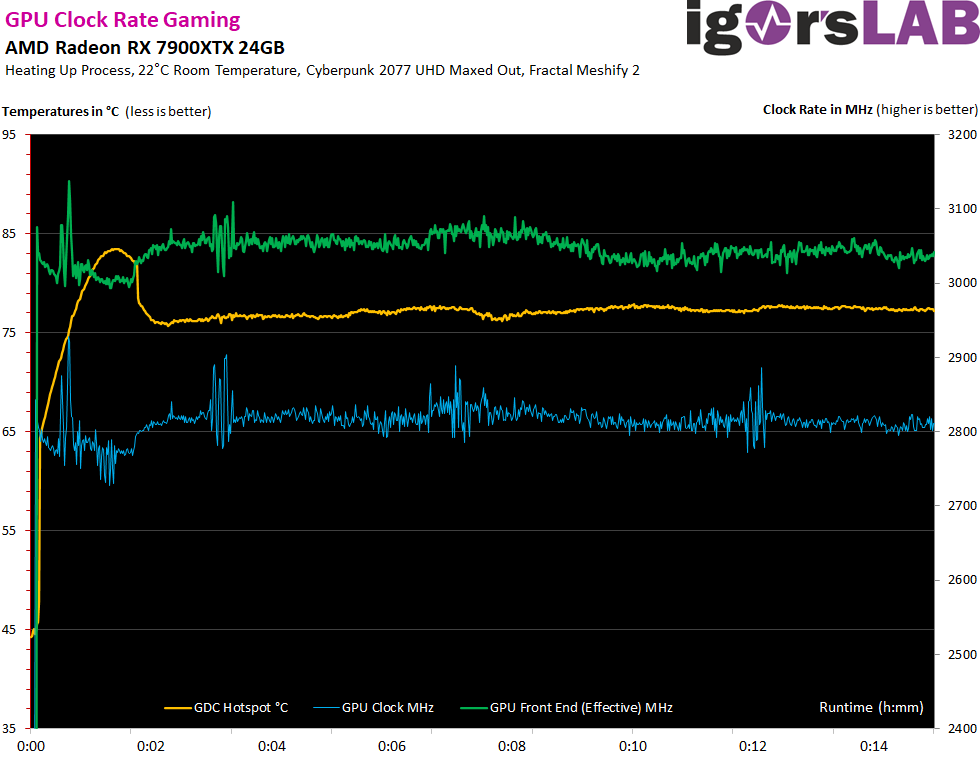
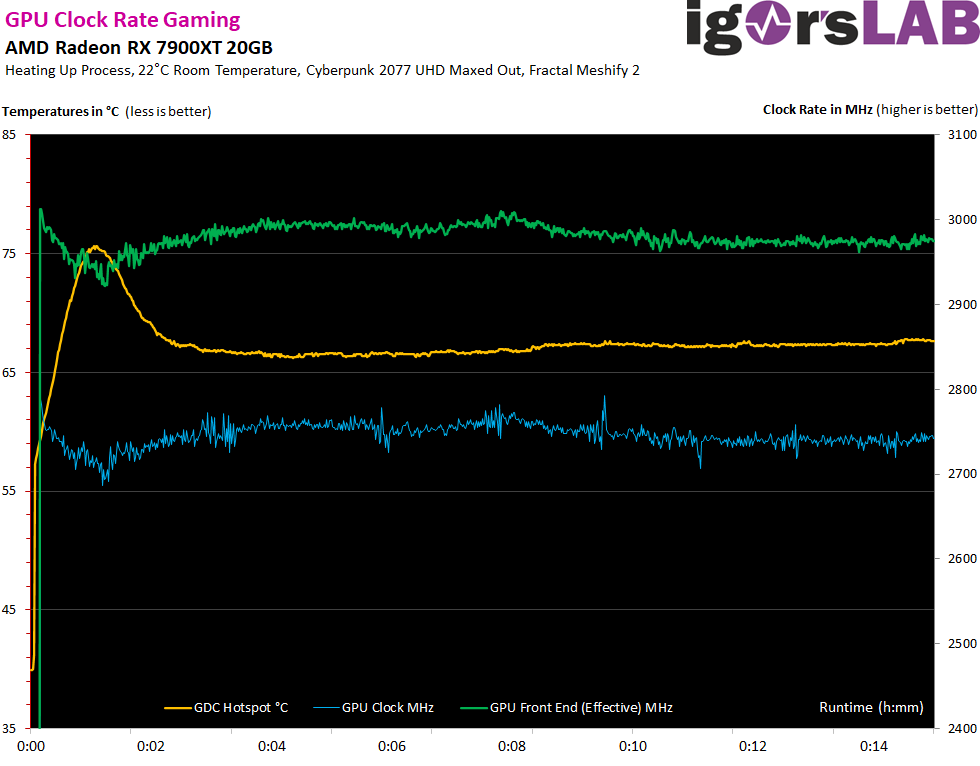
Real achievable clock rates and overclocking
The clock rates and readout is kinda fancy. I have coupled my own PDM with HWInfo64 for this purpose, because most tools do not render the frequencies correctly. AMD once speaks of the significantly lower GPU clock and once of the so-called GPU front-end clock, which should be something like an effective clock. While the GPU clock of the Radeon RX 7900XTX is usually above 2.8 GHz, the values of the RX 7900XT are around 500 MHz lower. The front end is then at 3.05 GHz on average or at 2.96 GHz, which is about 100 MHz lower. We also see the clock rate drop when the temperature has risen before the fans lower the hotspot (as a reference point for the control) again.
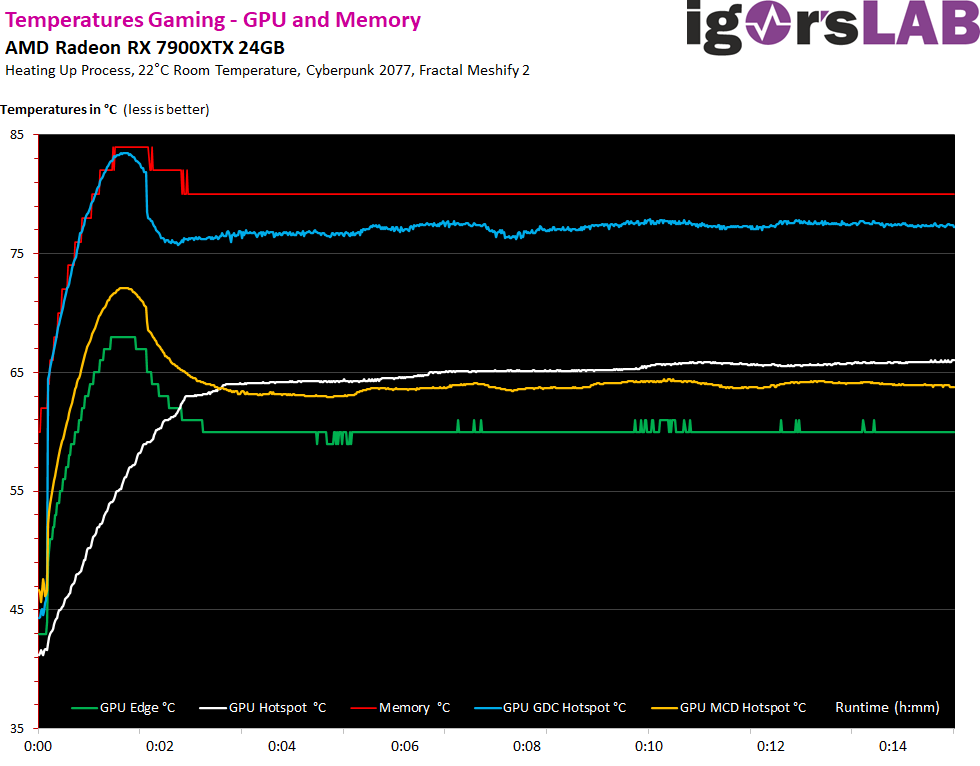
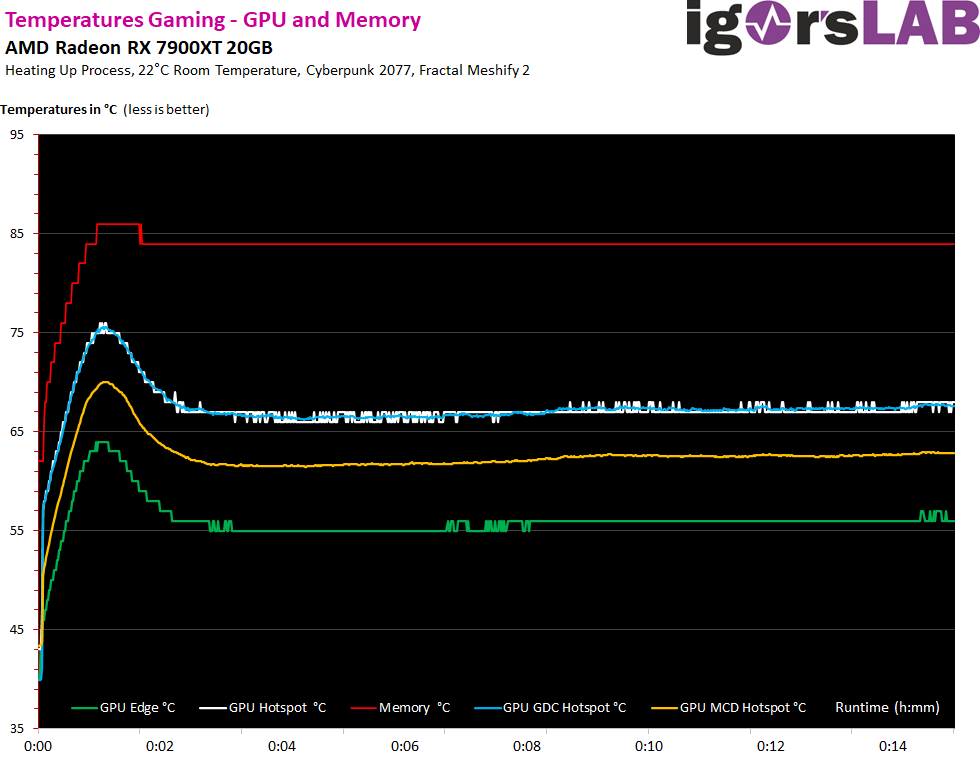
GPU temperatures in the case
The differences are not as big as feared if you use a decent case. Because in the end, the card does not convert much more waste heat than the predecessor models. If you close the panel, the GPU temperature (Edge) increases by 2 Kelvin, the GDC hotspot increases by up to 4 Kelvin. You can see, especially with the RX 7900XTX, that the cooler has probably almost reached its limit, because every watt more would audibly drive the fans.
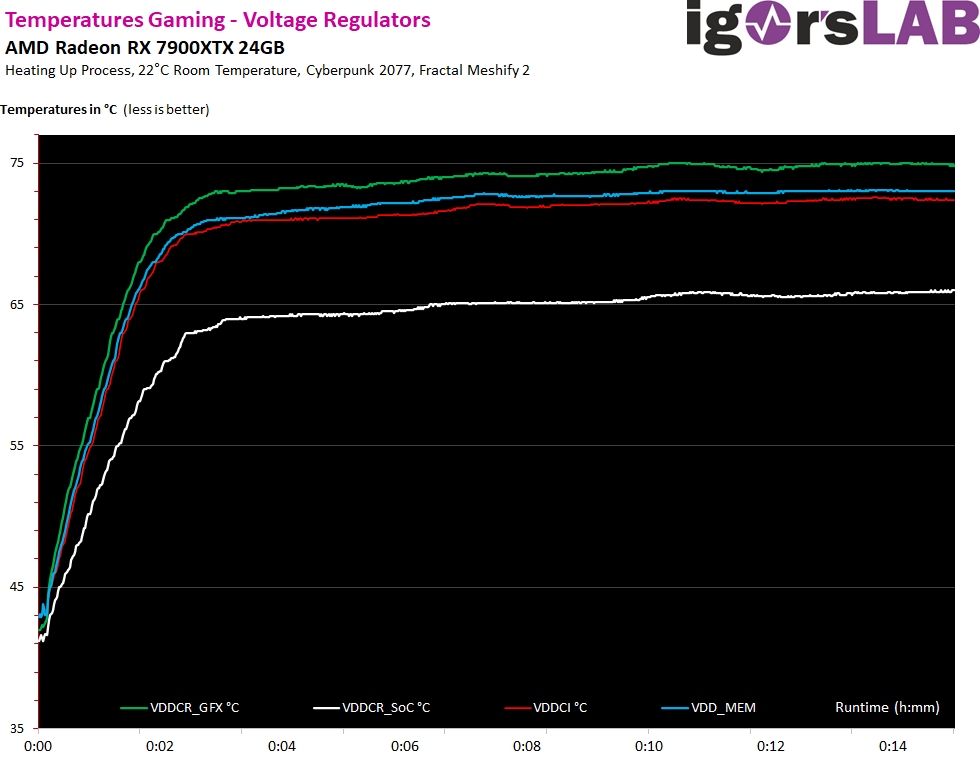
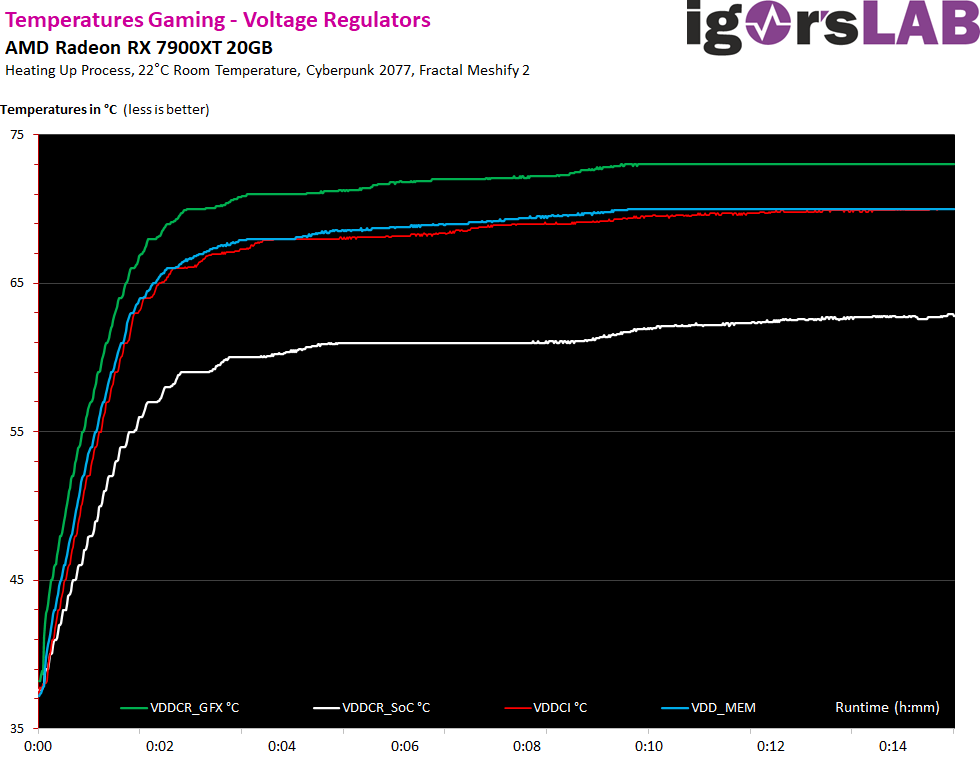
VRM temperatures in the case
Since AMD has to monitor all voltage converters in order to fulfill the goal of a TBP estimation as well as possible, values for the temperatures drop here as well. These in turn can now also be read out via Sensor Loop.
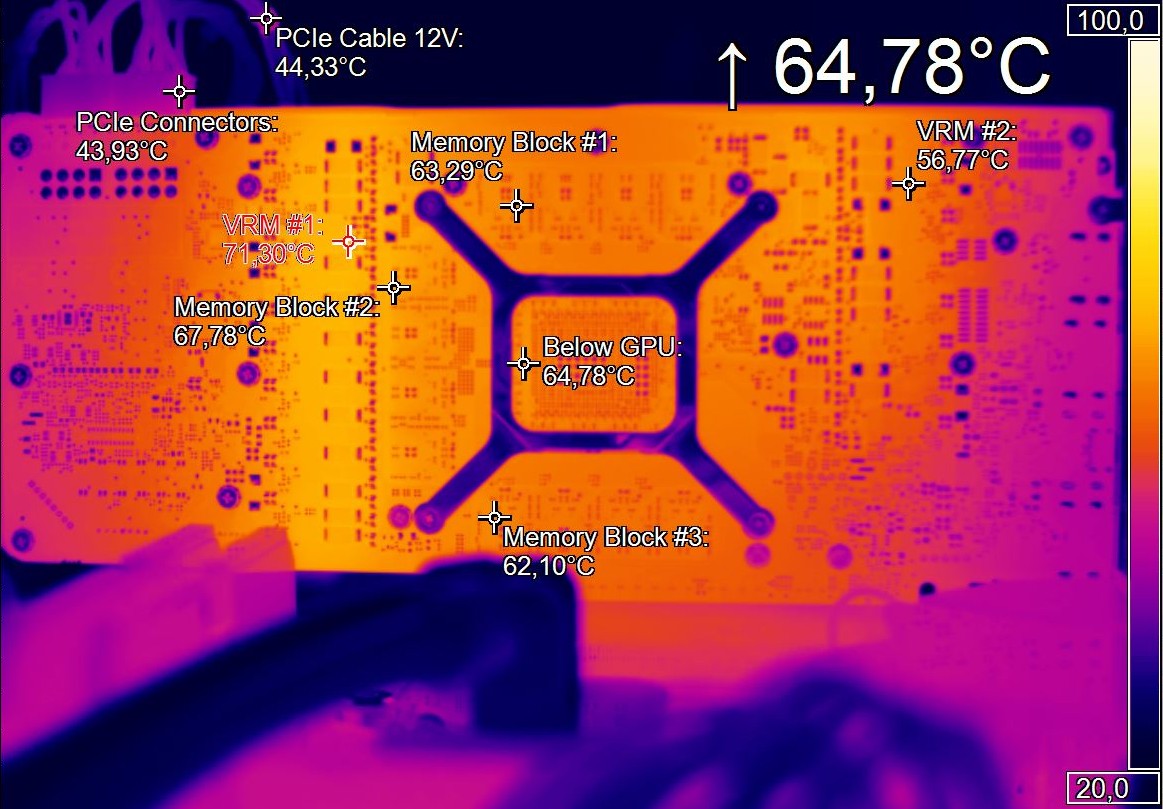
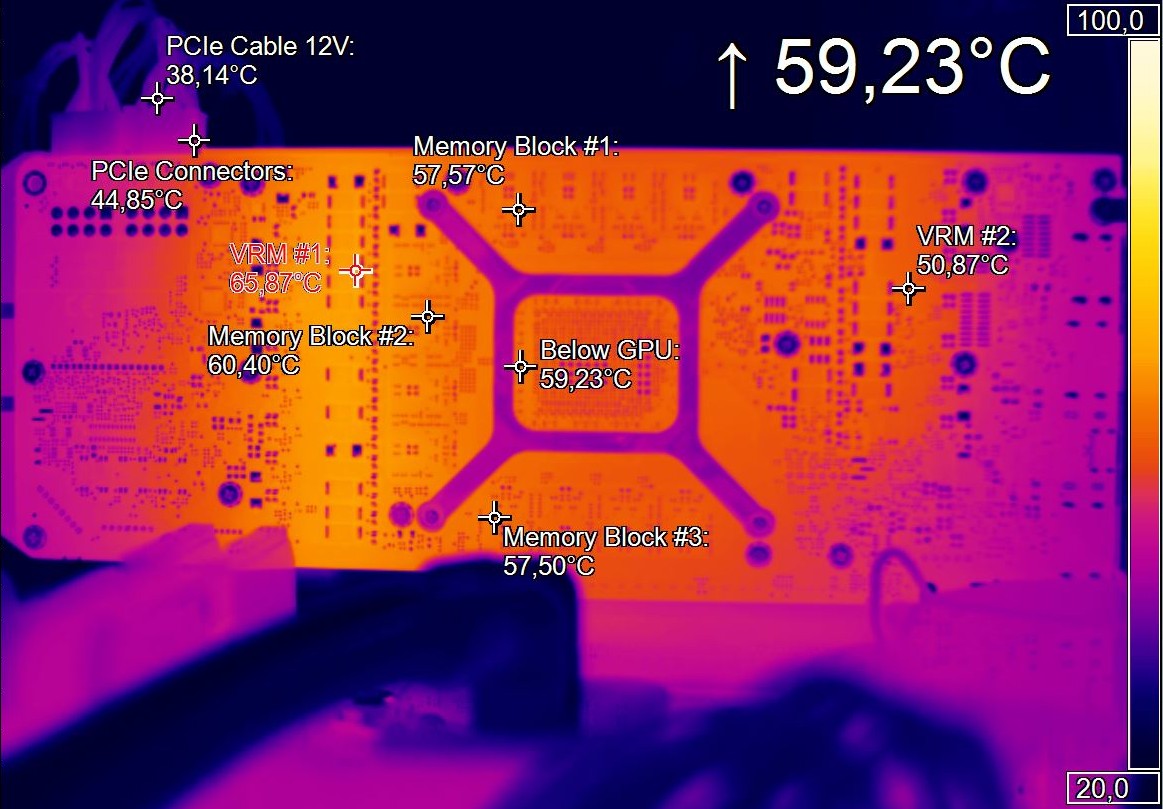
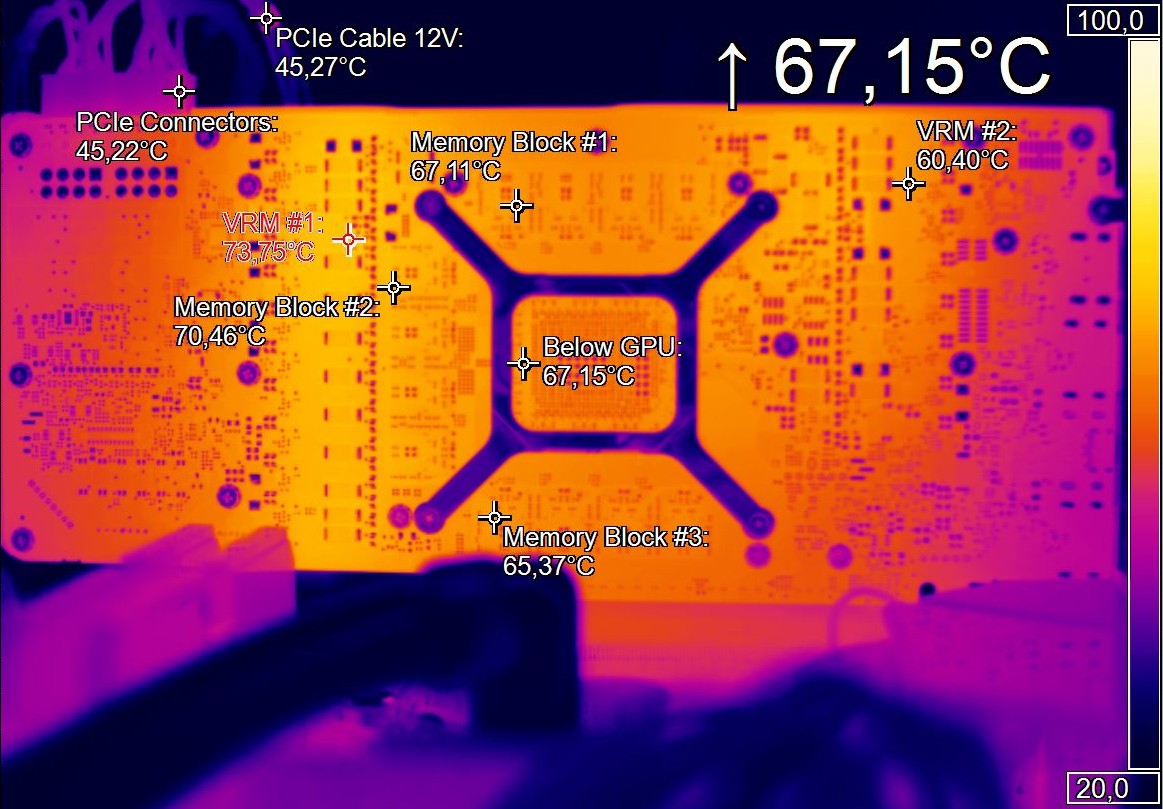
Infrared measurements (heat flow analysis)
Let’s start with the gaming loop and we see that the 45 watts more that an RX 7900XTX requires cannot be completely absorbed by the larger cooler either. However, the fan control of the RX 7900XT also acts a bit differently, so we should also pay attention to the next chapter.
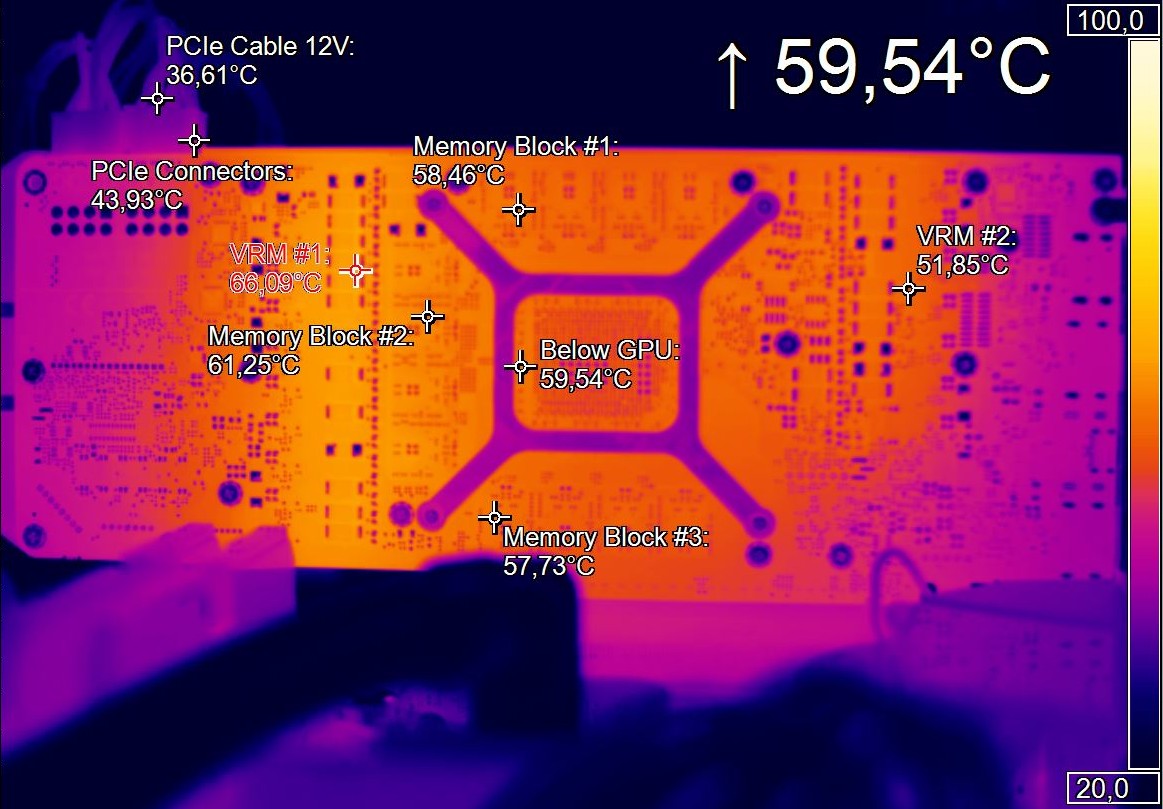
The temperatures of both cards increase a bit in the stress test, but the same applies here. Balancing act between cooling performance and fan noise.
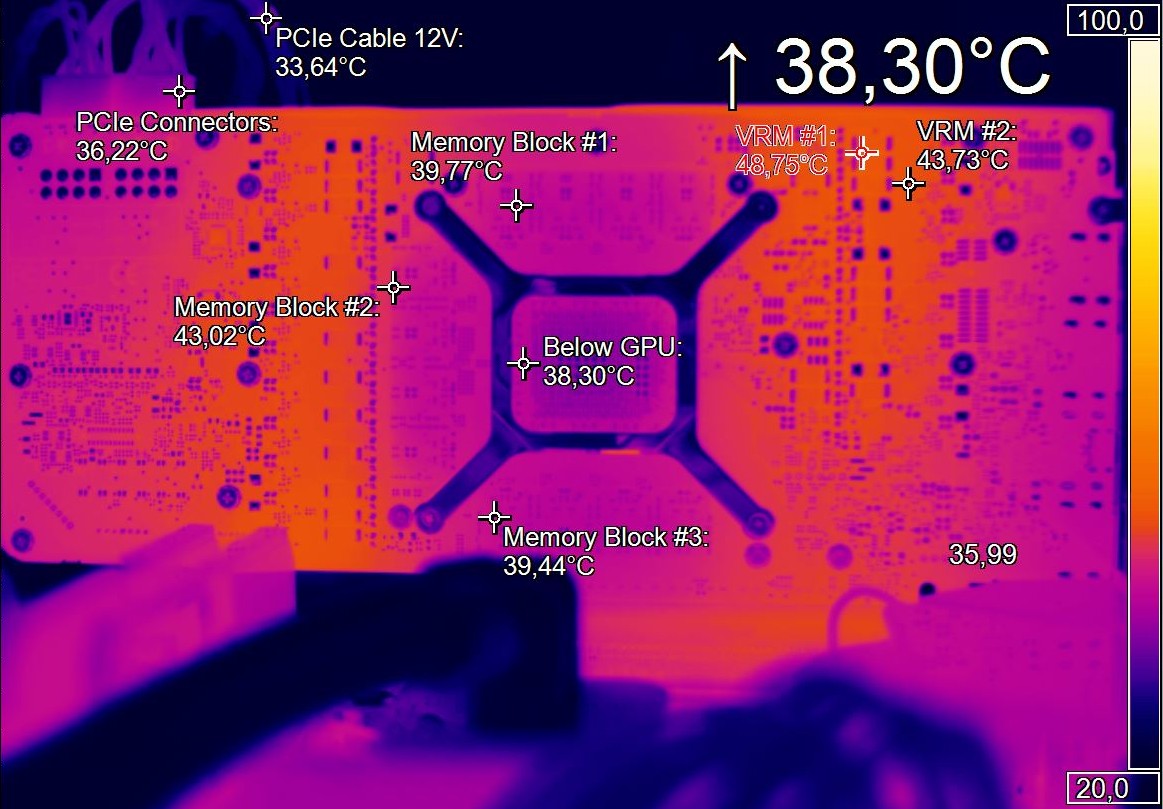
During the cooling process, you can also see very clearly where the waste heat is dissipated most intensively. The voltage transformers are at the very end here.

- 1 - Introduction, technical data and technology
- 2 - Test system with the igor'sLAB PC from MIFCOM
- 3 - Teardown: PCB and Components
- 4 - Teardown: Cooler and disassembly help
- 5 - Summary gaming performance WQHD (2560 x 1440)
- 6 - Summary gaming performance Ultra-HD (3840 x 2160)
- 7 - Single charts for WQHD (2560 x 1440)
- 8 - Single charts for Ultra-HD (3840 x 2160)
- 9 - Workstation graphics and rendering
- 10 - Power consumption in detail and load balancing
- 11 - Transients, limits and PSU recommendation
- 12 - Clock rates, temperatures and infrared
- 13 - Fan speed and Noise
- 14 - Summary and conclusion


892 Antworten
Kommentar
Lade neue Kommentare
Mitglied
1
Urgestein
Urgestein
Mitglied
Mitglied
Neuling
Urgestein
Veteran
Urgestein
Neuling
Urgestein
1
Urgestein
Veteran
Mitglied
Mitglied
Urgestein
Mitglied
Alle Kommentare lesen unter igor´sLAB Community →