


Load peaks and capping
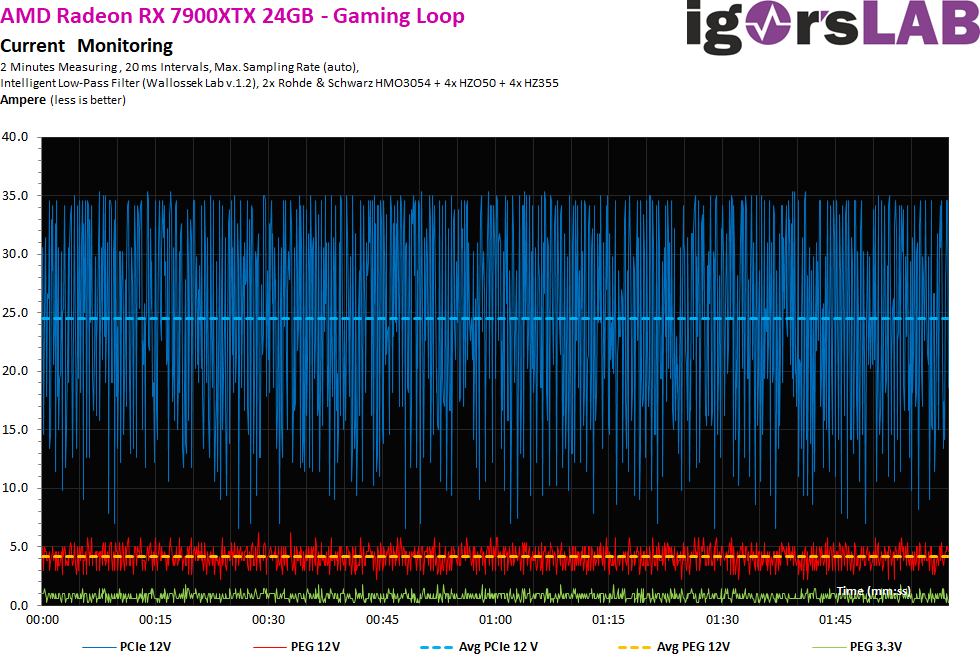
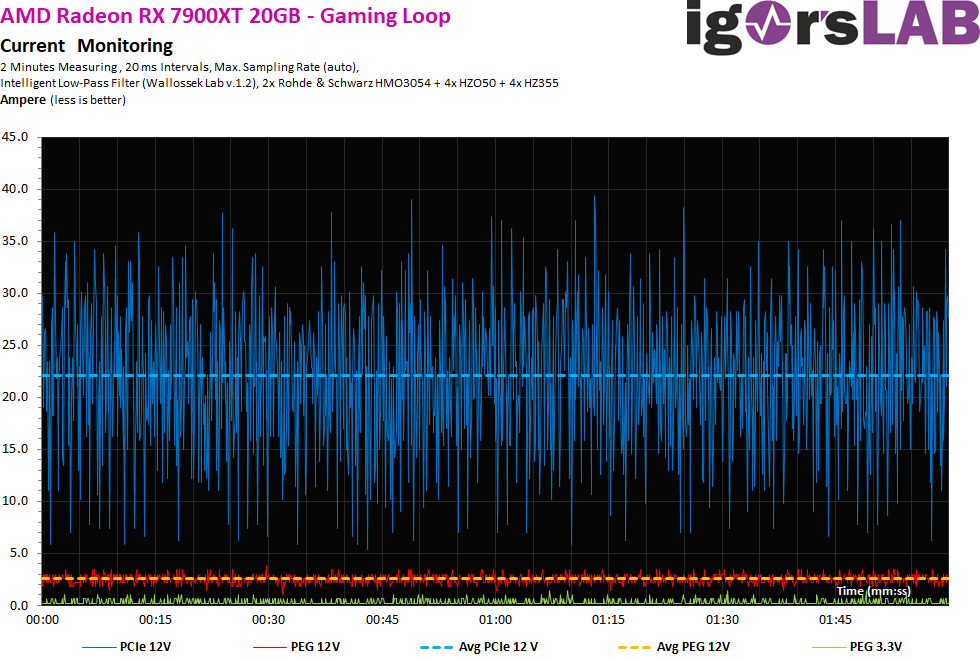
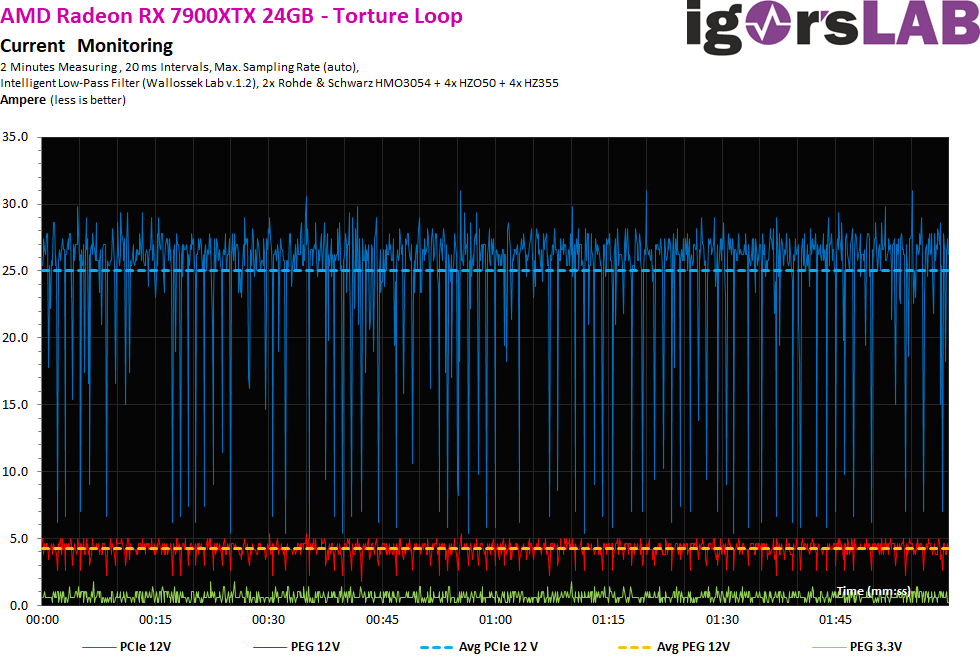
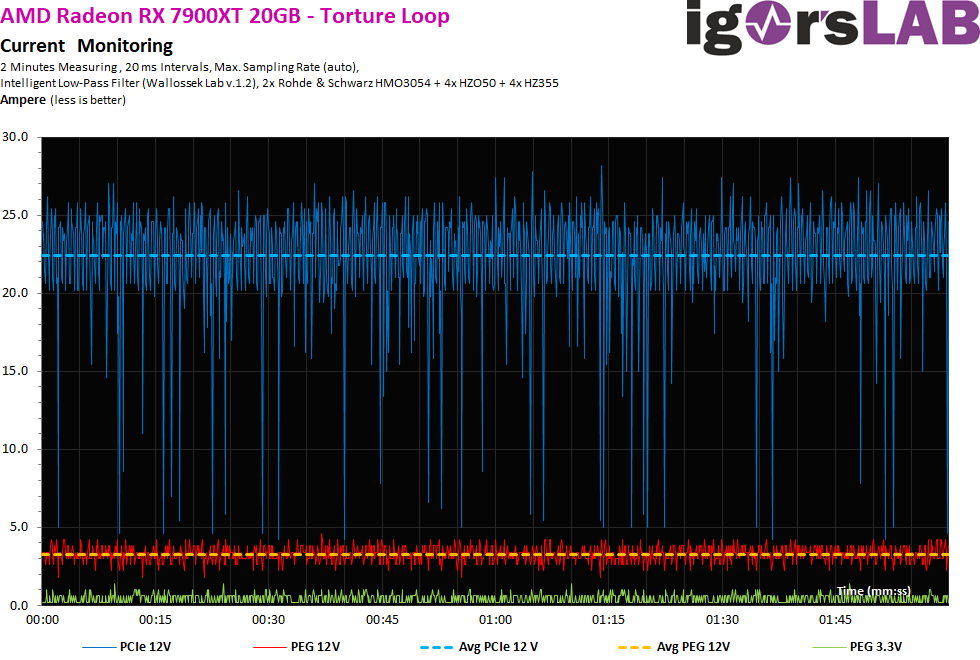
First, let’s look at the flowing streams. Measurements were taken at coarser 20-ms intervals, i.e. around 50 times per second, to simulate the load on the supervisor chip of the power supplies (shutdown). We see that ALL load peaks are capped at 35 A at the latest. The smaller RX 7900XT works less restrictively and even produces higher peaks of up to 39 amps in places!
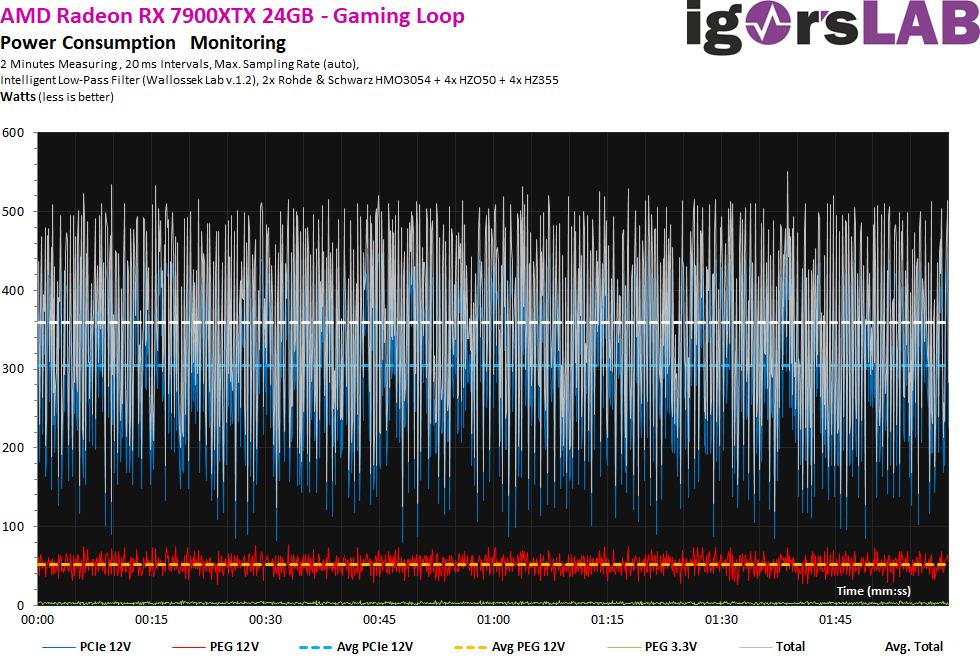
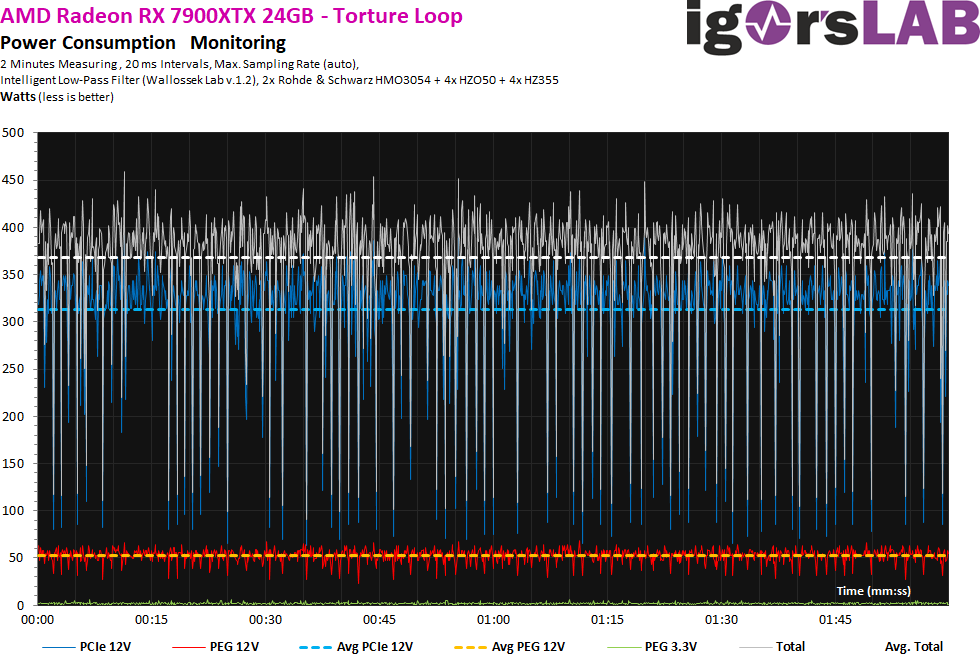
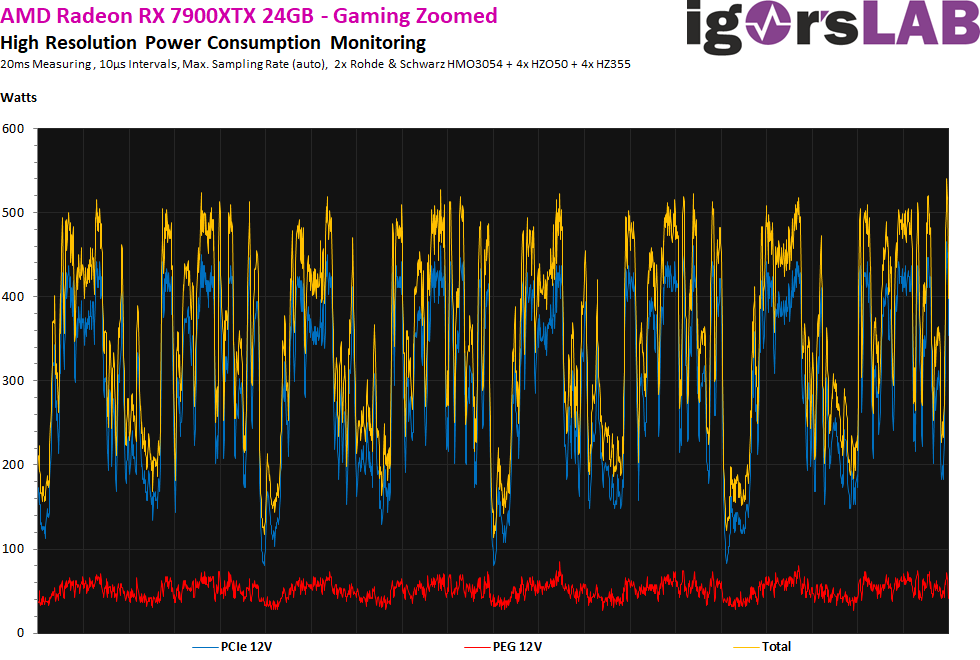
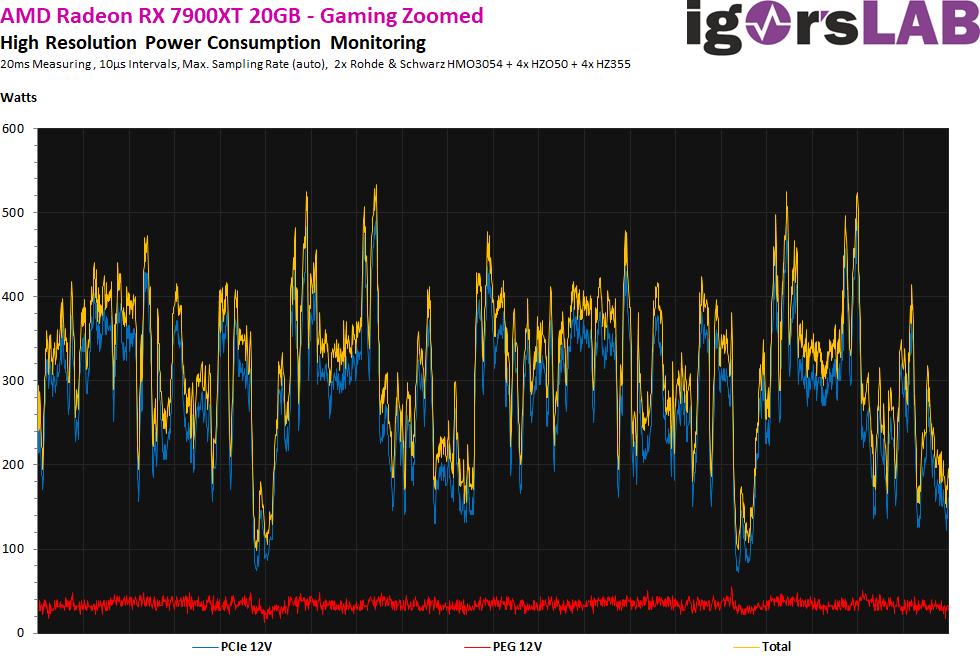
Nevertheless, we still need to take a look at the voltages, or the product of voltage and current flow. I already wrote that I measured here at three different power supply connections, even if all three connections meet again somehow at the end on the board of the graphics card. What we can now see here as much clearer fluctuations and peaks is due to the partial slightly overvolting power supply and thus the voltage and not the currents. This is due to technical reasons, but not a big deal. However, we also see that the few peak at over 500 watts is not due to the current flowing (graphics card), but actually results from the power supply! This is also due to the topology and especially the input filters. I suspect that AMD works with a slightly higher switching frequency of the voltage regulators here than NVIDIA, which could also explain the additional frequency garbage.
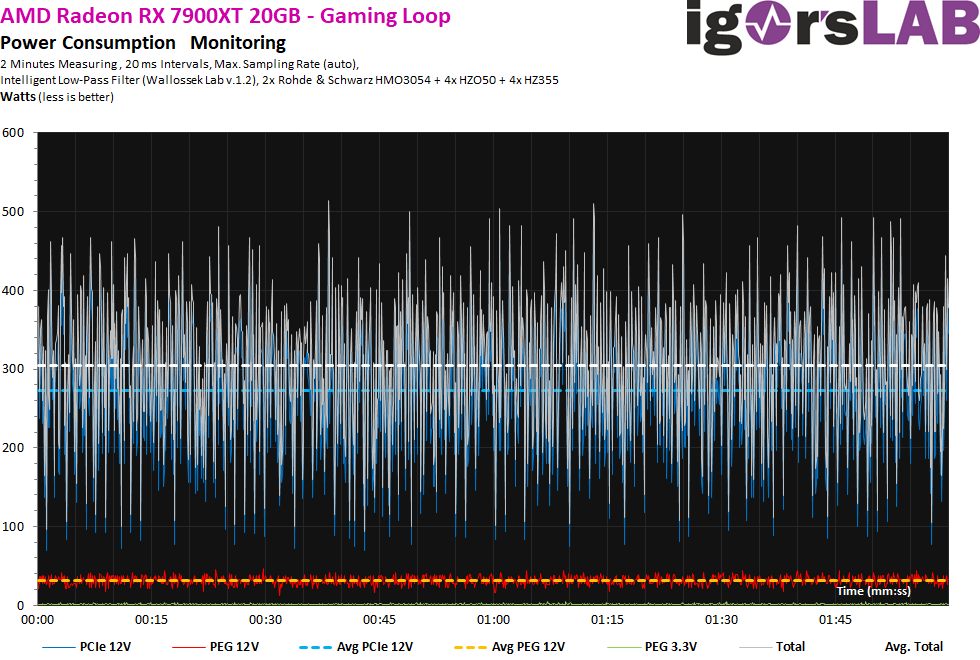
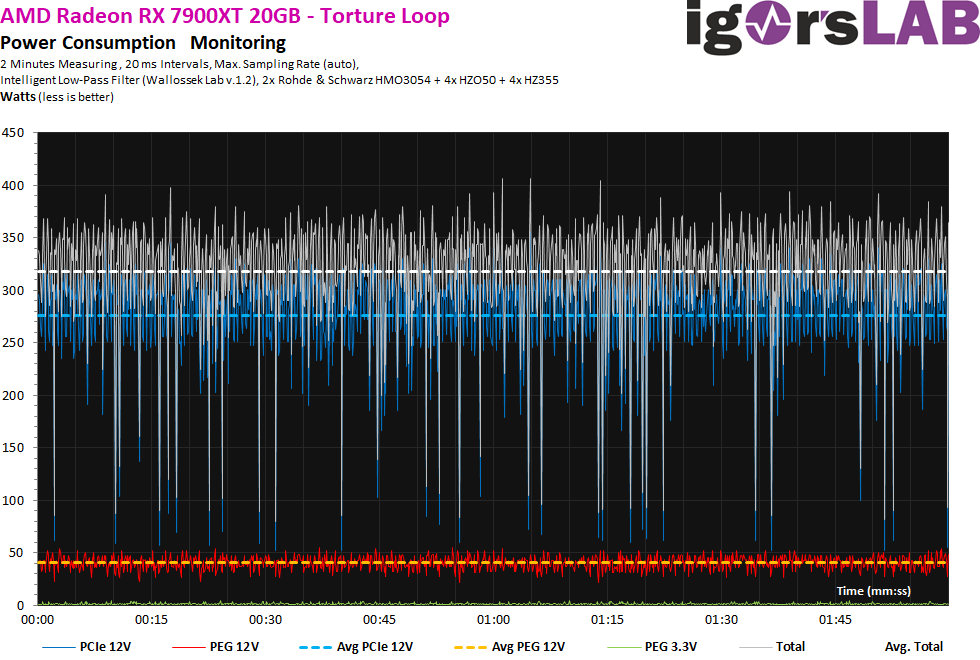
It hardly looks different in the Torture test, even though you can see the RX 7900XT’s lower TBP here. But the individual voltage spikes look rather uncool, by the way, on both cards.
If you now add the voltage again, you will see a stronger ripple, which again results from the somewhat jittery operating voltage. However, in the power supply’s honor, it has to be said that this affects all current products of all manufacturers and is certainly hardly avoidable.

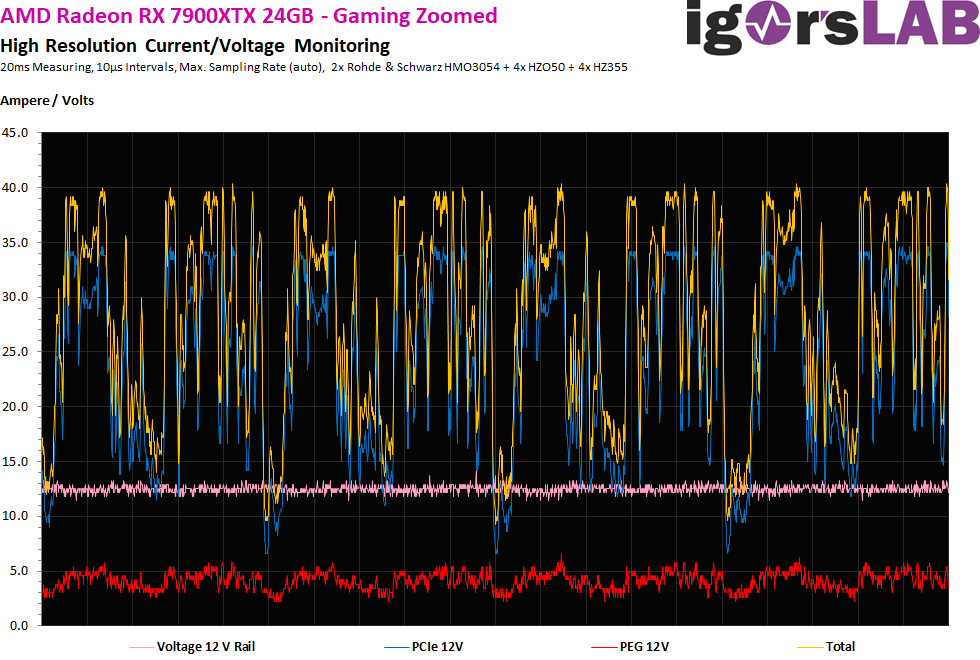
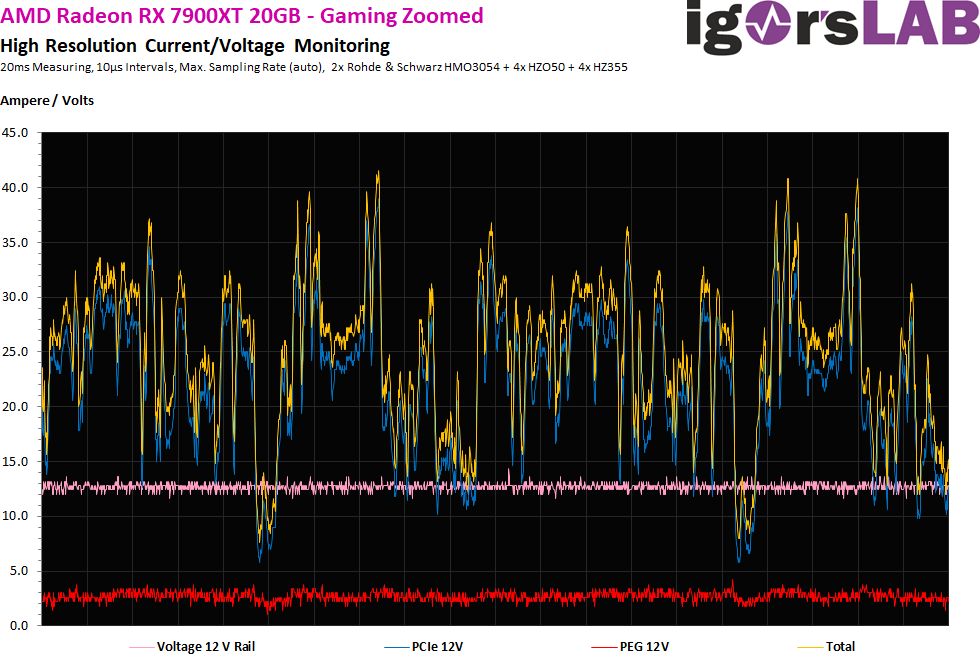
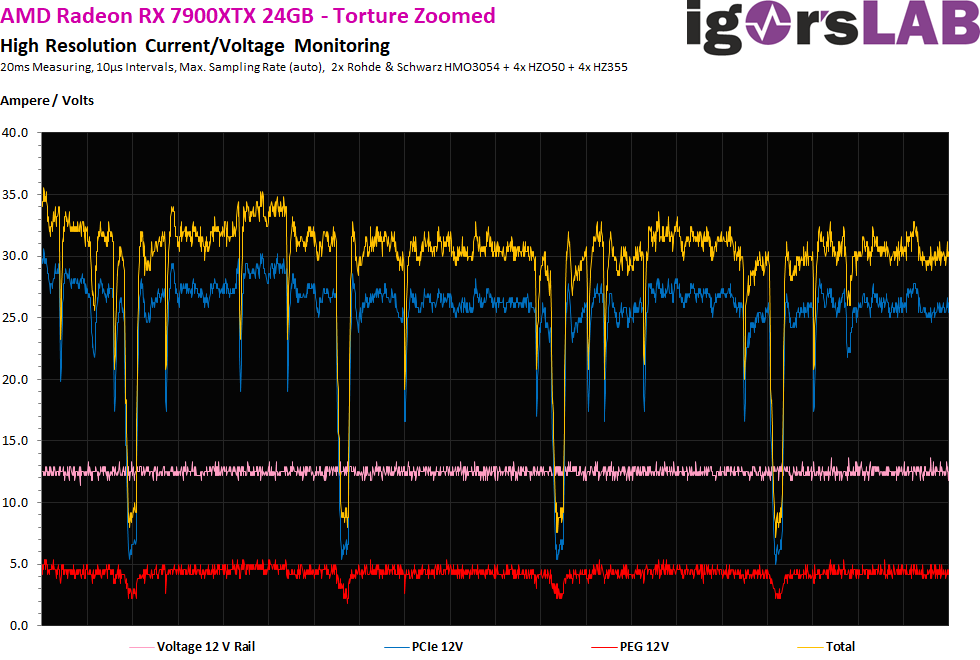
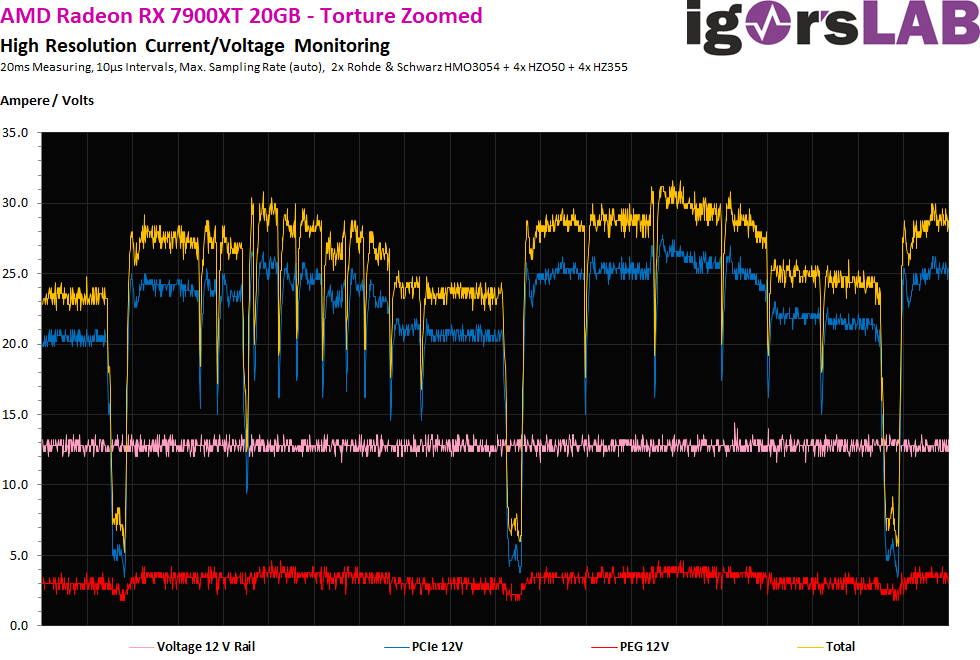
Because I would like to know it however still completely exactly, I resolve the whole once still more highly and take 20 ms as total running time. The intervals of 10 microseconds can just be measured sensibly and we also see the voltage here as a gray curve, whose average value is just over 12 volts, but which nevertheless still alternates somewhat within the permissible range. The two Radeons switch significantly more often than the RTX 4080 and RTX 4090, while you can only see a real cap at around 40 amps in both 7900XTX. The RX 7900XT even goes considerably higher in parts.
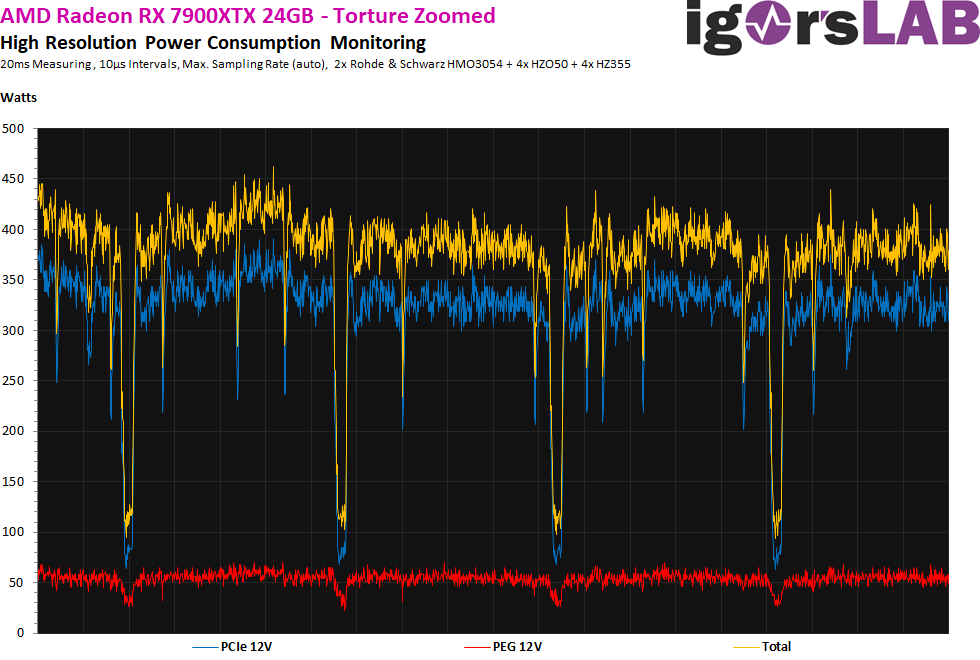
If you then convert that to the power consumption in watts, you get this picture:
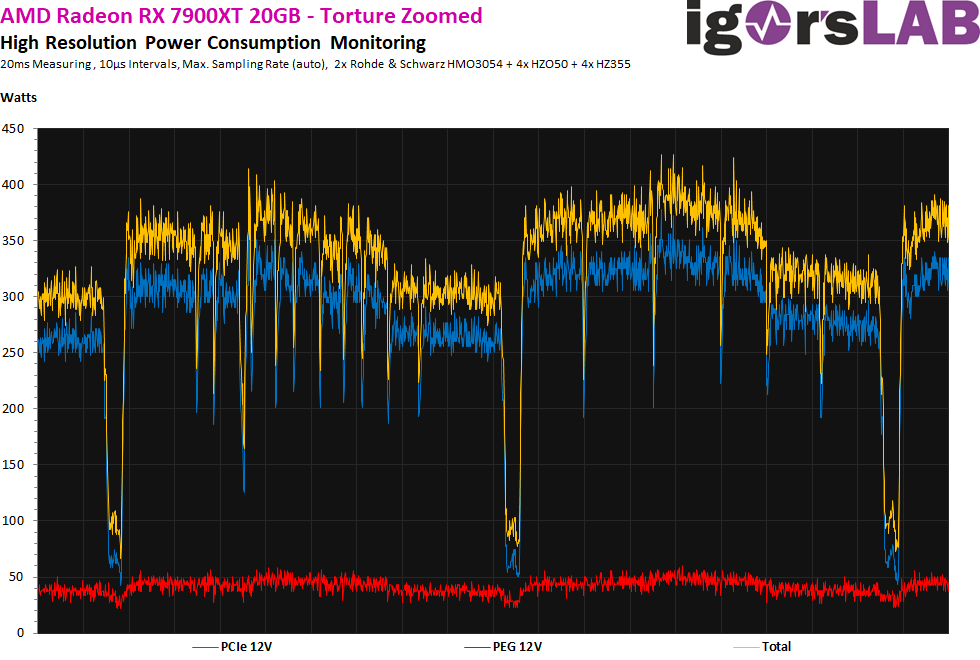
I also did the whole thing again for the Torture loop, where we get to admire the regular drops. First of all, the streams again, but still have plenty of strange, sporadically recurring drops in each rise. This looks like a violent hiccup before the power is really throttled again shortly afterwards.
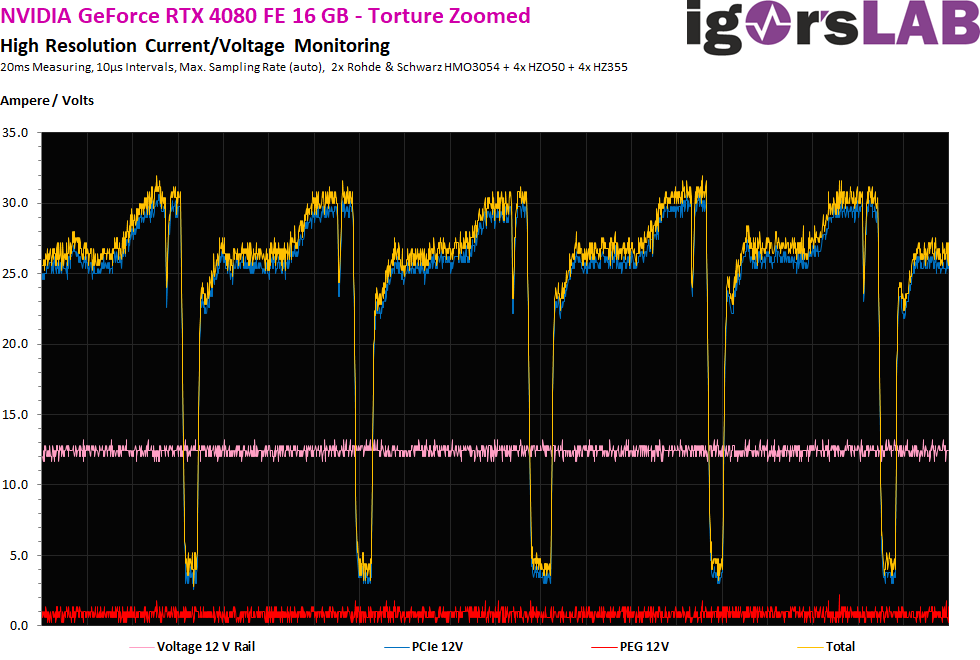
For comparison, here is the GeForce RTX 4080, which has a much better load management:
And then again total wattage:
Power supply recommendation
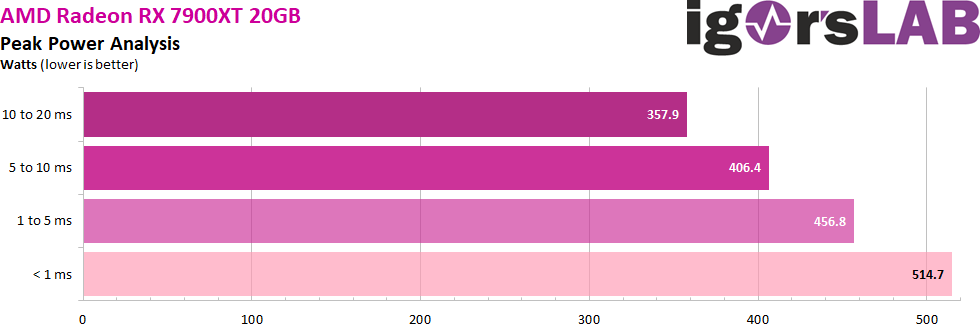
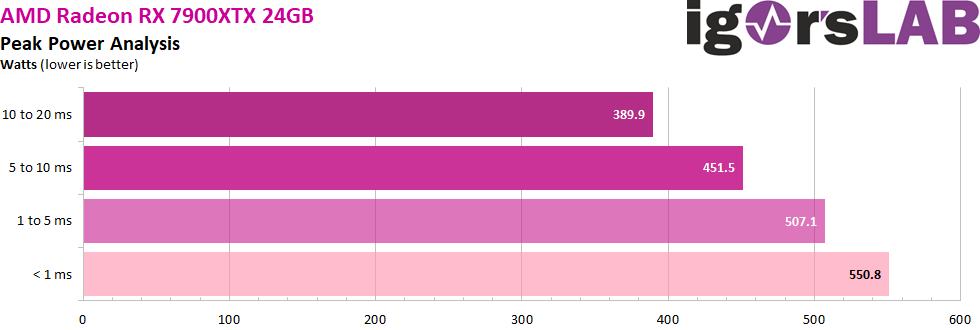
Now we come to the point that completely reduces the expected sensation of exploding power supplies to absurdity. Even IF you hopelessly overpower the card, no one really needs ATX 3.0 power supplies over 1000 watts unless the CPU eats more than 300 watts. This is really just a job creation measure for the struggling power supply industry and only satisfies the sick imagination of some standardization fetishists. You really have to put it so harshly. Thus, you should always stay below 600 to 700 watts even together with the CPU, if you count up to 10 ms. Because it is what the power supplies still “see”
This is also the reason for my power supply recommendation, which for both models is that you should be able to get by with a modern 650-Watt Gold or Platinum power supply. If you want to overclock, you should add another 100 watts, which is especially true for the board partner cards.
| be quiet! |
Straight Power 11 650 Watt Gold |
| Sharkoon |
Silent Storm Cool Zero 650 watts |
| Corsair |
RM 650 Gold 650 Watt |

- 1 - Introduction, technical data and technology
- 2 - Test system with the igor'sLAB PC from MIFCOM
- 3 - Teardown: PCB and Components
- 4 - Teardown: Cooler and disassembly help
- 5 - Summary gaming performance WQHD (2560 x 1440)
- 6 - Summary gaming performance Ultra-HD (3840 x 2160)
- 7 - Single charts for WQHD (2560 x 1440)
- 8 - Single charts for Ultra-HD (3840 x 2160)
- 9 - Workstation graphics and rendering
- 10 - Power consumption in detail and load balancing
- 11 - Transients, limits and PSU recommendation
- 12 - Clock rates, temperatures and infrared
- 13 - Fan speed and Noise
- 14 - Summary and conclusion


892 Antworten
Kommentar
Lade neue Kommentare
Mitglied
1
Urgestein
Urgestein
Mitglied
Mitglied
Neuling
Urgestein
Veteran
Urgestein
Neuling
Urgestein
1
Urgestein
Veteran
Mitglied
Mitglied
Urgestein
Mitglied
Alle Kommentare lesen unter igor´sLAB Community →