


In Ultra-HD, the CPU limitation finally tends towards zero, at least in the three cards we are interested in today. That’s why I consider the tests in the high resolution to be more relevant, at least as far as the differences between the cards are concerned. Because besides the Radeon-GeForce comparison, it is much more interesting to find out whether AMD has finally managed to overcome the old weakness of the RX6000 series in the high resolutions.
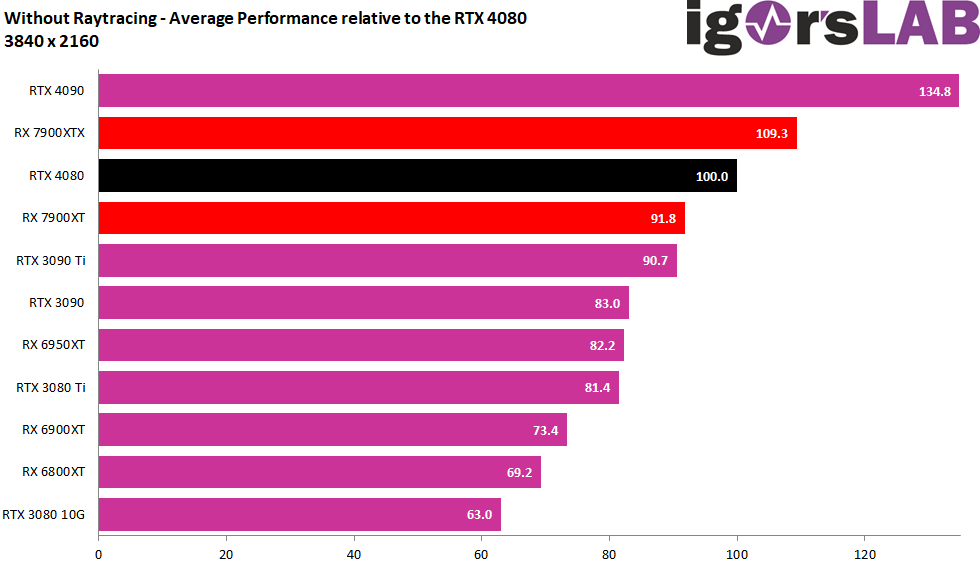
Sum of all games without DXR (RT Off)
The Radeon RX 7900XTX is now 9.3 percentage points ahead of the GeForce RTX 4080 FE, which in turn is 8.2 percentage points ahead of the Radeon RX 7900XT. The gap to the predecessor Radeon RX 6950XT (with factory OC) is 27.1 percentage points and without OC it would certainly be well over 30. However, the GeForce RTX 4090 is now 25.5 percentage points ahead of the RX 7900XTX. The RX 7900XT is still just ahead of the RTX 3090 Ti. Also nice.
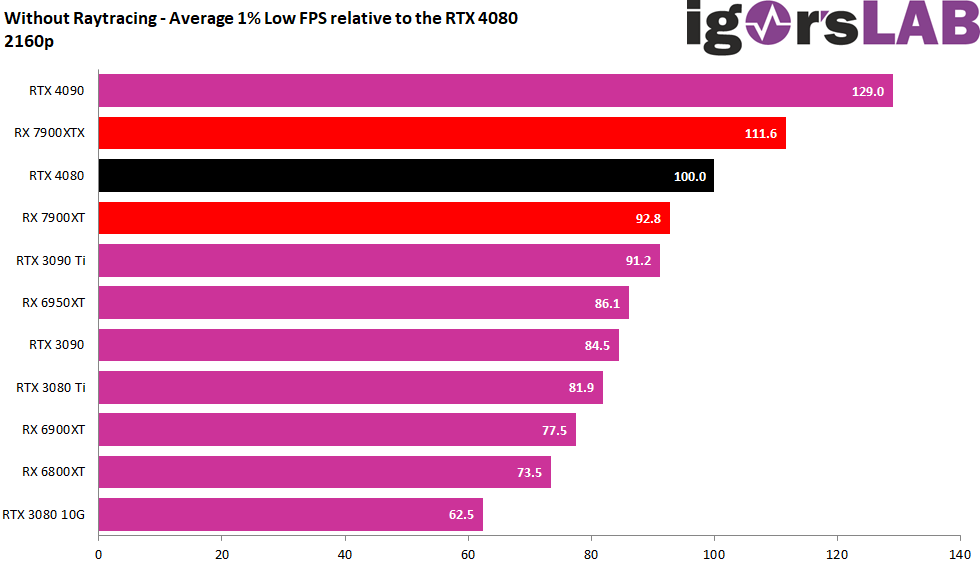
Now let’s look at the Min-FPS, which is the one percent of the slowest rendered frames (P1 Low). Here, the Radeon RX 7900XTX is only 17.4 percentage points behind the GeForce RTX 4090 and the RX 7900XT only 7.2 percentage points behind the RTX 4080.
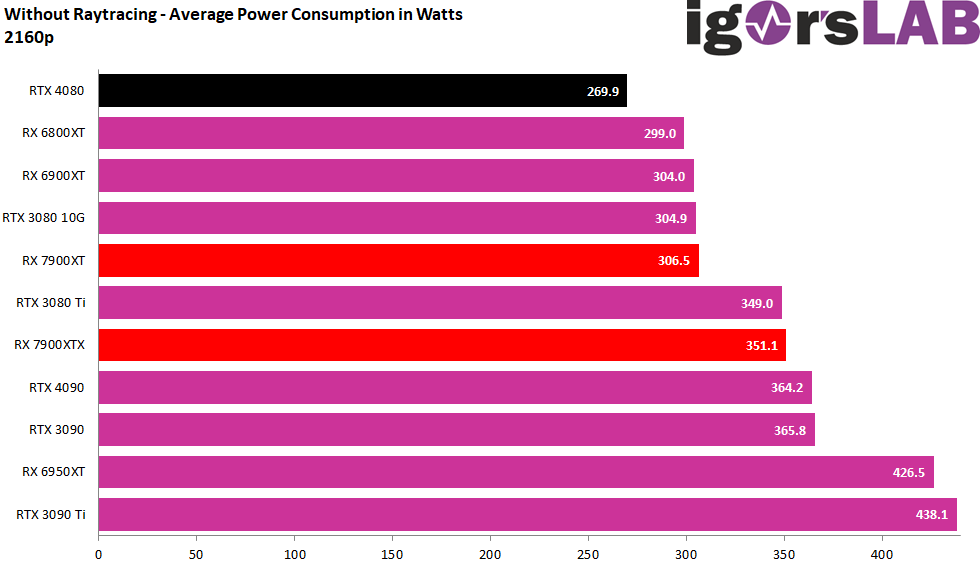
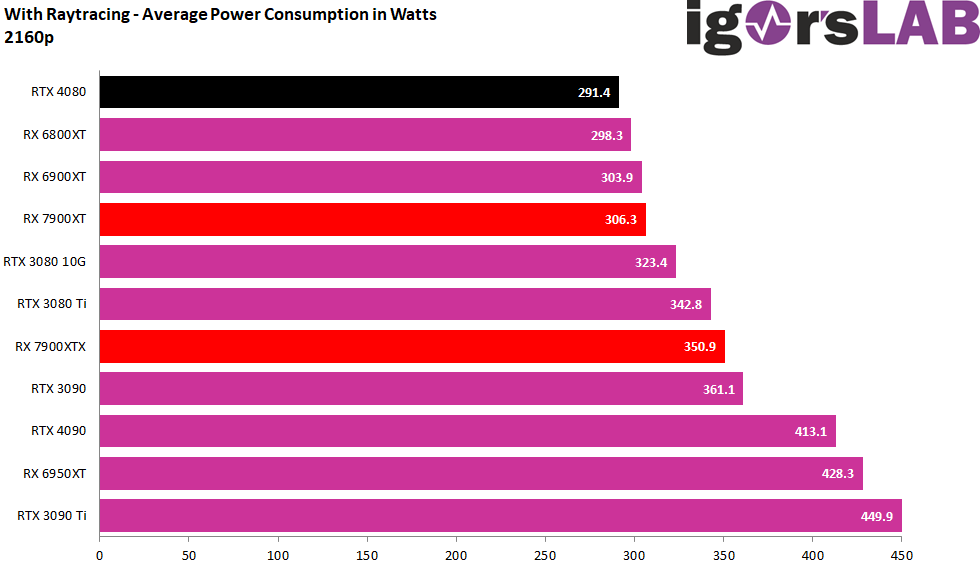
The power consumption of each benchmark was also recorded in Ultra-HD for this game selection and accumulated at the end, so that a very clear picture already emerges here. The GeForce RTX 4080 is once again uncatchably ahead, but it gets a bit thirstier than in WQHD. The RX 7900XT requires 36.6 watts more and is thus once again within the range of what the TBP indicated The RX 7900XT also again almost fully utilizes its power budget. The difference to the RTX 4080 is already 81 watts. There is no need to comment on that.
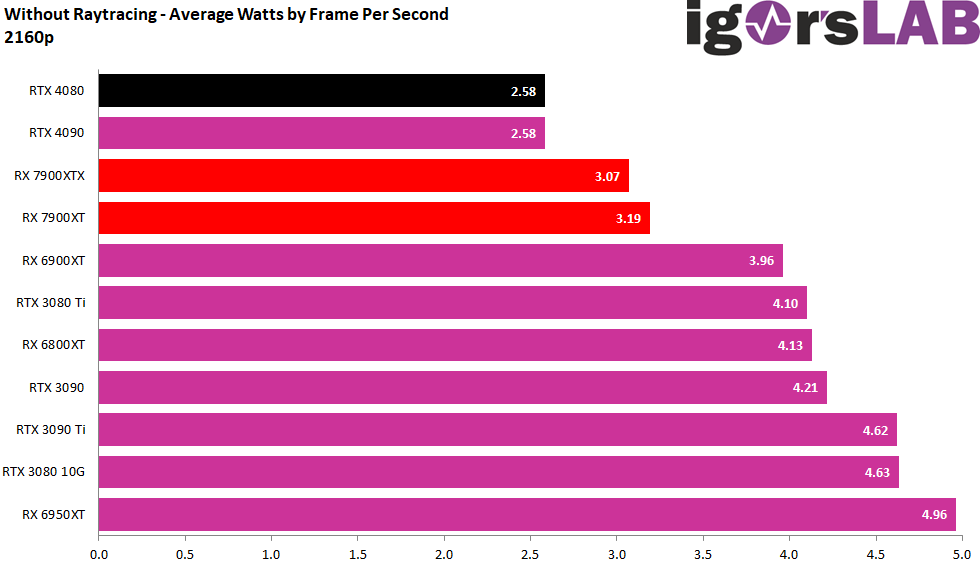
If you now look at the resulting efficiency, you can see the difference almost more clearly. Yes, the old generation is beaten by up to 42 percent (RX 6950XT) and 18 percent (RX 6900XT) in efficiency, but that is not as great as advertised as an average. However, it is interesting that the smaller RX 7900XT is a bit more efficient than the XTX.

Sum of all games with DXR (RT On)
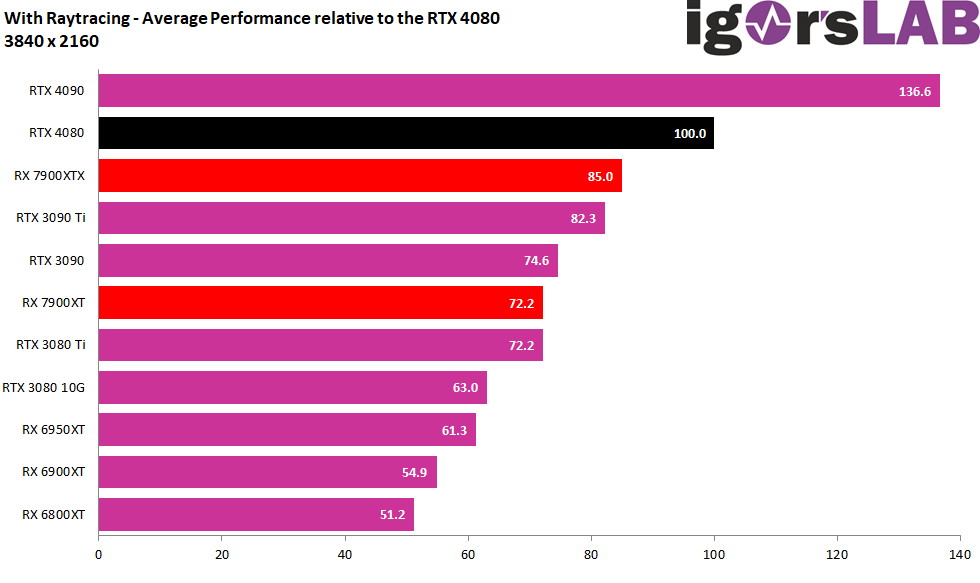
Let’s now turn things around and only evaluate the games where ray tracing is also used. AMD had promised an improvement, and we can definitely report that. The Radeon RX 7900XTX is only 16.2 percentage points behind the GeForce RTX 4080 and beats the former fastest GeForce RTX 3090 Ti by 4.5 percentage points. The RX 7900XT is 27.8 percentage points behind the RTX 4080, but on par with the RTX 3080 Ti. The increase over the RX 6900XT is a whopping 30.1 percentage points, and it’s still 23.7 percentage points over the factory-overclocked RX 6950XT.
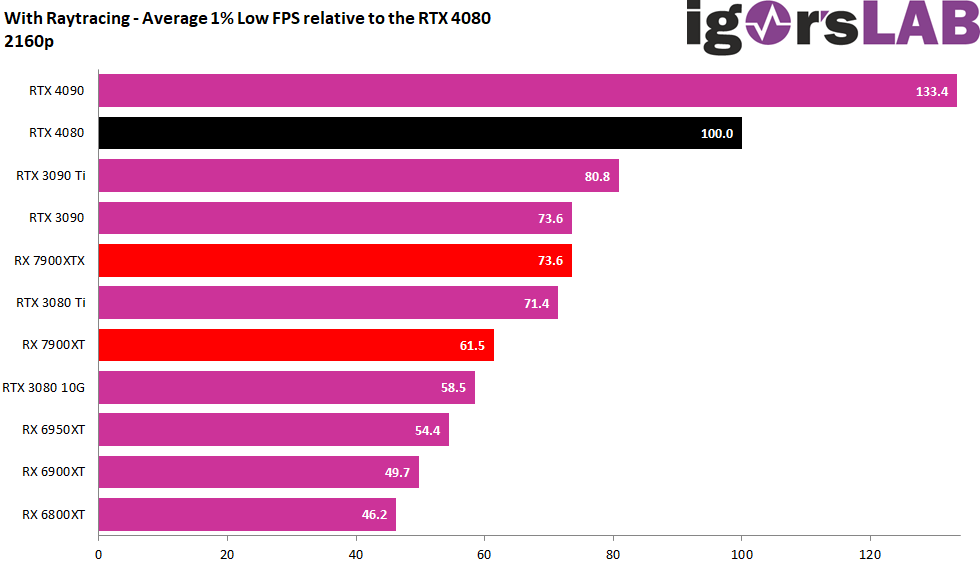
But average FPS are unfortunately not everything. The new cards then drop significantly again in P1 Low compared to the RTX 4080. The 26.4 percentage points of the RX 7900XTX or even 38.5 percentage points of the RX 7900XT are again nothing that could really calm down the scrolling. I would like to refer interested parties to the individual metrics on the following pages.
And what happens now again with the power consumption? It increases to 291.4 watts for the GeForce RTX 4080, while those of the RX 7900XT and RX 7900XTX again remain almost the same. Compared to the RTX 4080, the much slower cards consume 14.9 watts (RX 7900XT) and 59.5 watts more. That is also more than clear, especially since the performance falls further behind.
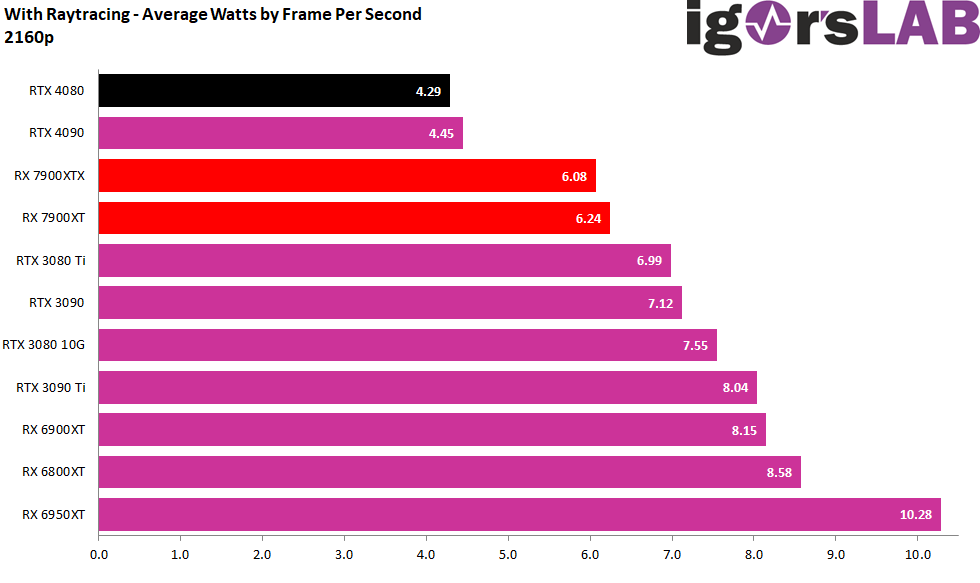
The efficiency is then the result of these differences, even if they can once again set the Radeons apart a bit more clearly compared to the predecessor. Thus, DXR is still anything but a parade discipline for the new Radeon cards even in Ultra HD.

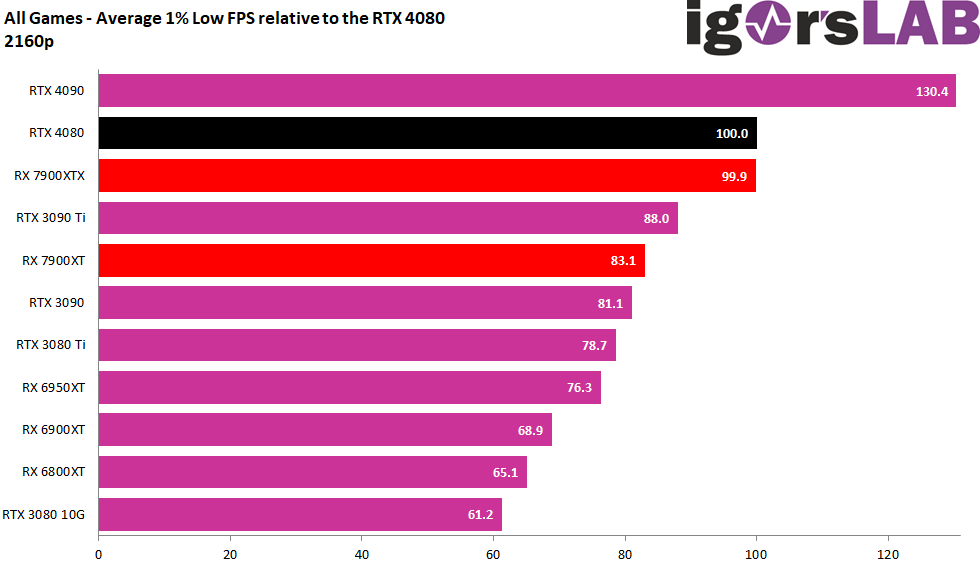
Sum of all games
For the third evaluation I use all games, whether with or without DXR. This is certainly the best representation of everyday life, where the number of games without DXR still clearly outweighs the number of games without DXR, but you don’t want to do without it anymore. The picture is similar to that in WQHD, although Radeons can stand out a tad further, especially due to the better screen performance. The Radeon RX 7900XT is two percentage points ahead of the GeForce RTX 4080, while the RX 7900XT falls 14.1 percentage points behind it and performs slower than the GeForce RTX 3090 Ti.
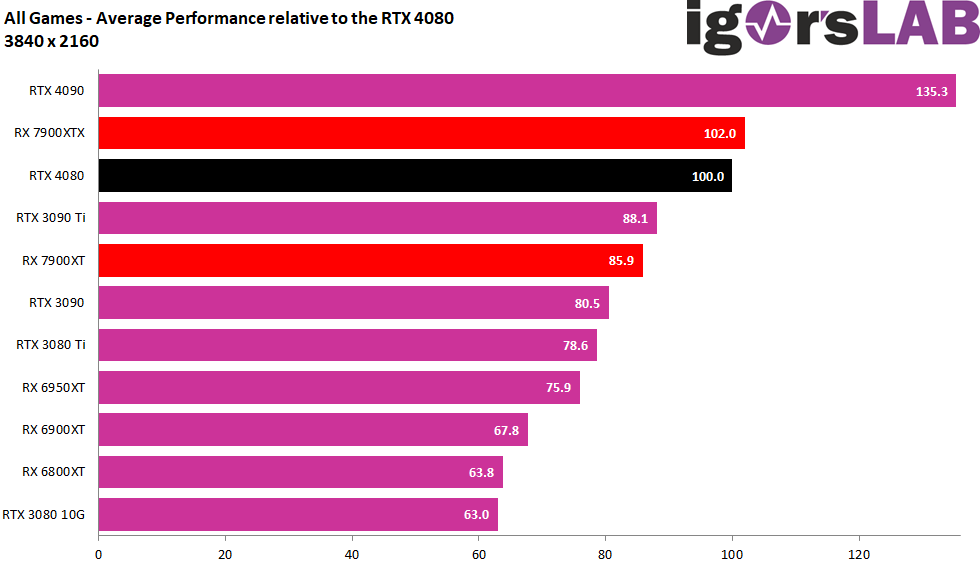
The P1 Low, on the other hand, is a different story. While the RX 7900XTX is on par with the RTX 4080, the RX 7900XT is already 16.9 percentage points behind, which then also falls behind the RTX 3090 Ti more clearly. We already know the reasons for this (DXR).
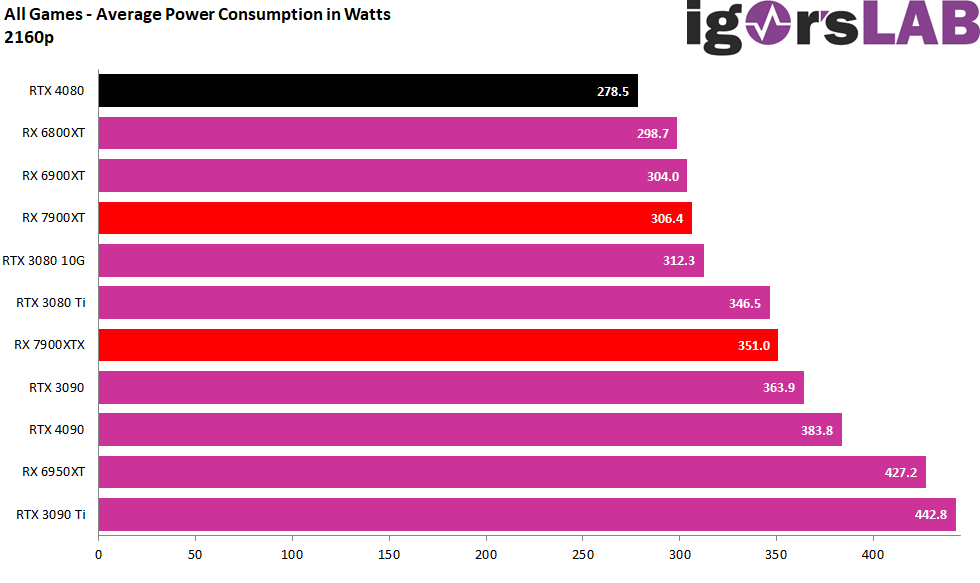
But what about the power consumption in Ultra HD? On average, the Radeon RX 7900XTX lags behind the GeForce RTX 4080 by almost 72.5 watts, which is still 26 percent more! The RX 7900XT looks at least a bit better with 27.5 watts or 10 percent.
That would give us all the summaries and I refer you to the following pages with the metrics.

- 1 - Introduction, technical data and technology
- 2 - Test system with the igor'sLAB PC from MIFCOM
- 3 - Teardown: PCB and Components
- 4 - Teardown: Cooler and disassembly help
- 5 - Summary gaming performance WQHD (2560 x 1440)
- 6 - Summary gaming performance Ultra-HD (3840 x 2160)
- 7 - Single charts for WQHD (2560 x 1440)
- 8 - Single charts for Ultra-HD (3840 x 2160)
- 9 - Workstation graphics and rendering
- 10 - Power consumption in detail and load balancing
- 11 - Transients, limits and PSU recommendation
- 12 - Clock rates, temperatures and infrared
- 13 - Fan speed and Noise
- 14 - Summary and conclusion


892 Antworten
Kommentar
Lade neue Kommentare
Mitglied
1
Urgestein
Urgestein
Mitglied
Mitglied
Neuling
Urgestein
Veteran
Urgestein
Neuling
Urgestein
1
Urgestein
Veteran
Mitglied
Mitglied
Urgestein
Mitglied
Alle Kommentare lesen unter igor´sLAB Community →