


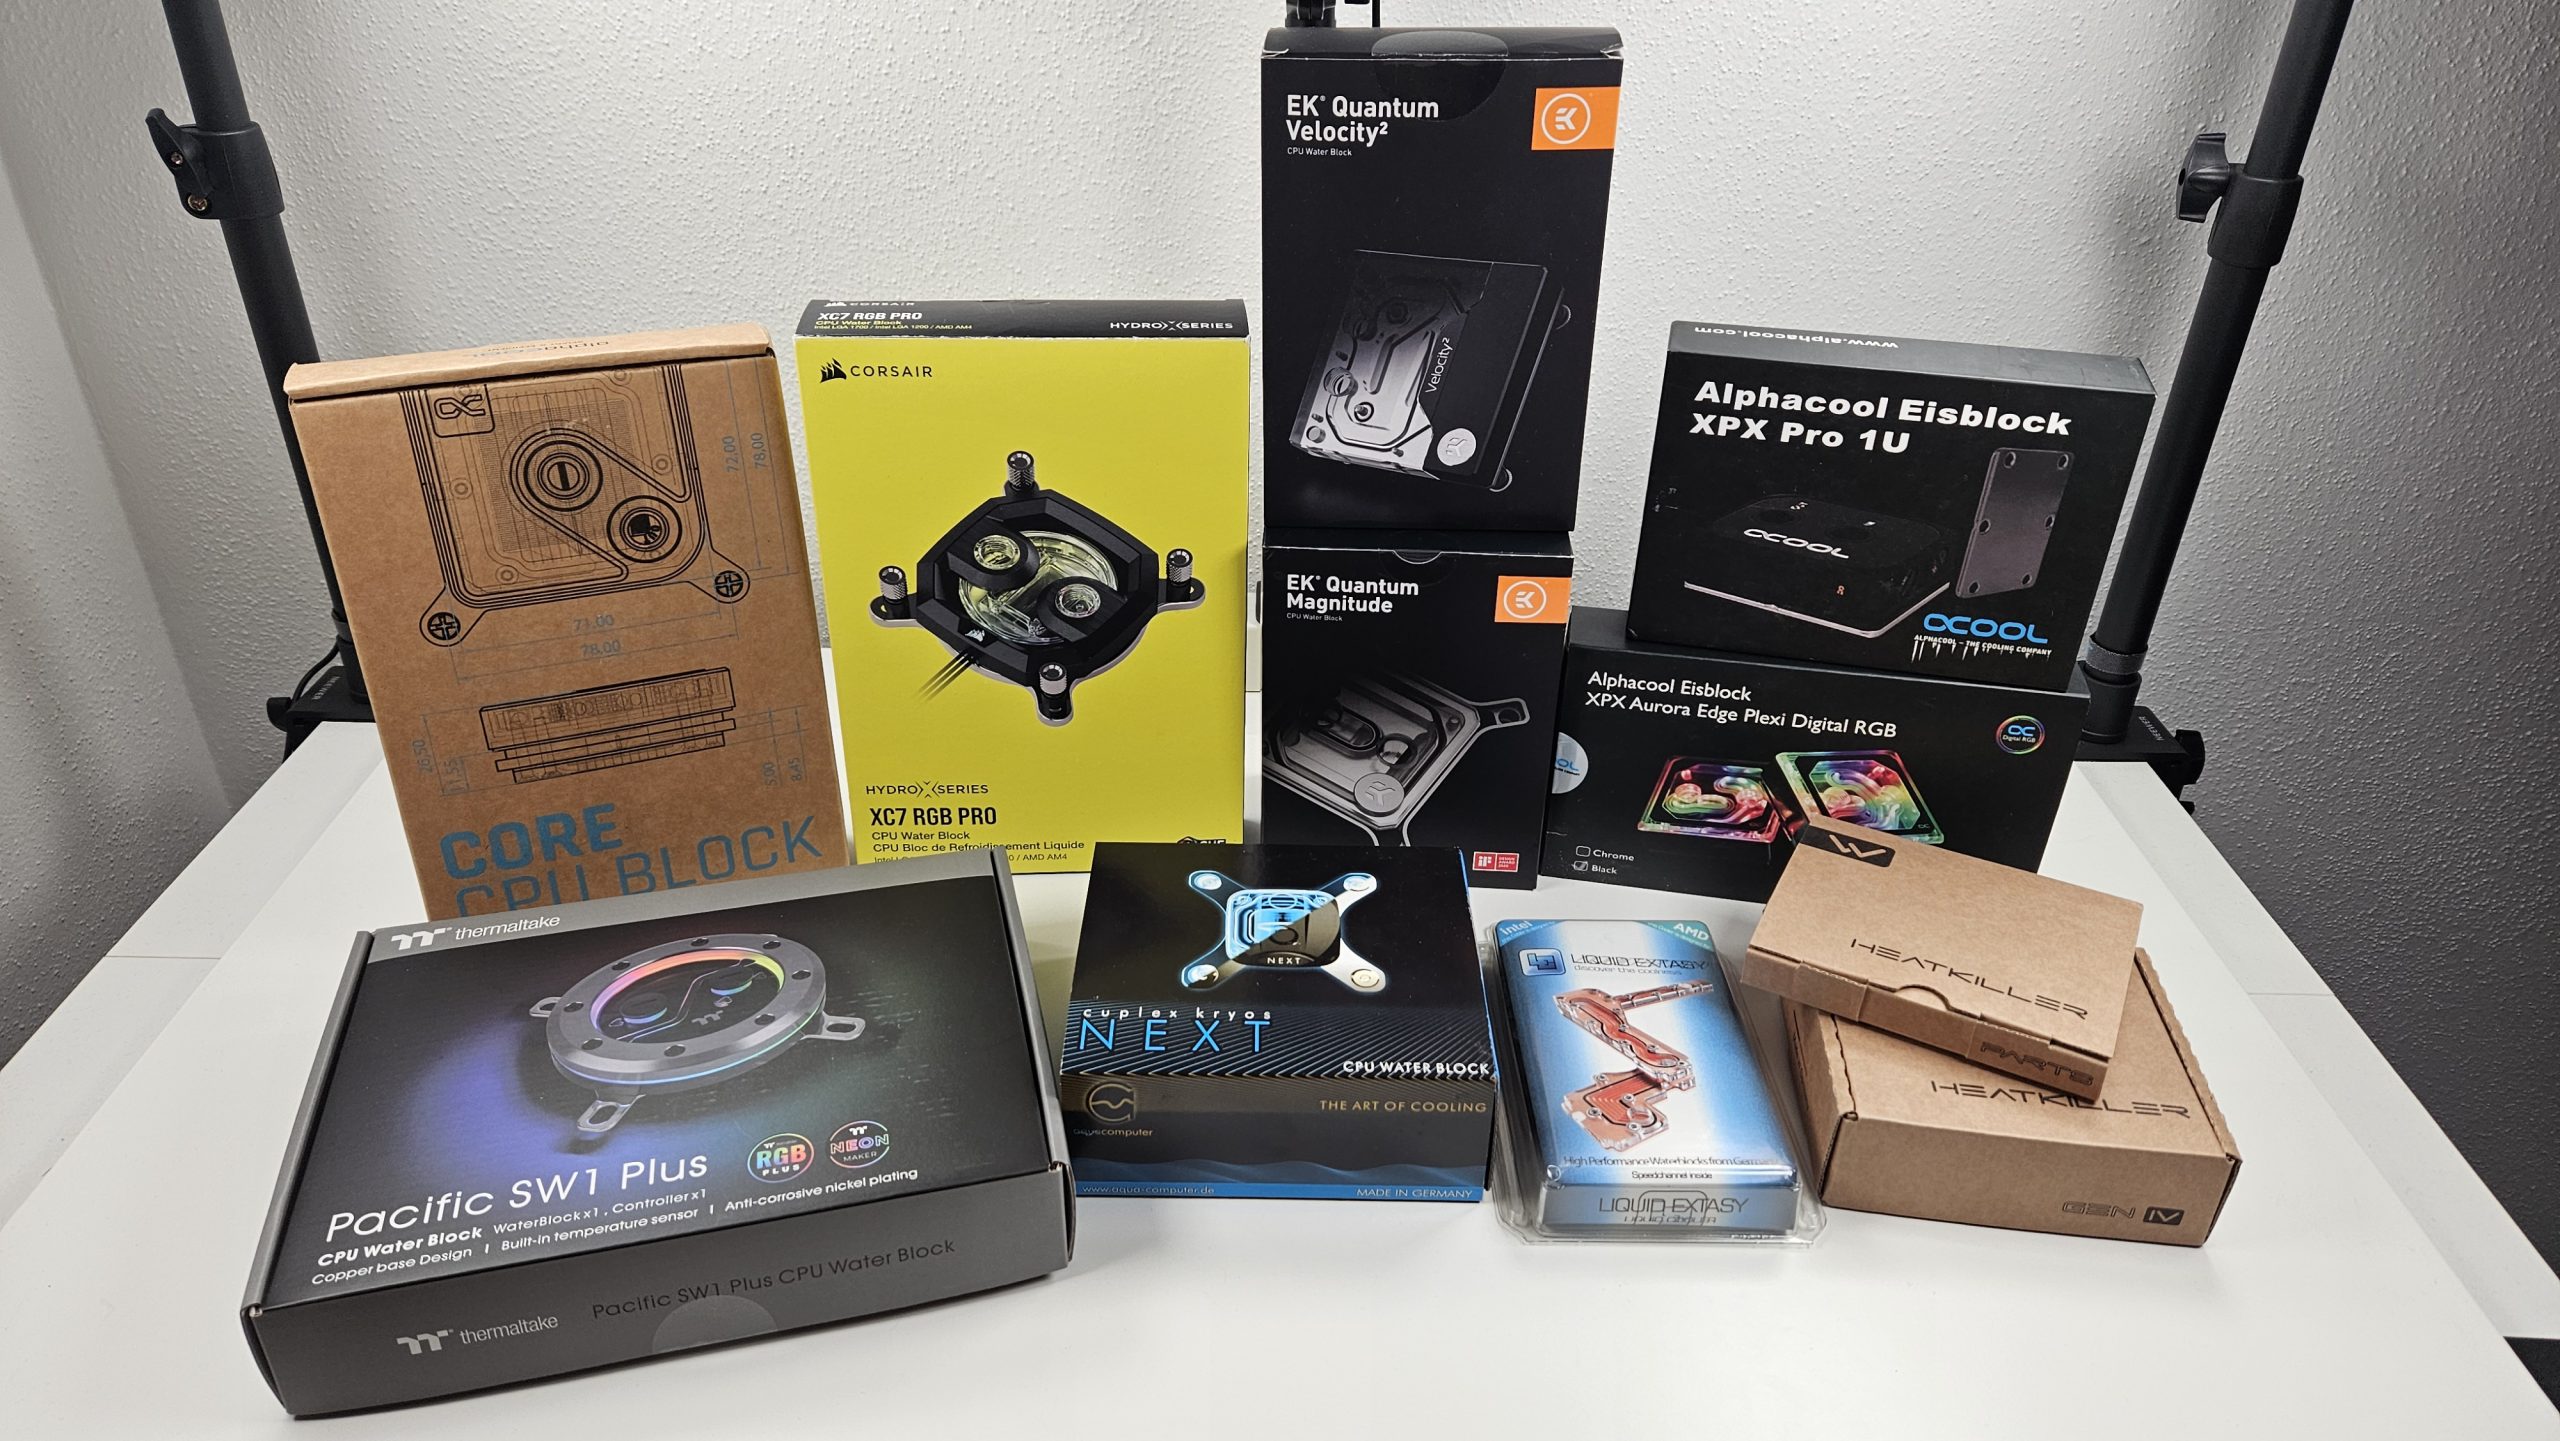
in today’s article, we have tested 10 water blocks, on 2 platforms, with 2 pump settings, each with different mounting variants. Today is not about theoretical values, but about real performance figures that every reader can measure themselves at home with a little effort. The background to all this is, of course, the initial review of the Alphacool Core 1 water block here on our site, which we took offline due to the lack of credible results. The reasons for this should be well known and, if not, you can read about them in various pieces.
Foreword by Igor
My personal thanks go first of all to Xaver, who bravely saw today’s test through to the end against all odds with a great deal of time and personal commitment. In the end, it was also a question of transparency and honor for all of us to properly review the entire shambles, or in this case, to have it reviewed by a third party without bias. Although I did not personally carry out any of the tests, I was also called upon to act as a control mechanism and unfortunately failed in this respect at the time. That is why today’s test is somewhat more extensive.
My own foreword
I was warned more than once by acquaintances or friends to do this test and offer my name as the clean-up guy after the shitstorm and possibly get personally affected. Because even if it is often overlooked, each of us testers has our own name under the articles, Igor often only provides the platform. Anyone who works incorrectly in an article and does not admit their mistakes is potentially unacceptable in the entire industry for all eternity.
However, as one of the first users of the Core 1, I’ve been interested to see how the block really performs against other established water blocks such as Watercool Heatkiller or EK Velocity, but I had not been able to test it in the past. Now I can do so and if you can’t trust the tests of others, then the only thing to do in case of doubt is to measure it yourself! With my current setup, I believe I have achieved a level of reproducibility and fairness that justifies publishing the results. It’s not perfect, of course, and there’s always a certain risk remaining, but I’m prepared to take it – partly out of personal curiosity, partly out of loyalty to Igor and, last but not least, because all manufacturers deserve a fair re-test.
Test methodology
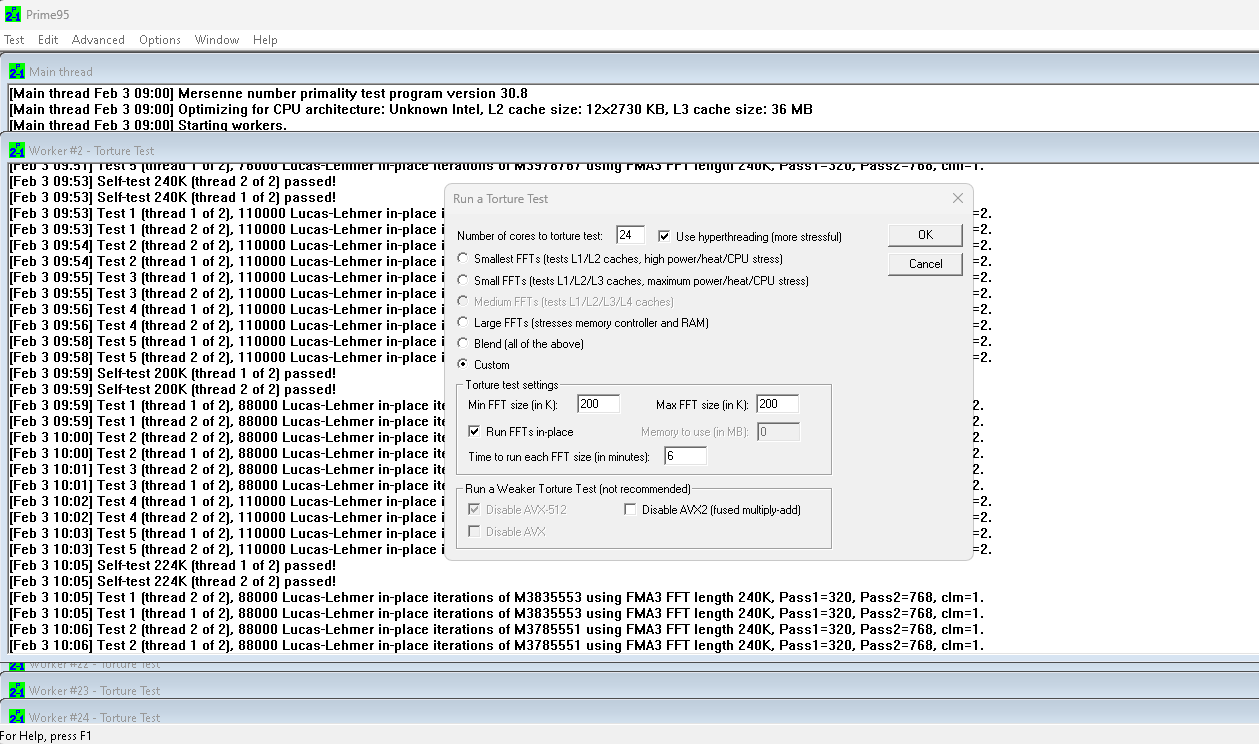
The heat generator is an Intel Core i9-13900KF on the LGA1700 platform and a Ryzen 9 7950X on AM5. The CPUs are each statically overclocked, including e-cores in the case of Intel, in order to generate a heat load that is as high and constant as possible. The exact settings follow on the next page in the test hardware section. Prime 95 (p95v308b17.win64) is used as the heat load with a fixed FFT size of 200K, in-place. This allows us to generate as much constant waste heat as possible and is also independent of the RAM, as the benchmark runs completely in the CPU cache.
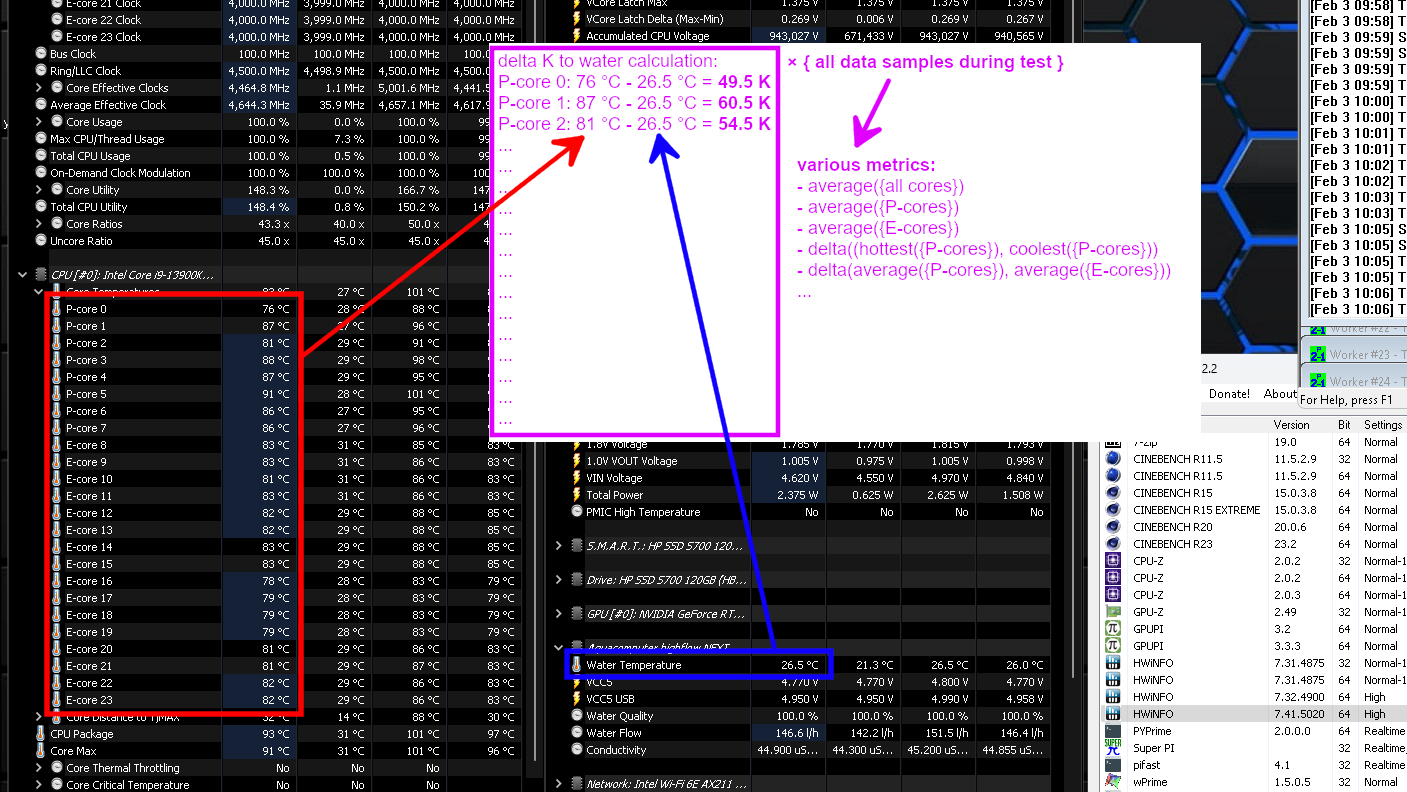
To determine the temperatures, the individual core temperatures and the water temperature are recorded over the benchmark run of 15 minutes and the effective delta to the water temperature is calculated for each core for each data sample. This allows us to measure the water blocks pretty fairly even without a chiller and completely constant water temperature. It is important to understand that we really form the delta for each core, for each data set, and only at the end are metrics generated from the data sets, such as the average of all P-cores or the difference between the on average hottest and coldest P-core. The delta values are given in Kelvin, although these can of course be transferred 1:1 to degrees Celsius.
Still this setup is not quite perfect. Because 1. the higher the temperature of a CPU, the higher its waste heat and 2. the higher the temperature of the water, the higher its thermal conductivity. Even if these factors balance each other out to some extent, I make sure that the room temperature does not leave the 22 – 24 °C range when testing. I don’t even want to mention humidity or dust buildup. In the end, a test setup is never 100% perfect, but you should at least be aware of the limitations and potential external influences.
The data recording is done with HWInfo (7.41.5020) and here I have to confess a potential uncontrolled variable. Because even with priority “High” or “Realtime”, it was not possible for HWInfo to write a completely constant and reliable number of CSV log entries in a defined period of time. This is probably because the CPU is under so much load from Prime95 that HWInfo sometimes has to wait for a free CPU cycle. And even if you configure the polling interval to e.g. 500 ms, a log entry is only generated in the CSV file approx. every 2000 ms.
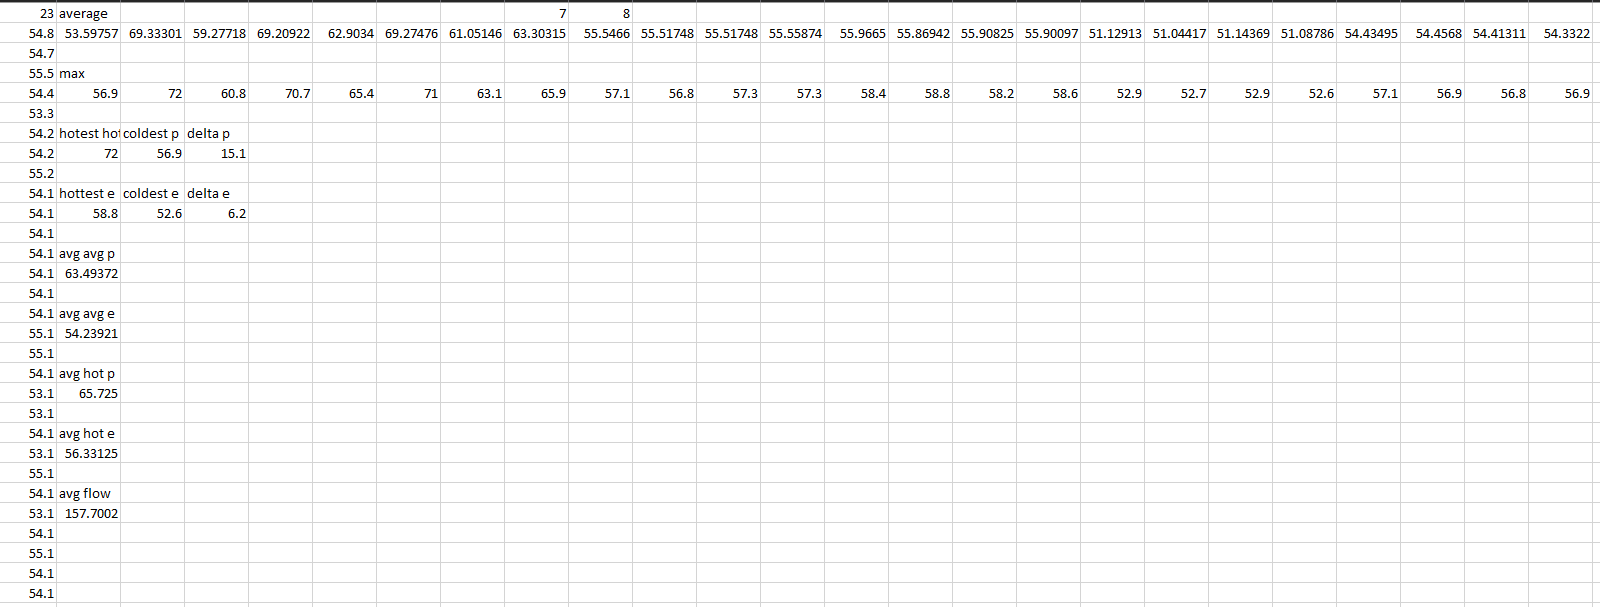
So I decided to always evaluate a fixed number of log entries or data records per run. 419 samples correspond to exactly 15 minutes in the best case and approx. 13 minutes and 30 seconds in the worst case. In any case, Prime95 manages 2 FFT cycles and averaging with a fixed number of data sets seemed the fairest and most constant to me. Differences in the “warm-up time” of the loop are effectively negligible, as we only use the delta temperature anyway.
The test procedure is as follows: A block is mounted according to the manufacturer’s specifications and with the orientation of the block “upright” or oriented as shown in the instructions (e.g. no rotation by 90 or 180 degrees) and then 30 minutes of load is generated with Prime95 for the “burn-in”. During this time, air bubbles can work their way out of the block and the thermal paste can liquefy, spread and settle. The system is then rebooted and the first benchmark run is started by starting Prime95 again with the above parameters and HWinfo records the data in a CSV file in parallel, for at least 15 minutes. The first measurement always takes place with 2 pumps connected. Then the system is rebooted and the measurement is repeated with 1 pump. In this way, we can also determine the influence of the flow rate on the performance of the water block.
The block is then removed, the block and CPU are cleaned and the block is mounted for a second set of measurements. The procedure from the last paragraph is repeated so that we end up with 2 measurements for each of 2 pump configurations. At the same time, I can filter out one-off errors in the mounting of the block from the results, such as uneven tightening of the screws, because only the better of the two runs per pump configuration makes it into the diagrams later. In other words, I would have to be stupid twice in a row for a block to perform worse than it could.
Assembly is always carried out according to the individual manufacturer’s instructions if specified and, if necessary, even with a torque screw driver. Inlet and outlet are of course connected as specified by the manufacturer. If a measurement appears implausible, e.g. because too few data records were logged or because the results of the two mounts are very different, a third mount is also tested, again with two pump configurations.
The flow rate is also logged so that we can also measure how restrictive a block is for the water circuit. A constant flow rate via variable pump settings may seem fairer at first, but in practice a very restrictive block with a resulting low flow rate also performs very well, and vice versa. With static pump speed, however, the influence on the flow rate in the entire loop can also be derived.
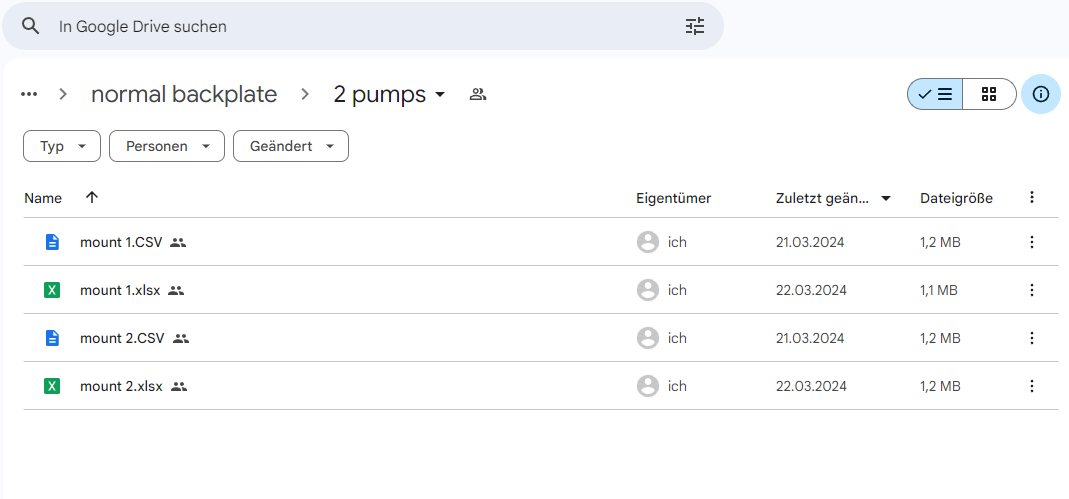
By the way, we provide you with the CSV data of the individual test runs for reasons of transparency, so that there is really no doubt as to whether it is real test data or fantasy values: https://drive.google.com/drive/folders/1K_K2ujN6f5csCPO5mlN4BUbVZeXpLmnn?usp=sharing
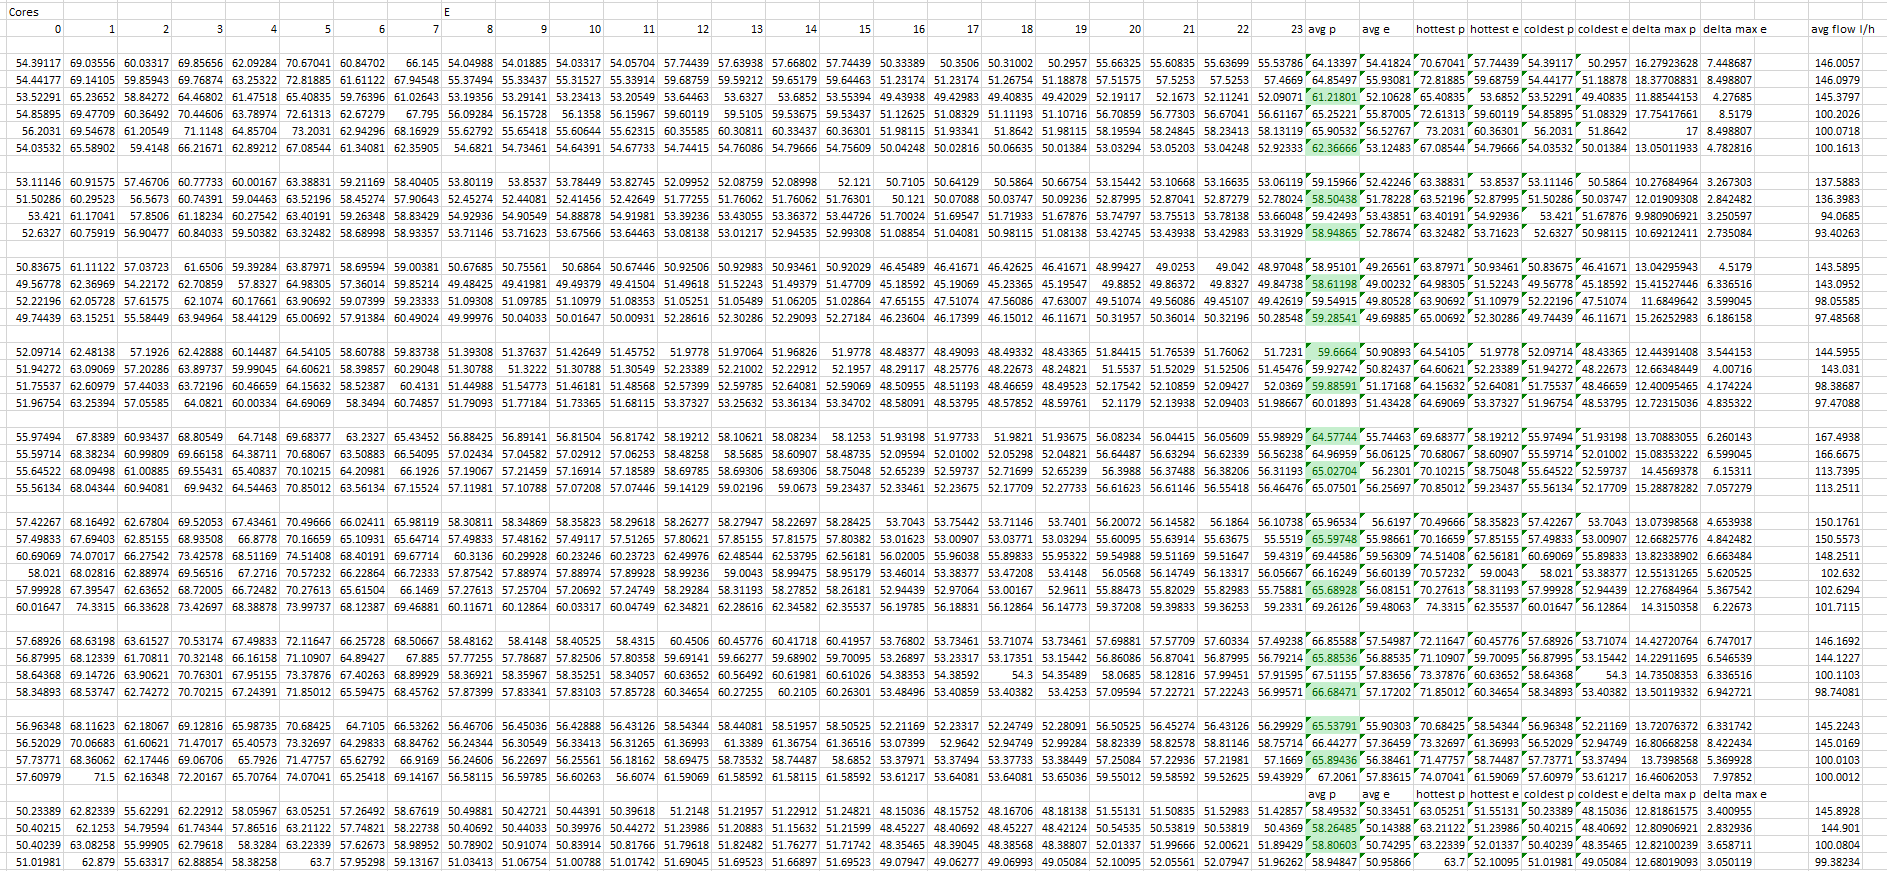
Since Intel only measures or logs the core temperatures in whole degrees, results to a tenth or hundredth of a Kelvin can only be reproduced to a limited extent. Although the water temperature is recorded accurately to a tenth of a degree Celsius and in the end we also form an average from the 419 individual data points, a certain measurement tolerance remains. According to my analyses, this amounts to 0.4 to 0.6 K. Incidentally, AM5 CPUs do log to within a tenth of a degree Celsius, so their results will be a bit more accurate.
Finally, I decided to use the average of the average temperature values for each core, not the average of the maximum values for each core. We do not explicitly record the “0.1 % metric”, as we know it from frametime analyses, but it is very unlikely that a single core will run significantly hotter for fewer data points than for the rest of the test run with this type of cooling.

- 1 - Introduction and test methodology
- 2 - Test hardware and systems
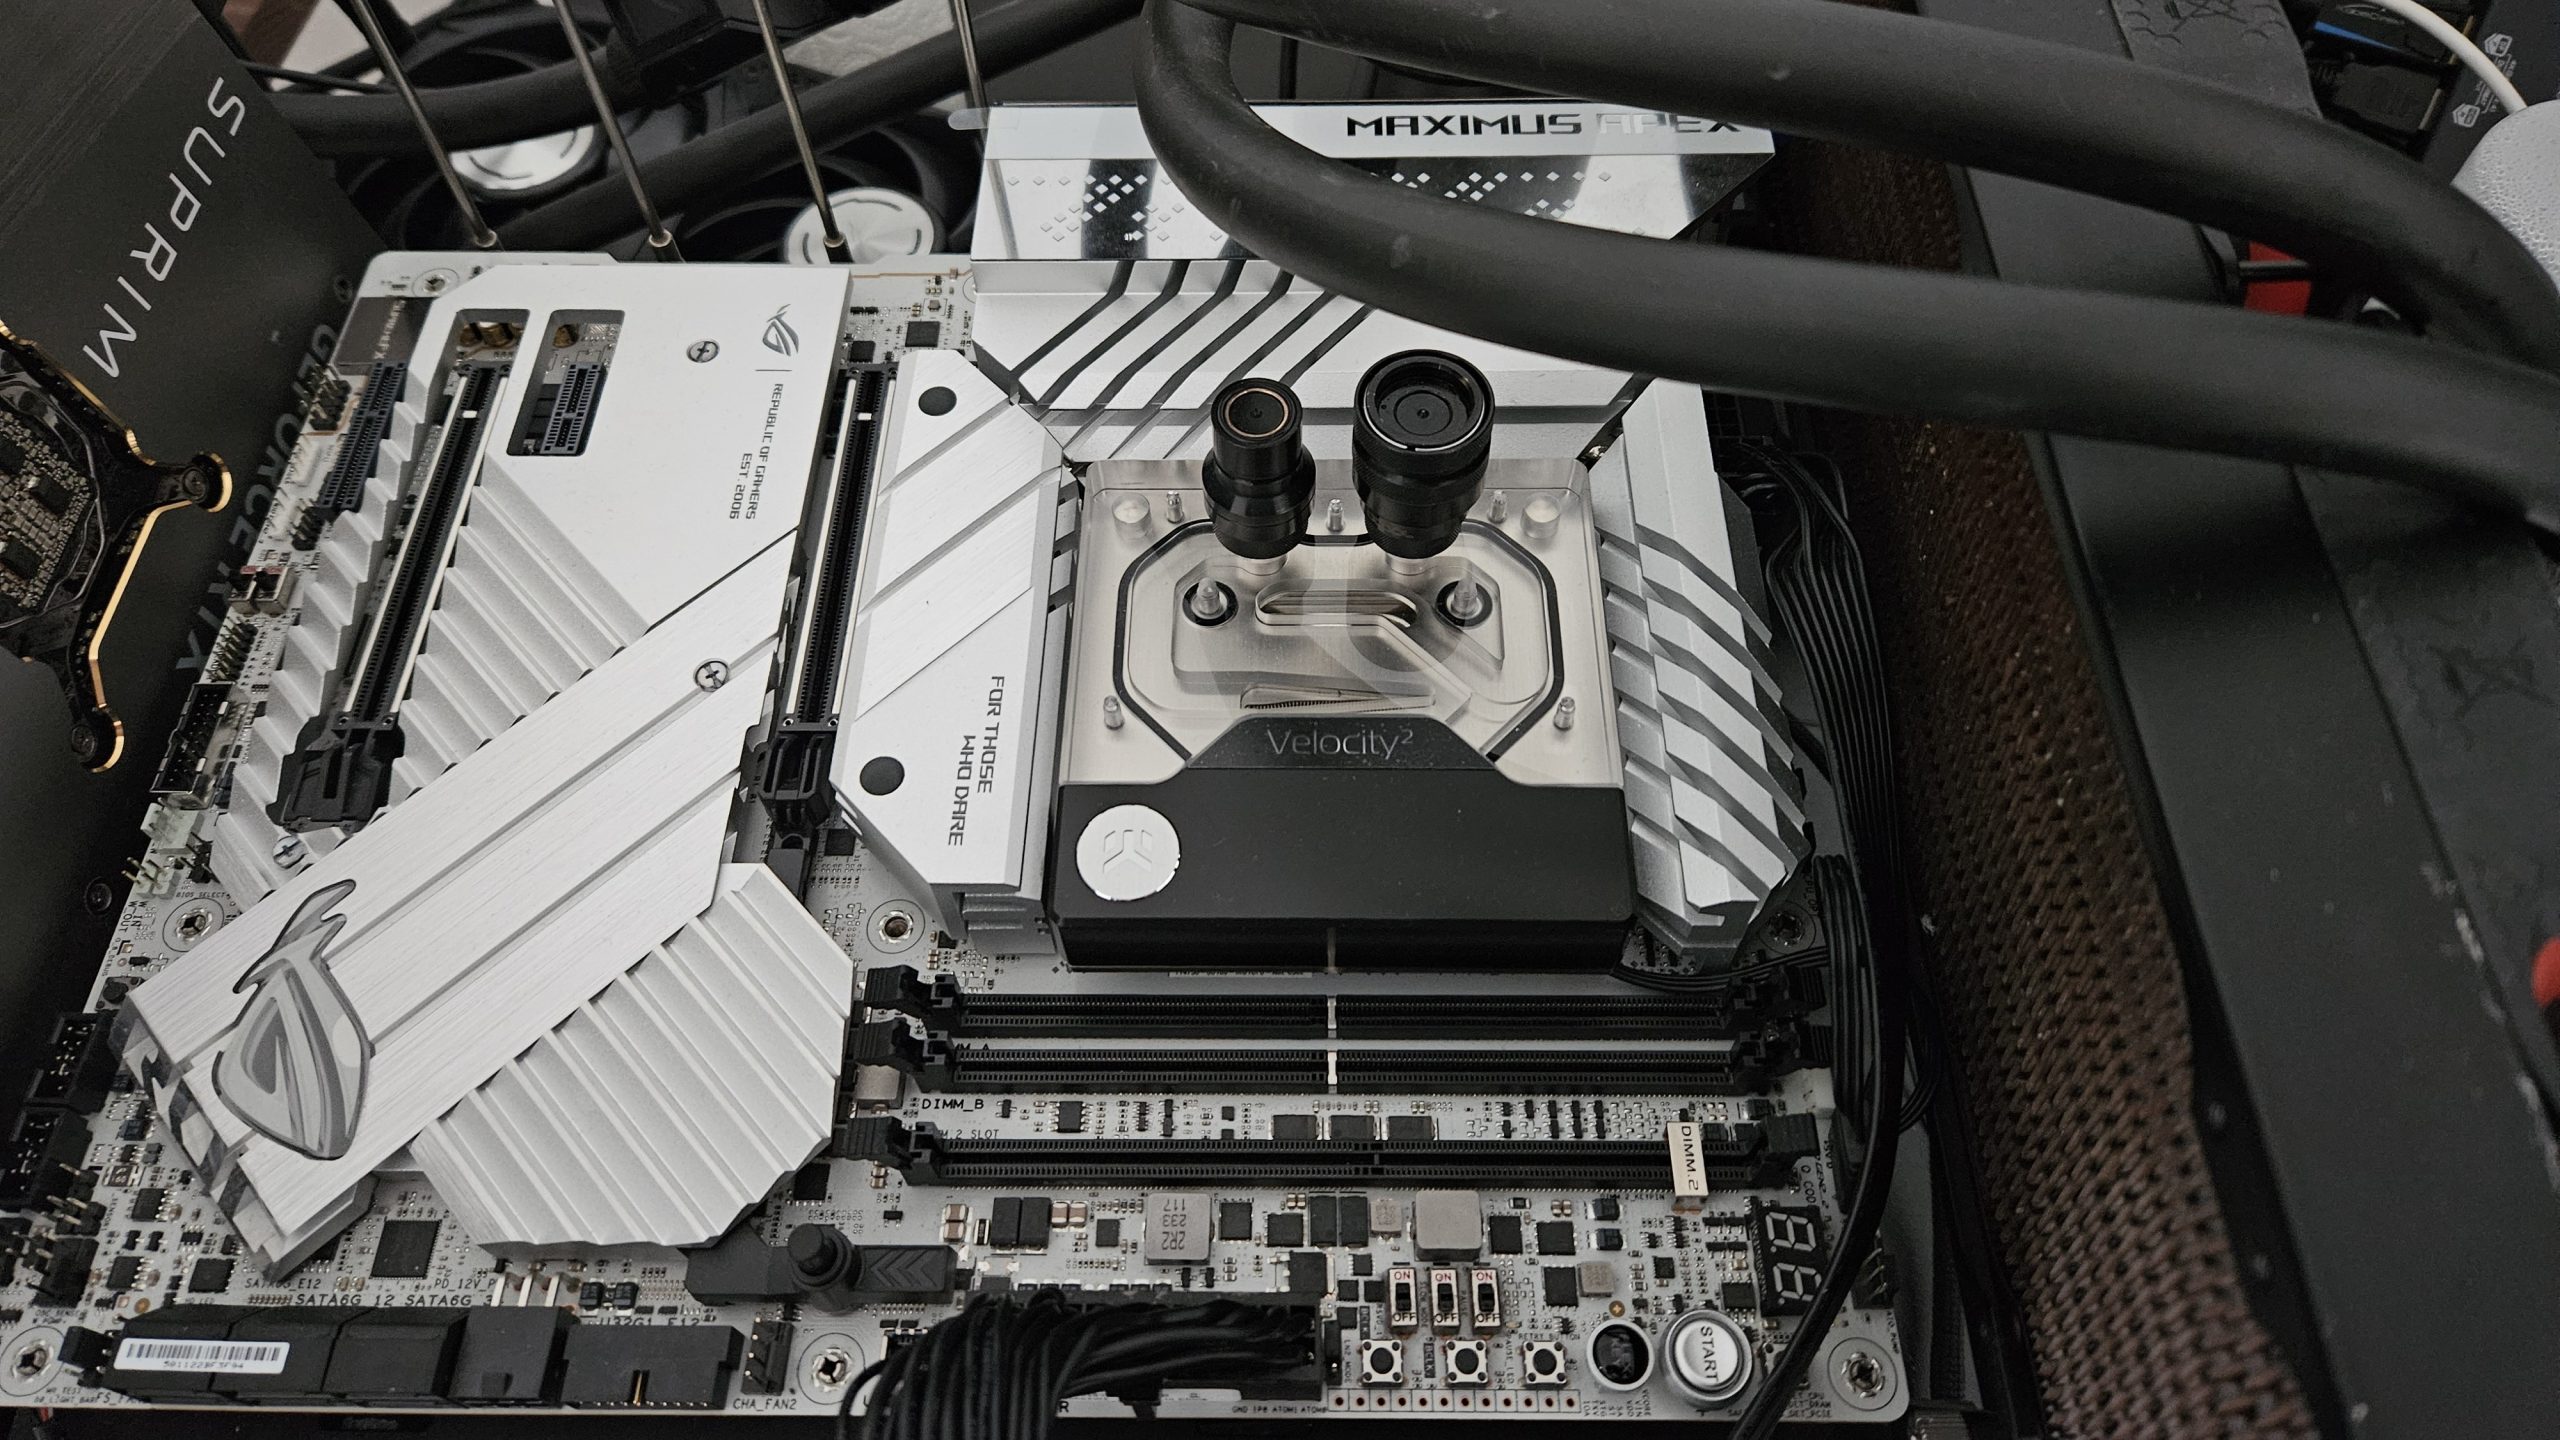
- 3 - EK-Quantum Velocity 2 D-RGB 1700
- 4 - Watercool Heatkiller IV Pro
- 5 - Alphacool Core 1 Aurora
- 6 - Aqua Computer cuplex kryos NEXT
- 7 - Thermaltake Pacific SW1 Plus
- 8 - Liquid Extasy No. Uno
- 9 - EK-Quantum Magnitude
- 10 - Corsair Hydro X XC7 RGB Pro
- 11 - Alphacool Eisblock XPX Aurora und XPX Pro 1U
- 12 - Results for Intel LGA 1700 – Core i9 13900KF
- 13 - Results for AMD AM5 – Ryzen 9 7950X
- 14 - Lessons learned, summary and conclusion


101 Antworten
Kommentar
Lade neue Kommentare
Urgestein
Veteran
Moderator
Urgestein
Veteran
Mitglied
Urgestein
Urgestein
Mitglied
Urgestein
Veteran
Veteran
Mitglied
Urgestein
Urgestein
Veteran
Urgestein
Urgestein
Mitglied
Alle Kommentare lesen unter igor´sLAB Community →