


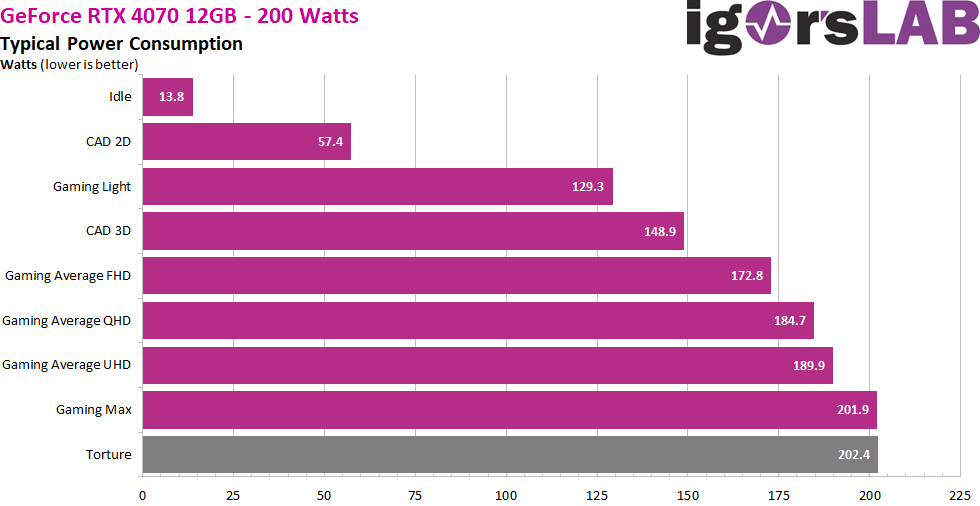
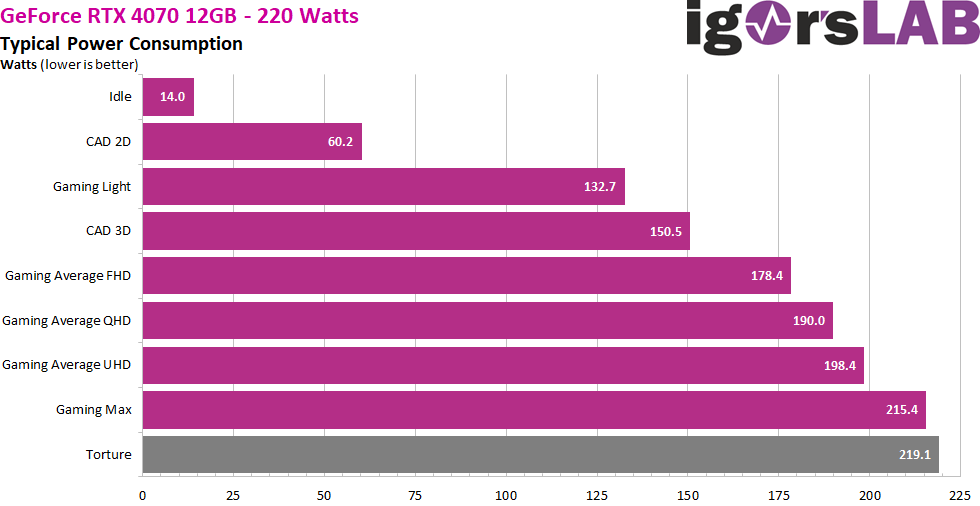
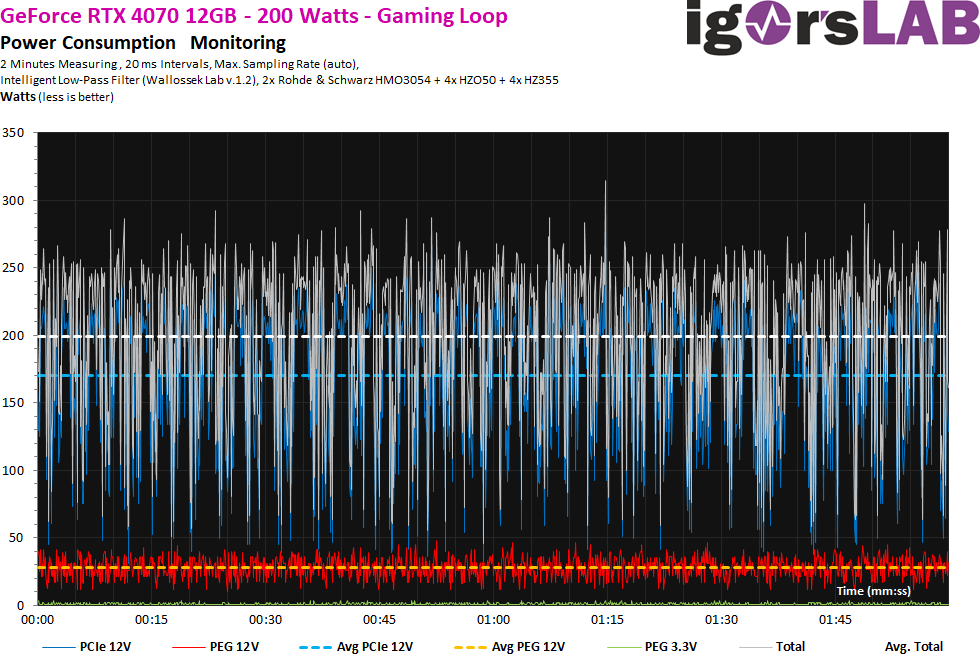
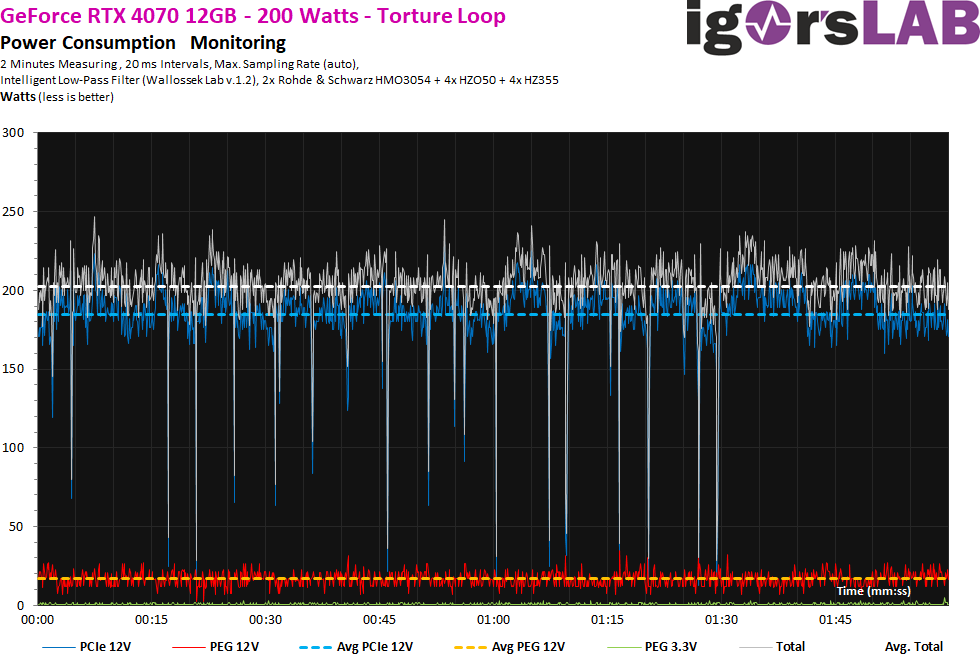
Power consumption in factory state as summary
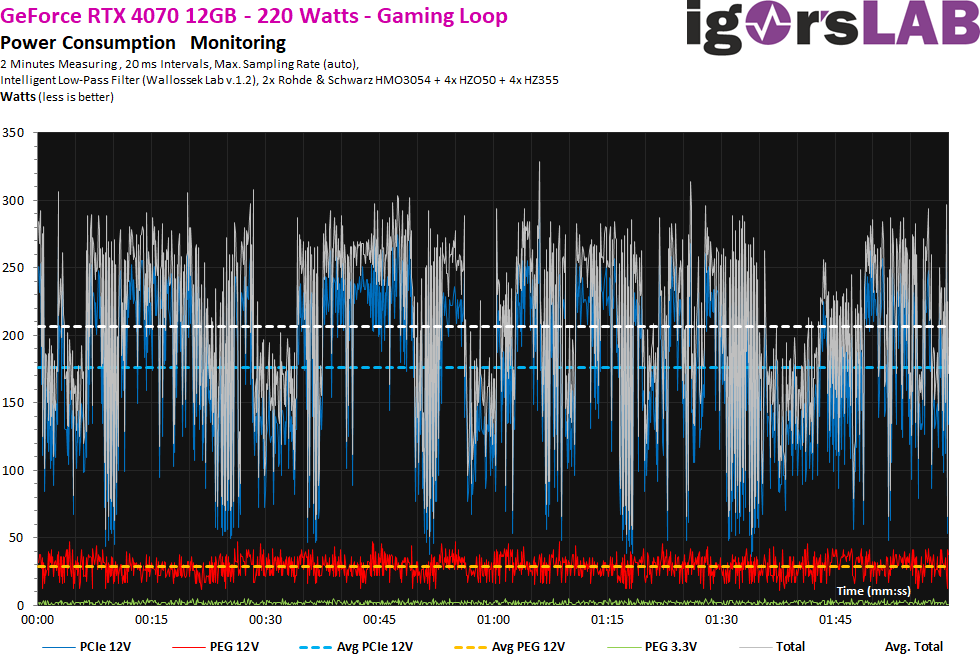
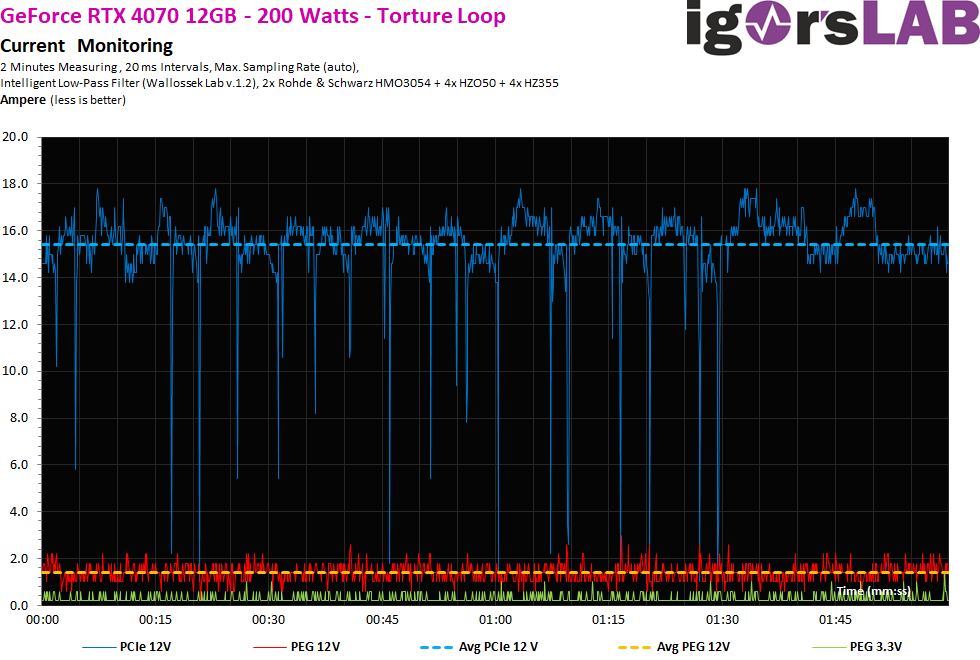
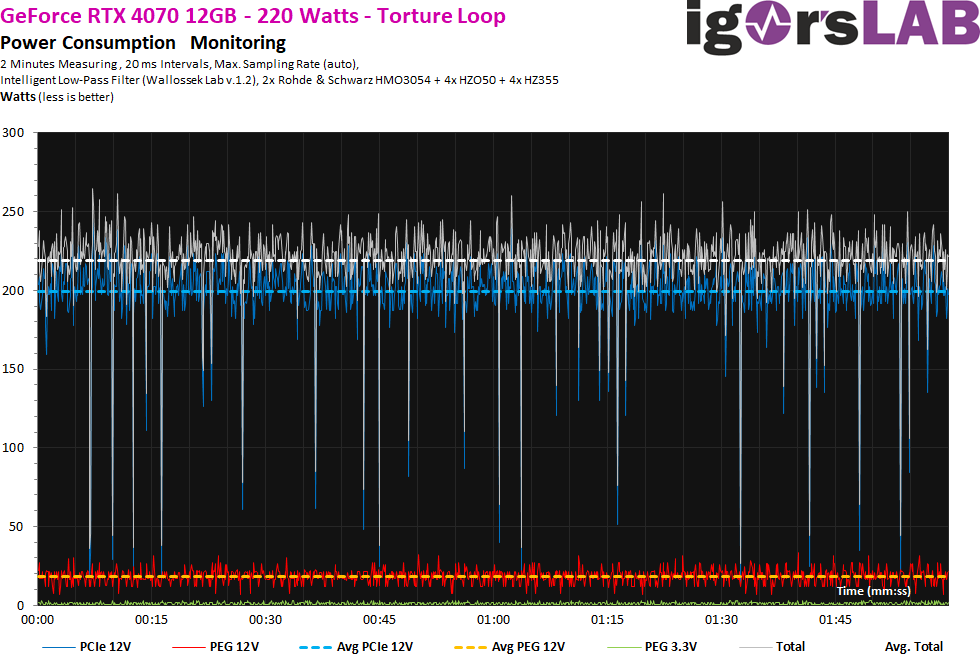
The approximately 14 watts at idle are okay. With a second monitor and a different resolution, however, that quickly becomes 35 watts and more. By the way, we can see very nicely that the full TBP of 200 watts is rarely exhausted and only the Torture Loop or a game here even reaches the frame. Normally, it is always less. When running at the 220 watt power limit, we see that this cannot be reached even in extreme cases when gaming.
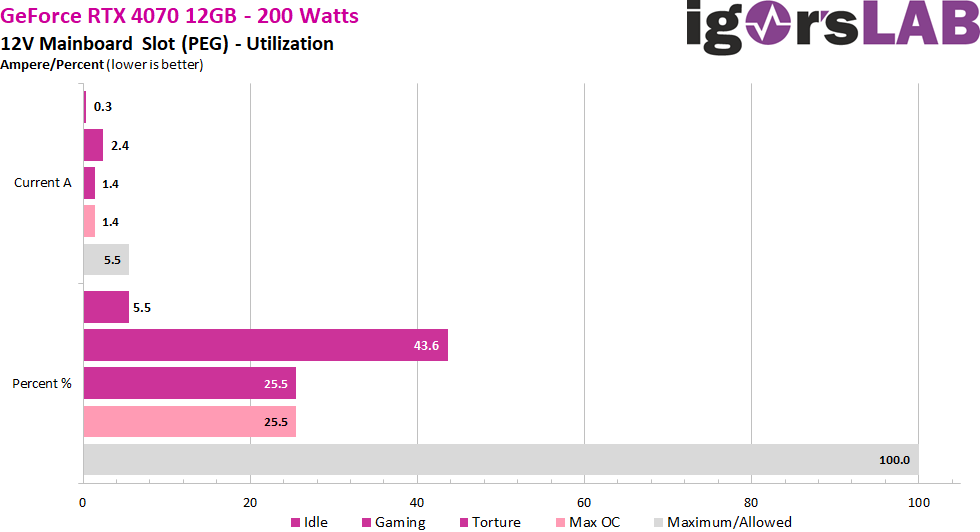
Load distribution between PCIe slot and the PCIe sockets
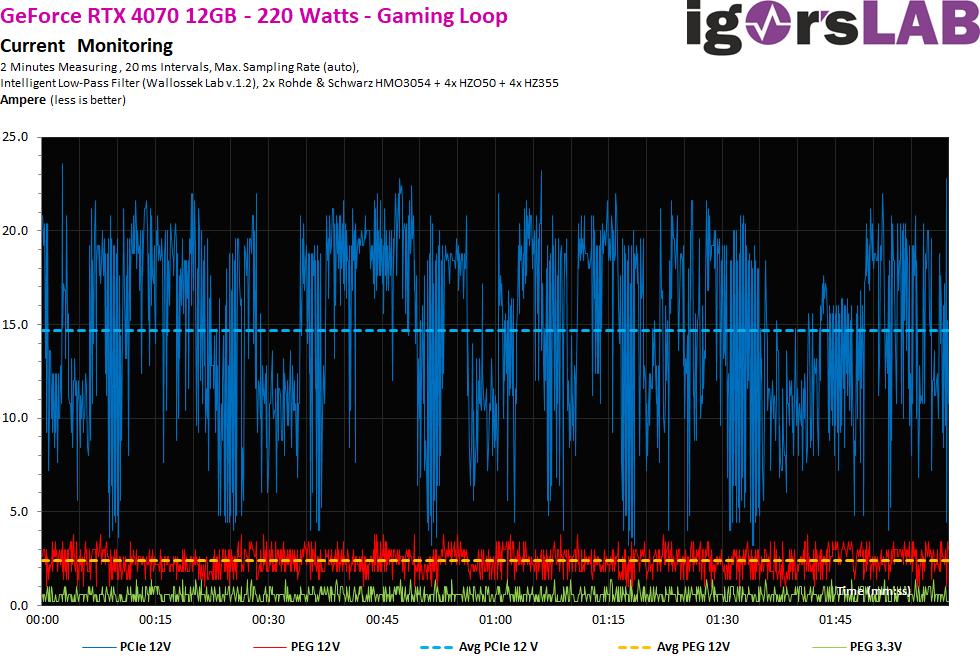
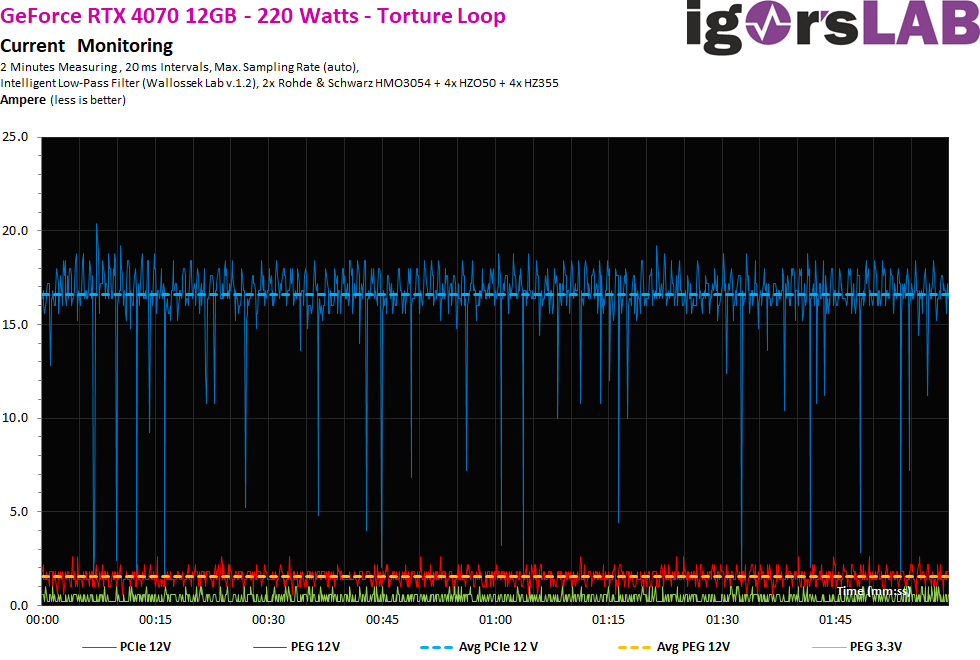
NVIDIA uses the PCIe slot a bit, especially for gaming. But you’re still under half of what’s allowed with 5.5 amps maximum at the flowing currents, even at the increased power limit.

While NVIDIA has significantly reduced the supply via the PEG, AMD continues to use this rail quite excessively.

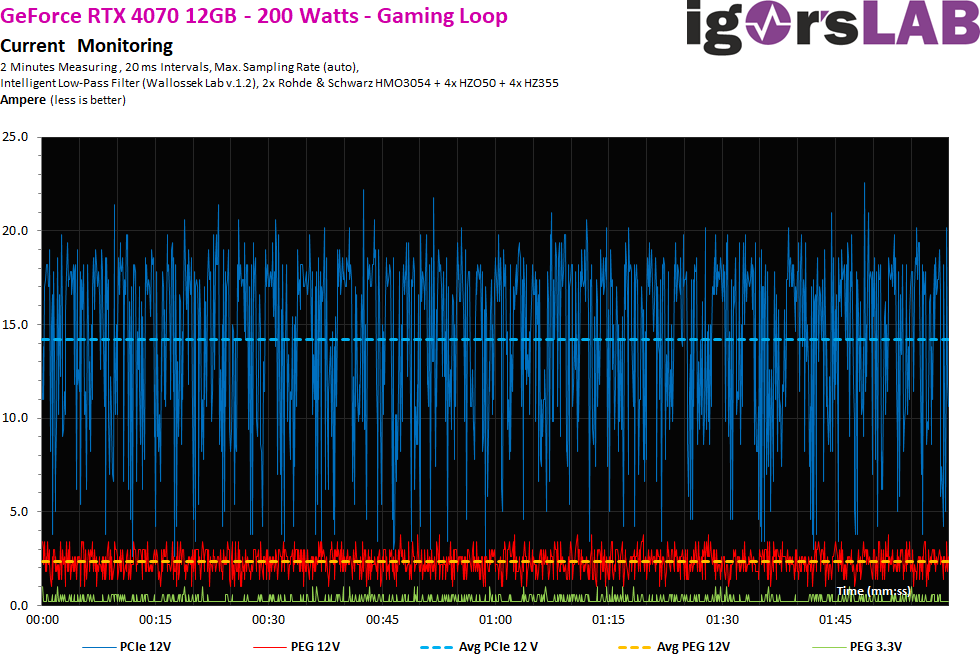
Rough 20 ms intervals
First, let’s look at the flowing streams. Measurements were taken at coarser 20-ms intervals, i.e. around 50 times per second, to simulate the load on the supervisor chip of the power supplies (shutdown). We see that even short load peaks are capped at 20 or 22 A at the latest. but a real limitation looks different. That is not little. However, we also see a big visual difference between the two variants, which nicely demonstrates Boost’s rule frenzy.
Nevertheless, we still need to take a look at the voltages, or the product of voltage and current flow. I already wrote that I measured here at different power supply connections, even if in the end on the board of the graphics card all connections meet again somehow. What we can now see here as much clearer fluctuations and peaks is due to the partial slightly overvolting power supply and thus the voltage and not the currents. This is due to technical reasons, but not a big deal. However, we also see that the few peak at over 300 watts is not due to the current flowing (graphics card), but actually results from the power supply! This is also due to the topology and especially the rather puny input filter with only one coil on the single rail.
The Torture Test is hardly any different. The OC variant regulates a bit more hectically.
If you now add the voltage again, you will see a stronger ripple, which again results from the somewhat jittery operating voltage. However, in the power supply’s honor, it has to be said that this affects all current products of all manufacturers and is certainly hardly avoidable.

- 1 - Introduction, Specs and Unboxing
- 2 - Test system, equipment and methods
- 3 - Teardown: PCB, components and cooler
- 4 - Gaming Performance Full HD (1920 x 1080)
- 5 - Summe Gaming-Performance WQHD (2560 x 1440)
- 6 - Gaming Performance Ultra HD (3840 x 2160)
- 7 - Gaming Performance DLSS vs. FSR
- 8 - Latency and DLSS 3.0
- 9 - Workstation and rendering
- 10 - Power consumption and PEG loads
- 11 - Transients, cutting and PSU recommendation
- 12 - Clock rate and OC, temperatures and thermal imaging
- 13 - Fan speed and noise level
- 14 - Summary and conclusion


258 Antworten
Kommentar
Lade neue Kommentare
Moderator
1
Urgestein
Neuling
Urgestein
Neuling
1
Veteran
Neuling
Urgestein
Urgestein
Veteran
Mitglied
Mitglied
Veteran
Urgestein
Urgestein
Urgestein
Mitglied
Alle Kommentare lesen unter igor´sLAB Community →