


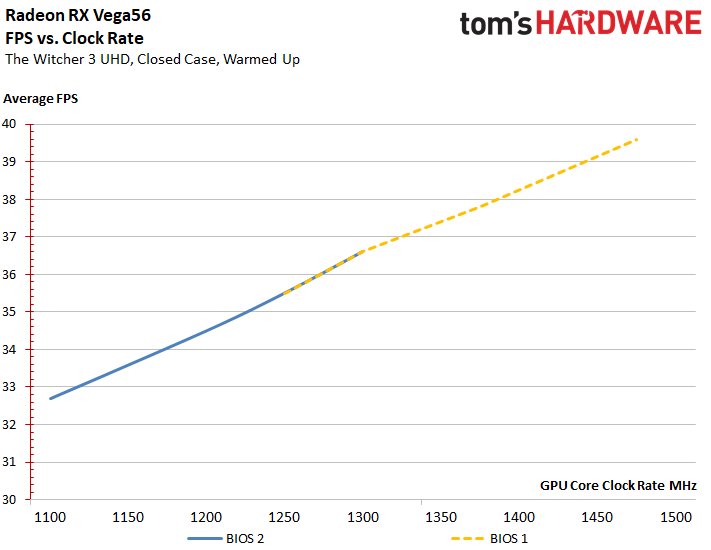
Clock rates and corresponding gaming performance
With Witcher 3 in Ultra HD, we are now testing the worst case at maximum load. Let's just start from the default delivery setting and set the BIOS's "Balanced" mode and the average 36.6 FPS achieved there over the benchmark flow at 1305 MHz as our 100% mark.
If we activate the BIOS 2 and also lower the power limit by 25%, we will reach an astonishing 32.7 FPS with the 1101 MHz that is still possible. Thus, with only 85% of the clock, we still achieve 89% of the gaming performance!
Conversely, the overclocked card at just under 1500 MHz offers 39.6 FPS. If you put this in perspective, then almost 15% more clocks will only bring a good 8% more gaming performance.
From the lowest to the highest average clock, 36.4%, while gaming performance is only 21.1% up in direct comparison. It's not very pretty, but it's not really dramatic either. More important is then already the necessary power consumption and unfortunately it has it in itself.
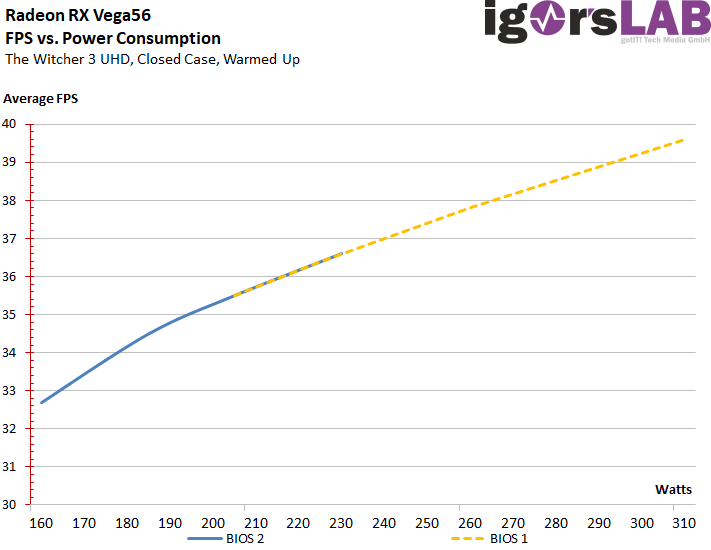
That is exactly what we are now making. If we activate the BIOS 2 again and additionally lower the power limit by 25%, then we achieve a gaming performance of 32.7 FPS with 159.4 watts. Thus, with only 71.6% of the power consumption, we still achieve 89% of the gaming performance of our fictitious starting point of 100% by default ex works!
In the worst case, the overclocked card with 310.6 watts of power consumption offers 39.6 FPS. With an unacceptable 39.5% more power consumption, you only get a good 8% more gaming performance. The efficiency curve is therefore extremely steeply sloping with increasing clock speed and the necessary electrical power.
From the lowest to the highest performance, this means a whopping 94%, while gaming performance is only up 21.1% in direct comparison. This is downright catastrophic, as almost doubling the power consumption brings just one-fifth more gaming performance.
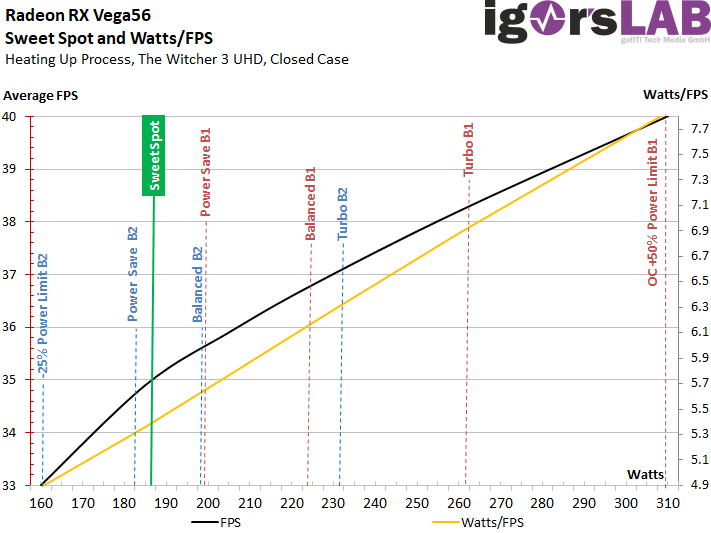
Efficiency and Sweet Spot
If you now combine all the individual values and set the start and end values for the curves on a common basis, then you get a kind of efficiency arc for the FPS/Watt, i.e. the ratio of gaming performance and supplied electrical power. Where the distance between the two curves is greatest, lies the so-called sweet spot, as the area where the map works most efficiently before it starts to become uneconomical again. We see this area between approx. 188 and 190 watts, and it's surprising that AMD places three settings nearby, but not a single one in that area.
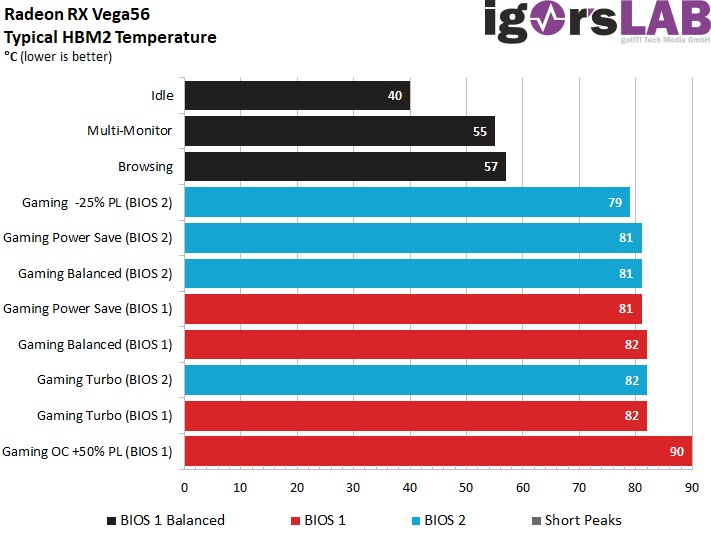
Temperatures for GPU and memory
The temperatures of the fixed six profiles are all at a very similar level, which is once again due to the adapted fan, which turns extremely high when the power consumption increases. The fan control is therefore to be described as quite aggressive. However, the whole thing goes wrong if you perform the overclocking together with the maximum possible power limit of +50%. Then the fan has to give itself a bit beaten and we measure 10°C more than for the fixed modes.
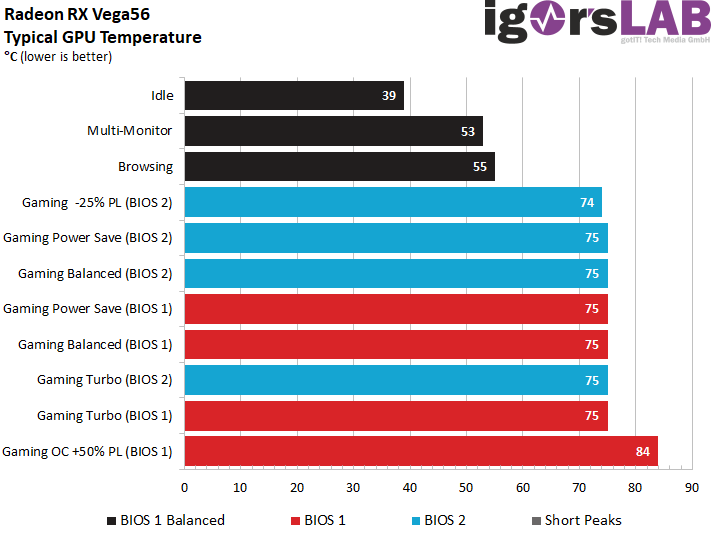
The HBM2 is on average up to 6°C (maximum llast) above the respective temperature. With our overclocking, we were already able to break the 90°C mark, which caused slight nervous belly tingling.
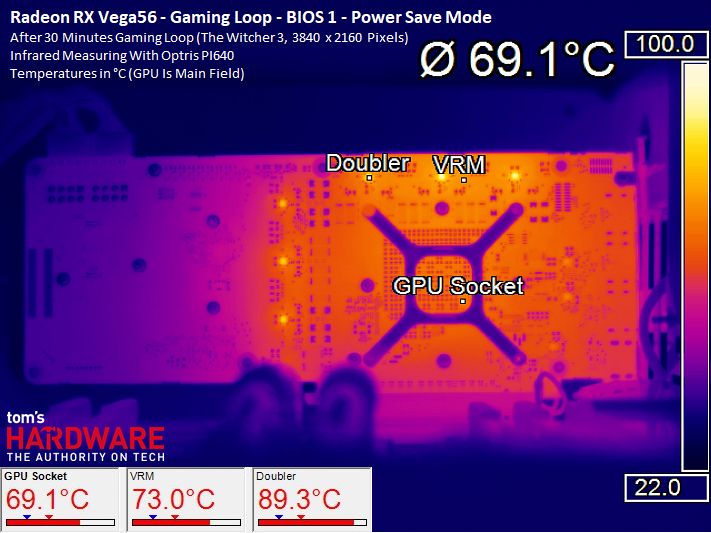
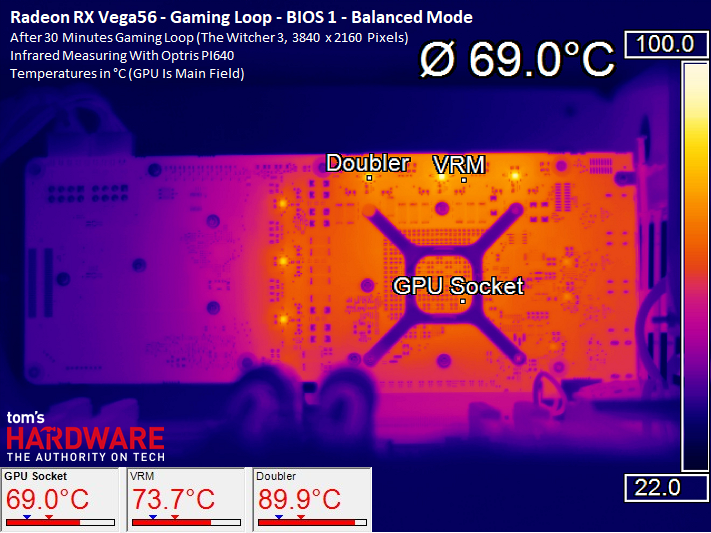
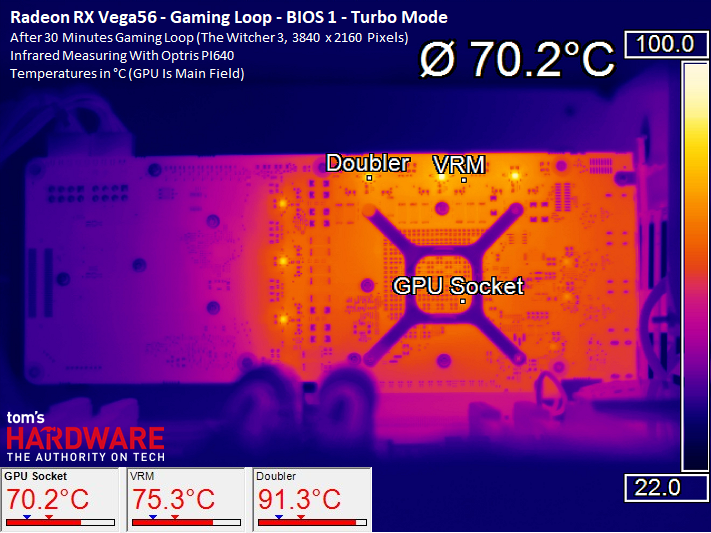
Single graphics for cable recording for BIOS 1
For each BIOS, we now juxtapose the images of the board that we took with our thermal imaging camera and show how the power consumption in combination with cooling (fan speeds) affects the heat generation of individual areas. We can already spoil the fact that the temperatures are very similar except for the overclocking test run, because the fan control is almost consistently able to maintain a target temperature for the GPU of 74 to 75°C, regardless of our ears.

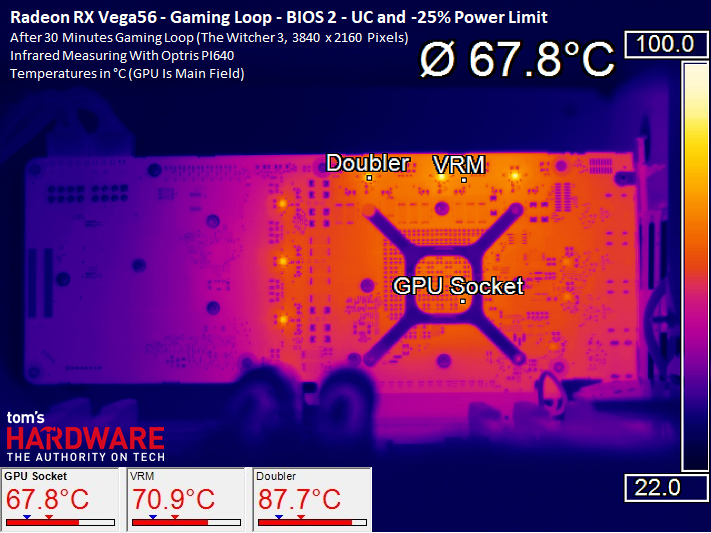
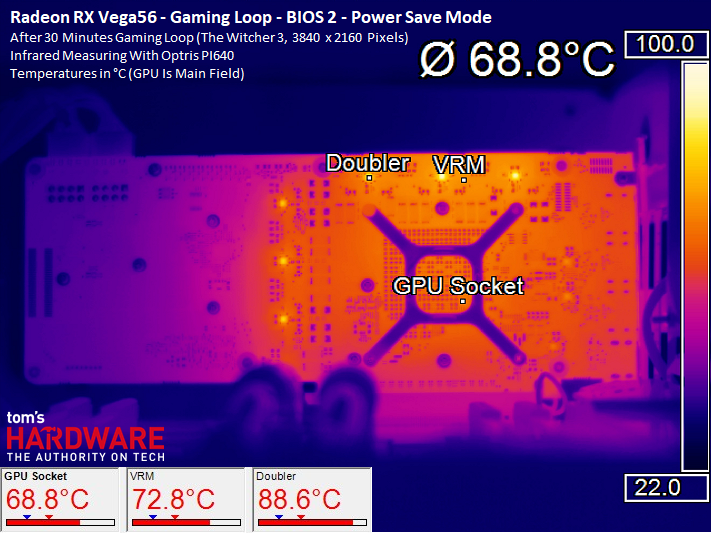
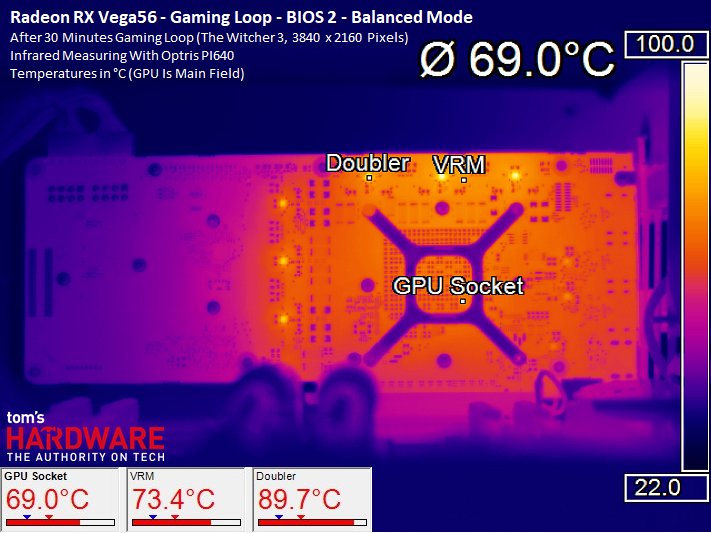
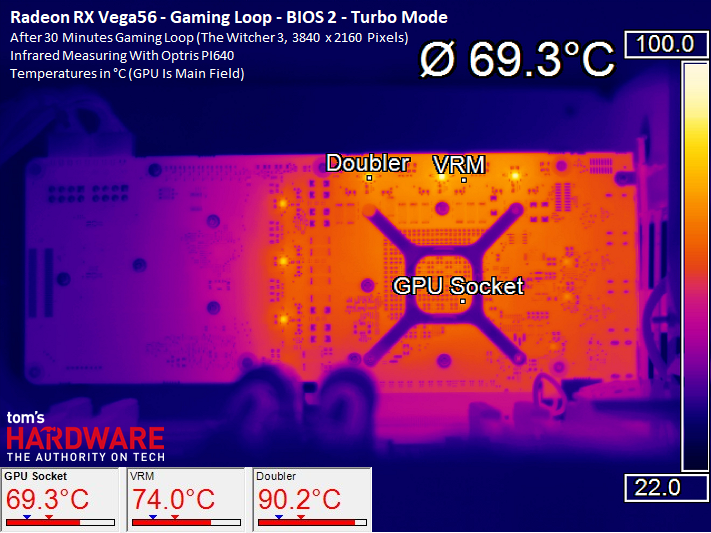
Single graphics for cable recording for BIOS 2
We start with the lowest power output of 160 watts, where there are also some deviations from the predominantly visible average of the other six predefined profiles. However, this is not as pronounced as it is when overclocking. The remaining values increase again together with the power consumption, but only slightly. The rest is done again by the loud hair dryer.
- 1 - Einführung und Übersicht
- 2 - Kühler und Package
- 3 - Platinendesign und Detailinformationen
- 4 - Mining, VR: Arizona Sunshine und Chronos
- 5 - VR: Dirt Rally, Robo Recall und Serious Sam
- 6 - Ashes of the Singularity: Escalation
- 7 - Battlefield 1
- 8 - Warhammer 40.000: Dawn of War
- 9 - Doom (2016)
- 10 - Tom Clancy's Ghost Recon Wildlands
- 11 - Hitman (2016)
- 12 - Metro Last Light (Redux)
- 13 - Tom Clancy's The Division
- 14 - The Witcher 3 Wild Hunt
- 15 - Leistungsaufnahme mit acht verschiedenen Settings
- 16 - Übertaktung, Untertaktung, Effizienz und Temperaturen
- 17 - Lüfterdrehzahlen und Lautstärke
- 18 - Zusammenfassung und Fazit


Kommentieren