CPU Editor's Desk Practice Reviews

The last and fastest of their kind – Intel 13th Gen Raptor Lake Binning | Part 3: i9-13900KS

SP ratio KS vs. K/KF and raw data

But back to the sensible SP values of the cores. Here I have now plotted again the values for the P cores from the previous articles of K and KF CPUs against those of the KS and normalized them relative to the number. So here you can see only the relative distribution in percent, not the actual number per SP value per SKU. At this point, it should be emphasized once again that the 13900KS has a different scale for the SP values and these cannot be directly compared with K and KF.

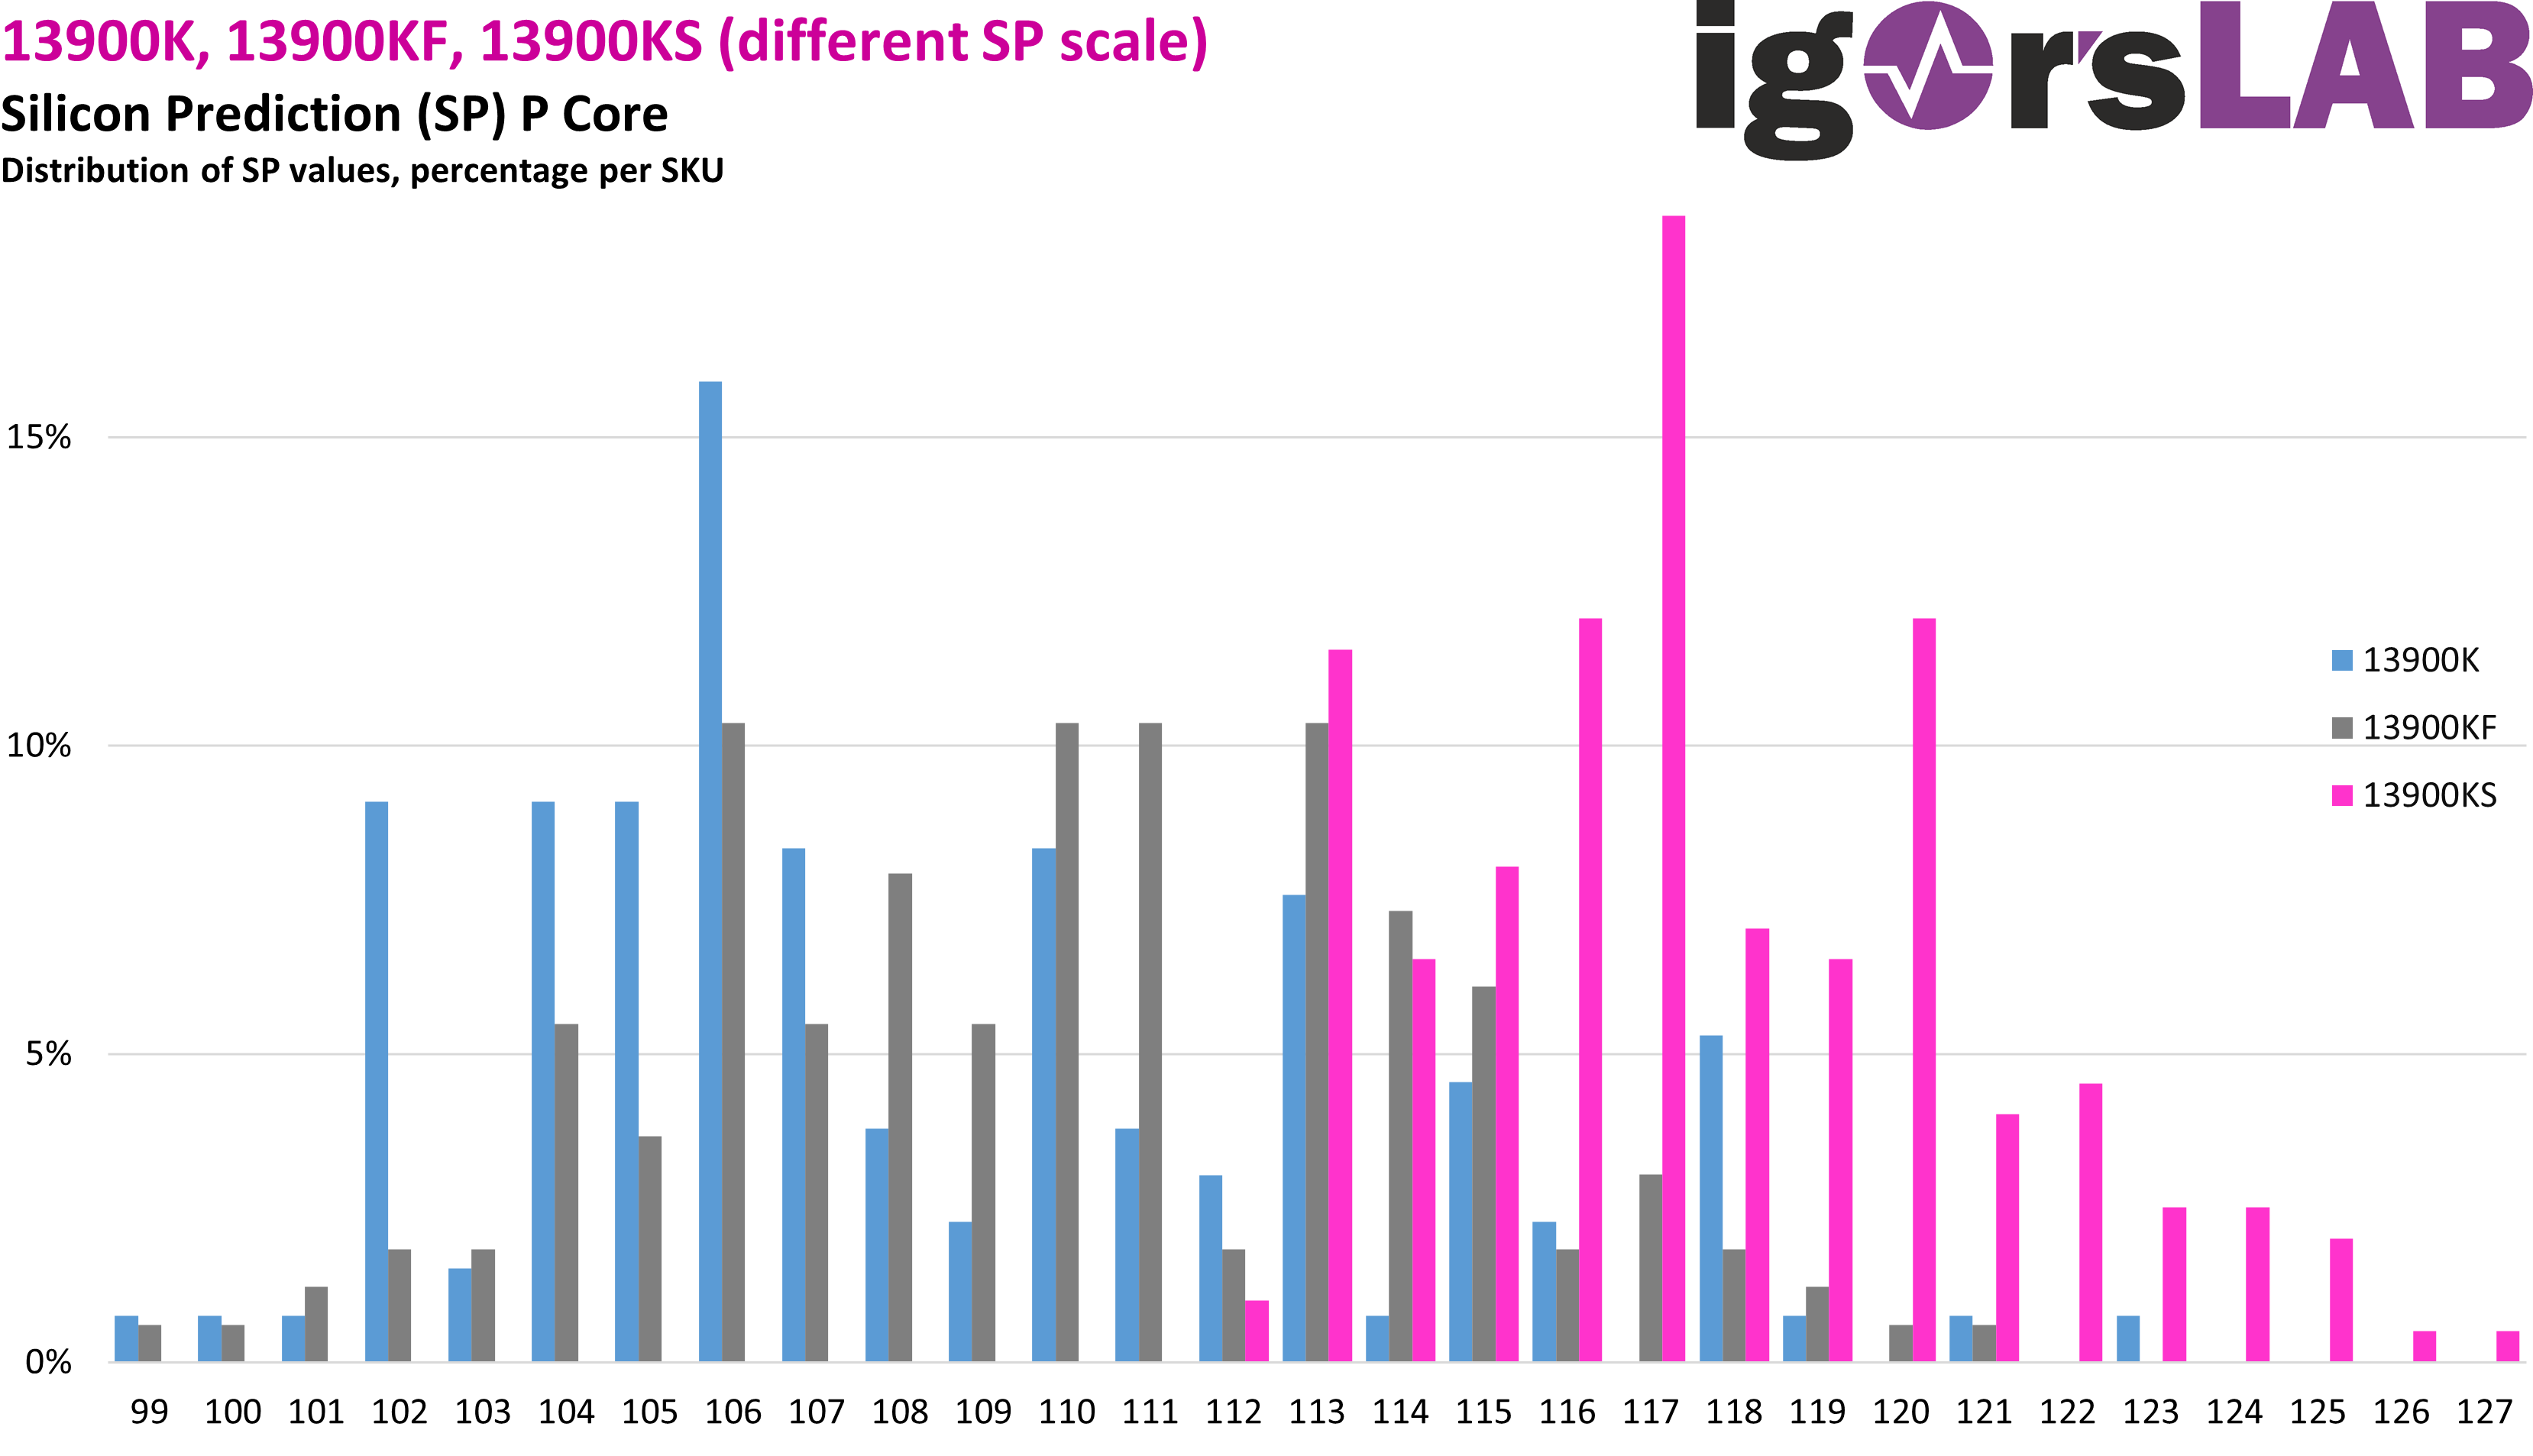
While the 13900KF shows an almost evenly bell-shaped distribution, the K and KS SKUs are shifted to the left and right, respectively. This is actually obvious because, as already mentioned, the chips with a working iGPU are divided into K and KS, but the chips without a working iGPU are not. And if you pick out the best from the amount of potential K CPUs, this automatically results in a larger share of inferior CPUs among the rest. Here it also becomes clear once again that you certainly don’t get a potato CPU with a 13900KS, although no main prize in the Silicon Lottery is guaranteed either.

But what would have to be done now so that the SP values of KS, K and KF can be compared? Attention, speculoos alert! In the following, I have artificially corrected the SP values of the KS CPUs with a factor so far downwards, until the distribution over the SP values of from K and KS CPUs together coincides as well as possible with the KF CPUs. This is based on the assumption that all 3 SKUs are theoretically produced in the same way, with the same production tolerances, and thus the same proportional accumulation per SP value should result.

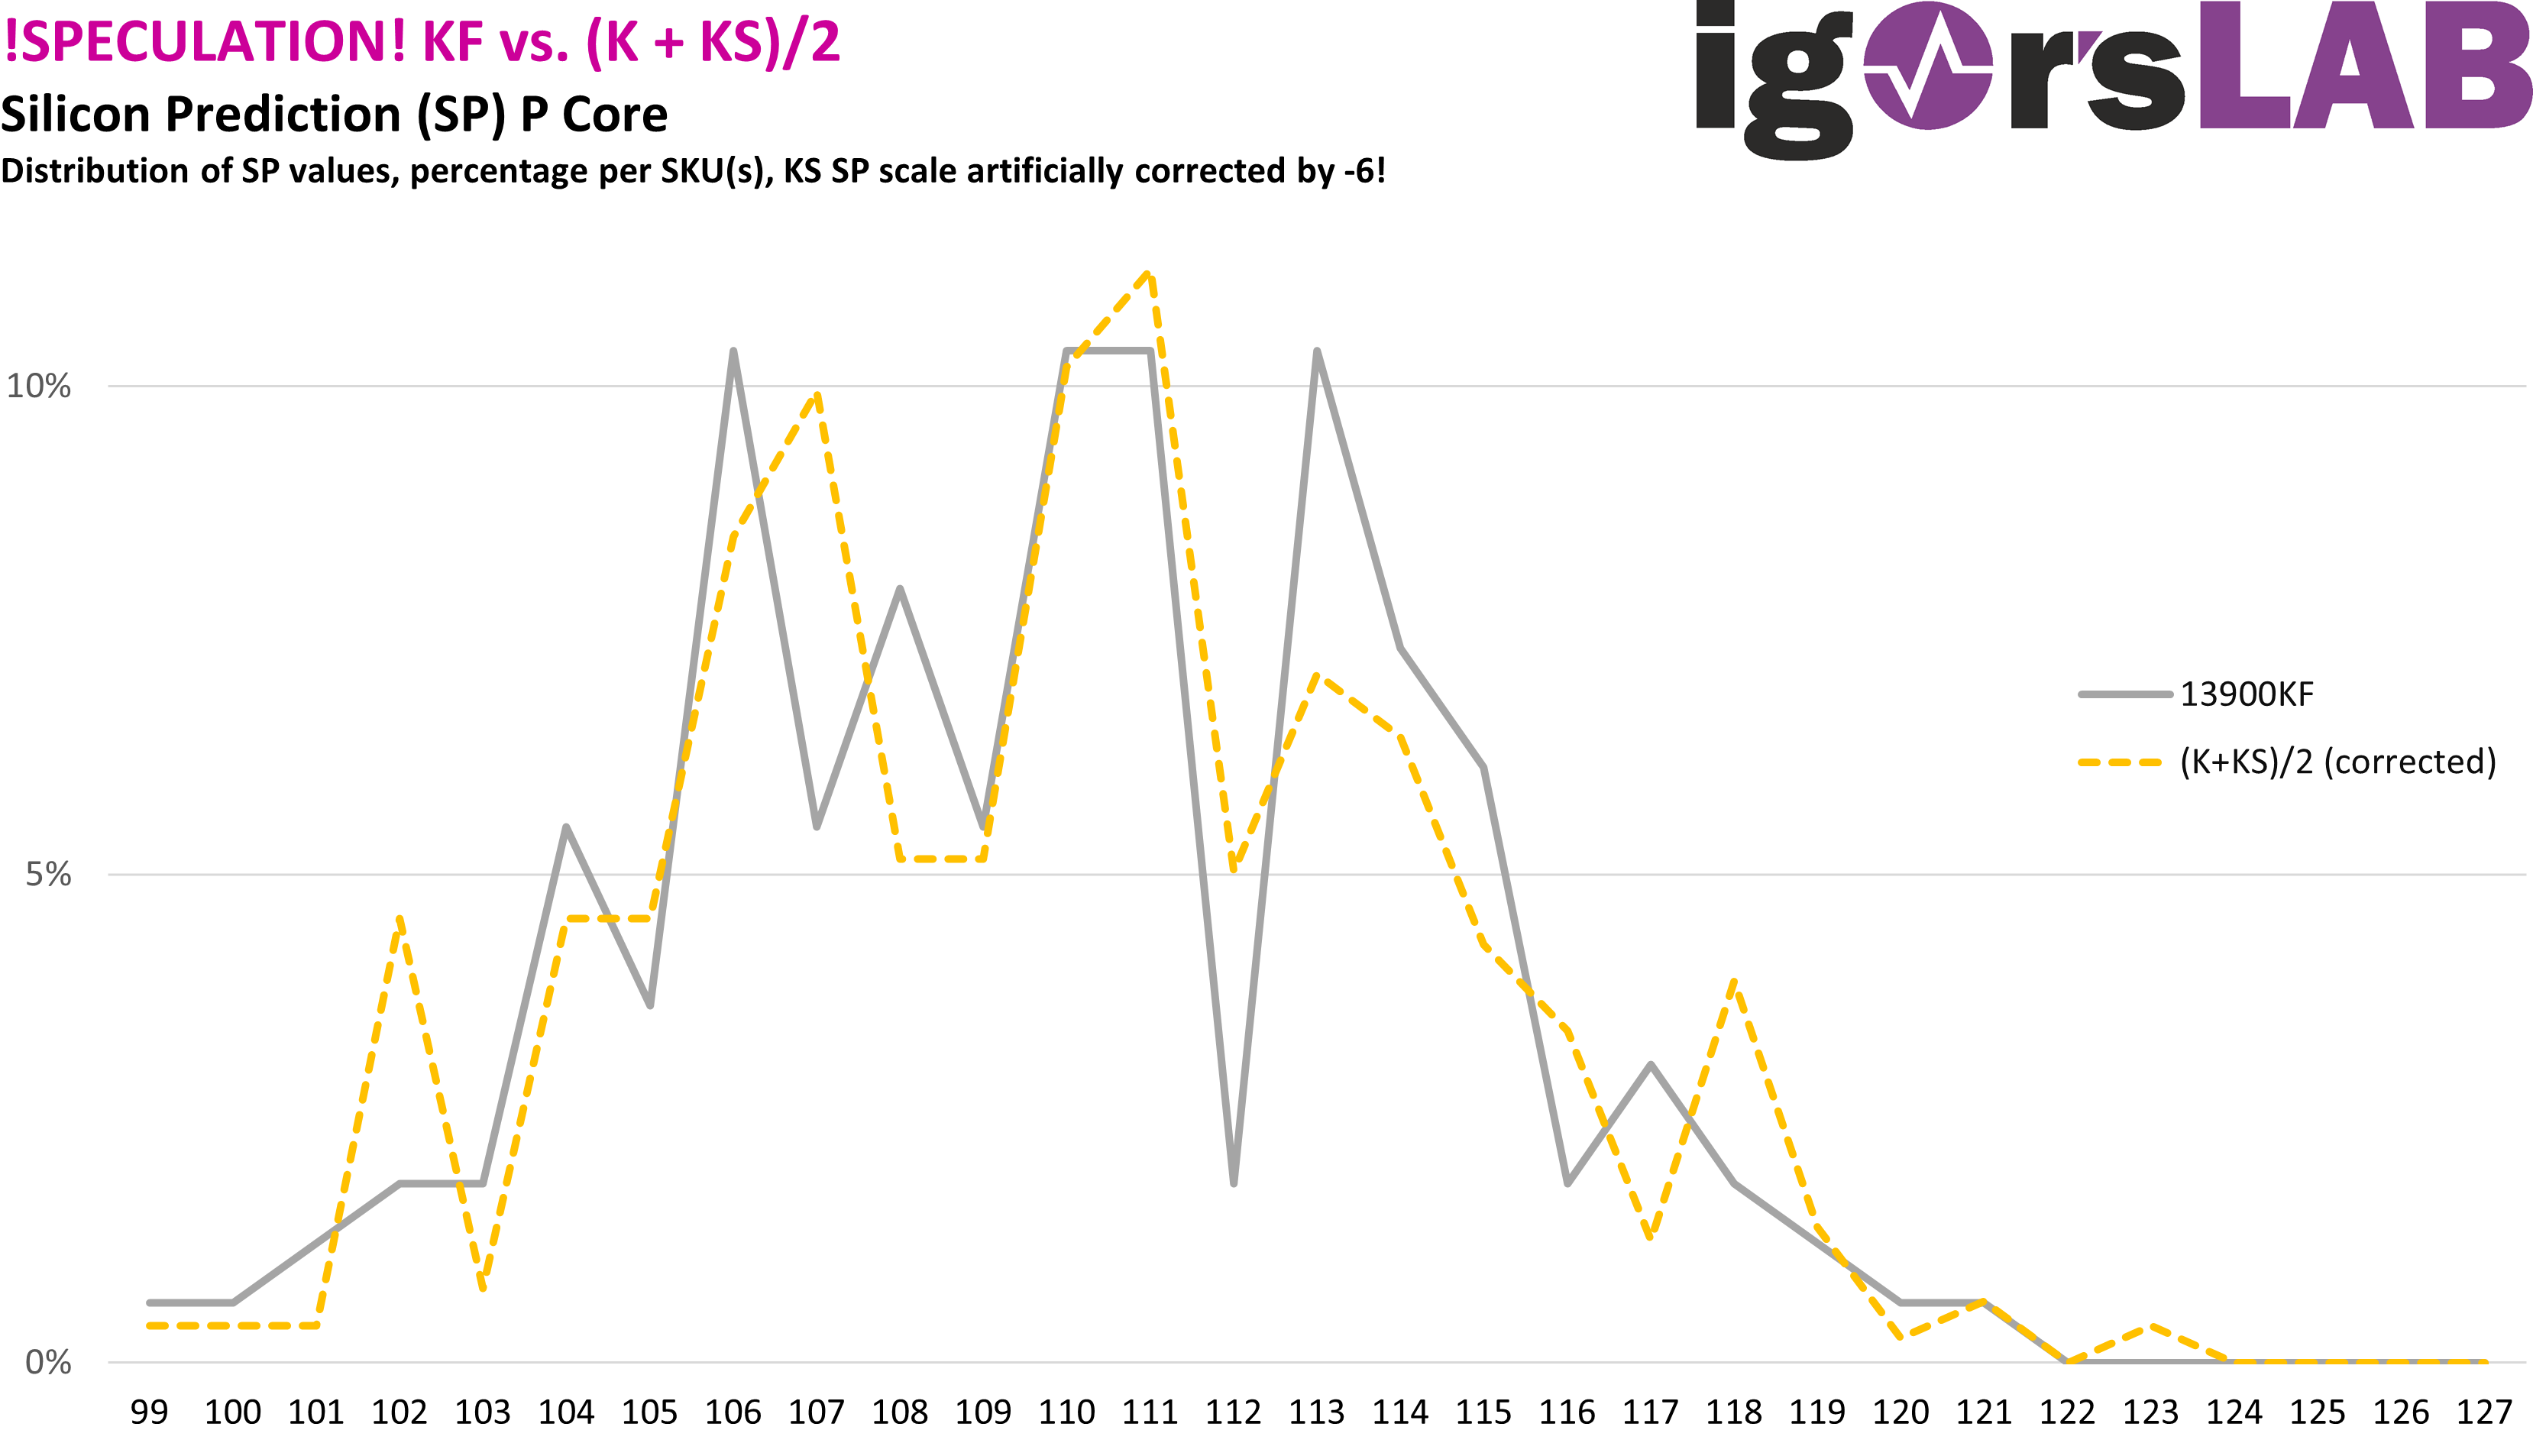
And the result is not 42, but -6. Now, of course, such a data alignment is not an exact science and the curves do not really coincide, but it should not be too far from reality either. Because it has also been shown in practice that the 13900KS does not clock higher in the same ratio as their P SP values are larger. In concrete terms, this would mean that a 13900KS CPU with P SP 126, for example, is about as good as a 13900KF with P SP 120. Conversely, the best 13900K CPU with P SP 123 actually tested by us would then still be of slightly higher quality than the best 13900KS CPU with P SP 127.

Though, in practice SP values are no exact science either. It’s actually not uncommon that a CPU with theoretically slightly worse SP values can achieve minimally higher clock speeds and vice versa. Again different is the behavior under extreme cooling methods, where for example at -190 °C an SP 120 might outclock an SP 125 that was faster at ambient temps with normal cooling methods. In the best case scenario SP values, cookies, CPU Force results etc. are only reference points, and in the worst case they are completely meaningless, as we saw today. At the end of the day, you can only do one thing to be sure: Real testing in the actual usecase. 

Whoever has a better idea to evaluate the masses of data and somehow bring the K and KS together to the same denominator is welcome to try it for themselves. Because as of today, all of our raw binning data for Raptor Lake CPUs is publicly available at the following Google Sheets link: https://docs.google.com/spreadsheets/d/1vZfWYrC3HGF4mVzirq7v9PFGJWYGy5_DvR32ssIPFdU/

As David Kriesel once put it so beautifully: “Raw data is hot!” (roughly translated) In this sense, have fun with it! If you discover any more interesting correlations in the data, or maybe just find an error in the formulas, feel free to let us know in the forum thread! 😊


Kommentar

Lade neue Kommentare

ApolloX

Urgestein

1,668 Kommentare 934 Likes

CooleArbeit, auch danke für die Rohdaten!

Antwort 1 Like

Opa-Chris

Mitglied

84 Kommentare 120 Likes

Vielen Dank für den informativen Artikel, aber Du hast eine wichtige Information weggelassen:

Bei der "Zusammenfassung Testsetup" hast Du leider ausgelassen, was für eine Pizza Du auf dem Foto im Einsatz hattest.... :ROFLMAO:

Antwort 1 Like

C
CKBVB

Mitglied

75 Kommentare 36 Likes

Ist es wirklich die letzte Generation auf S1700? Ich meine doch, dass sich zuletzt Gerüchte verdichteten, dass es noch einen Refresh geben wird, da der Nachfolger nur in der Mittelklasse und Notebooksegment gedacht ist? Oder hat sich das zerschlagen?

Antwort Gefällt mir

M
Master-W-Steve

Mitglied

68 Kommentare 18 Likes

Das habe ich auch gelesen, allerdings auch schon des Öfteren, dass die 13k wirklich die Letzten sind.

Antwort Gefällt mir

L
Lowmotion

Mitglied

86 Kommentare 23 Likes

Die Gretchenfrage jeden Tag eines Neukäufers ist doch: reicht mir ein Übergangs 13600k oder soll ich direkt den besten 13900KS nehmen? Weil 13900KS steht für garantiert höhere Qualität, was mit besserem OC oder niedrigerem Verbrauch einher geht. Und dann sind wie wieder beim toten Sockel, wo die AMD Jünger dem AM5 noch 4+ Jahre geben. Denn wenn AMD mit dem 7800x3D sogar einen 13900KS in die Pfanne hat, kauft ja niemand mehr einen Intel. Und grundsätzlich braucht ja niemand einen i9 zwingend im Homebereich. An den Verkaufszahlen sieht man auch, dass die Nachfrage nach i9 recht gering ist. Also wäre es klug noch 3-4 Wochen auf den 7000x3D zu warten und dann zu entscheiden. Dann sieht man die Zukunftsfähigkeit der Cache CPUs oder nicht. Der nach hinten verschobene Release deutet auf Probleme hin. Zudem scheint der Euro noch zu steigen, was wiederum für ein Warten spricht. Ebenso könnte es bei den kleinen AM5 Chipsätzen zu günstigen, ausreichenden Mainboards reichen.

Antwort Gefällt mir

P
Phelan

Veteran

192 Kommentare 172 Likes

CPUs erreichen mittlerweile typische Nutzungszeiten von 5-10 Jahren. Selbst in Gaming PC hat man mit eineraktuellen CPU schnell mal 7 Jahre ausgesorgt. Da wird die Aufrüstbarket des Sokels uninteressant, wenn er nicht 10Jahre+ gepflegt wird.

Mit einen 5800X (3D) oder 13700k kann man locker 2,3,4 Generatioen überspringen.
Und dann will man eh eine neues MB , weil man eine aktelle SSD und den neuen Ram nutzen möchte.

Antwort 5 Likes

F
Furda

Urgestein

663 Kommentare 371 Likes

Hatte letztes Mal im Kommentar einen "Kübel" Wärmeleitpaste erwähnt - seit diesem Weekend ist nun klar, dass nicht ein Eimer WLP verbraucht wurde, sondern Tuben-weise Getriebefett oder Gleitmittel 😉

Antwort Gefällt mir

a
ak48disk

Neuling

1 Kommentare 0 Likes

I think the way for calculating combined SP for 13900K and 13900KS is flawed because you essentially oversampled 13900KS to 50%, compared to Intel makes way more 13900K than 13900KS. If you take a random CPU from an unbinned 13900K(S) it is more likely to be a K rather than KS.
As a result the combined distribution heavily shifts to the dist of 13900KS, so the correction factor (-6) should be smaller.

Antwort Gefällt mir

Alkbert

Urgestein

933 Kommentare 708 Likes

Was man mit einem 13900 KS anstellen kann, ist schon erstaunlich.
Die hardwareluxxuriösen Kollegen stellten gerade eine Kiste vom Käsekönig vor, die ein gewisser 8 (S)pack oder so für 12.399 Euro (Minimum!) anbietet. Kann auch noch ein bischern teurer werden, wenn man beispielsweise 64 GB Speicher will.
Für das Geld würde ich mit die fettest denkbare Threadripper Plattform hinstellen, alles andere ist für dieses Sündengeld lackgesoffen zu teuer. Aber es soll ja Leute geben .... ohne Worte.

Antwort 1 Like

Derfnam

Urgestein

7,517 Kommentare 2,029 Likes

Unter 13.900 Kiesel ist schändlich, @Alkbert.

Mir entgehen weiterhin Sinn, Zweck, Nutzen und Ziel der ganzen Aktion komplett.
Ernsthaft.
Aufklärung gerne als PN.

Antwort 1 Like

MeinBenutzername

Veteran

210 Kommentare 74 Likes

Ich stelle mir die ganze Auswertung die ihr da betrieben habt seeehr zetintensiv vor. 🏅

Antwort 1 Like

LurkingInShadows

Urgestein

1,352 Kommentare 552 Likes

12,4k? wtf wie geht das denn?

Edit: da geht noch mehr... 38.991,50 € gibts auch....

@ 12,4k System:
PSU 310€
Corsair 5600 RAM ab 145€
NVMe 119€
SSD 315€
CPU 627€
Mainboard 490€
4090 1800€

Summe: 3.806€
Dazu noch Gehäuse, Wakü und OC für 8.593€ ???

10 Mal pro Jahr bauen und man braucht sonst nicht mehr arbeiten.....

Antwort 1 Like

Klicke zum Ausklappem
skullbringer

Veteran

306 Kommentare 328 Likes

As mentioned it's speculation and not exact science. Yes, you are right in that both SKUs have equal weight in our speculative distribution curve diagram, but unfortunately we don't have any better numbers. It was just a thought experiment and the main point was showing off that there is in fact a negative factor at play, be it -1, -10 or anything in between.

The XOC guys also tested the P SP 126 KS under LN2 and it could not reach the same clocks as a P SP 123 K. Of course, VID and SP are not perfectly accurate either, but there are a lot of those examples pointing in the same direction

Antwort Gefällt mir

Danke für die Spende


Du fandest, der Beitrag war interessant und möchtest uns unterstützen? Klasse!

Hier erfährst Du, wie: Hier spenden.

Hier kannst Du per PayPal spenden.

About the author

Xaver Amberger (skullbringer)

Werbung

Werbung