CPUID powerMAX
The combined CPU and GPU stress test was not our first choice for GPU loads, but it can score points, at least in the CPU range. The advantage is that you can easily switch between AVX and SSE code path. The free download is available here.

powerMax with AVX
You don't reach the extreme peaks like Prime95 with AVX, but at least almost. The loads that can be produced here are also well above the average and thus own themselves for a good test of cooling performance. However, stability tests in the boundary range of overclocked systems do not make sense if one does not want to detect thermal weaknesses. In addition to the FPU, the cache is also properly utilized.
| CPU Package (PECI) |
Core Average |
Sensor Socket |
Working Memory |
Cpu Watts |
System Watts |
|
|---|---|---|---|---|---|---|
| Reading |
79 °C | 79 °C | 98 °C | 28°C | 160 W | 232 W |
| Compared to The Max. |
90.8 % | 91.9 % | 93.3 % | 77.8 % | 93.0 % | 92.1 % |
| Review | – high package temperature – very high base temperature – rather low storage temperature – very high power consumption of CPU and overall system |
|||||
| Suitability | – Cooling tests for performance coolers | |||||
powerMax with SSE
With the SSE code path in our test system, you can achieve an average of 10°C lower temperatures, while the memory is slightly higher in the same way as the utilization of the memory.
| CPU Package (PECI) |
Core Average |
Sensor Socket |
Working Memory |
Cpu Watts |
System Watts |
|
|---|---|---|---|---|---|---|
| Reading |
69 °C | 68 °C | 98 °C | 30°C | 132 W | 191 W |
| Compared to The Max. |
79.3 % | 79.1 % | 93.3 % | 83.3 % | 76.7 % | 75.8 % |
| Review | – medium package temperature – moderate storage temperature – mean power consumption of CPU and overall system |
|||||
| Suitability | – Stability tests for overclocked systems | |||||
Heavy Load
For the generation of more realistic CPU loads, the program is quite useful, even if we only reach load values that correspond to those of average demanding games. If you do not want to test the cooling to the limit, but rather to map the everyday life, then you can use this test safely and run on very weak hardware for a longer period of time without fear of severe hot flashes. However, it is not a stress test program in the traditional sense. If you want to experiment with it, you can find the program here.
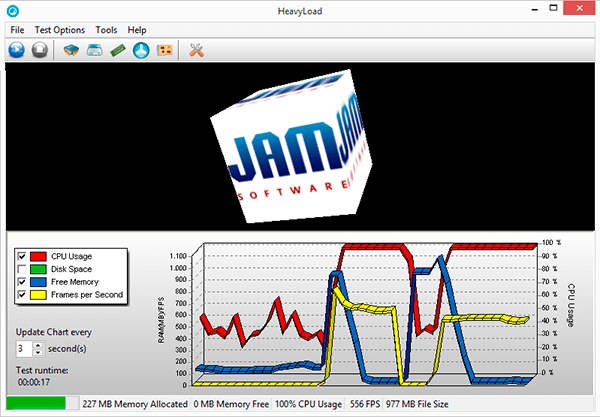
Exactly what happens in the pure CPU test remains the secret of the programmers, whereby none of the command set extensions seem to be used explicitly.
| CPU Package (PECI) |
Core Average |
Sensor Socket |
Working Memory |
Cpu Watts |
System Watts |
|
|---|---|---|---|---|---|---|
| Reading |
58 °C | 61 °C | 60 °C | 30°C | 105 W | 156 W |
| Compared to The Max. |
66.7 % | 70.9 % | 57.1 % | 83.3 % | 61.0 % | 61.9 % |
| Review | – low core and package temperature – moderate storage temperature – rather low power consumption of CPU and overall system |
|||||
| Suitability | – Stability tests for weaker and older hardware – Stability tests for weaker mobile devices – Simulation of normal average loads |
|||||
- 1 - Einführung und Testsystem
- 2 - Prime95 mit AVX oder SSE
- 3 - OCCT mit vier Varianten
- 4 - Aida64: FPU vs. Cache vs. Memory
- 5 - powerMAX, Heavy Load
- 6 - CPU Only: Leistungsaufnahme
- 7 - CPU Only: Temperaturen
- 8 - System: Prime95 + GPU
- 9 - System: MSI Kombustor, OCCT
- 10 - System: Aida64, powerMAX, Heavy Load
- 11 - System: Leistungsaufnahme
- 12 - System: Temperaturen
- 13 - Zusammenfassung und Fazit







Kommentieren