


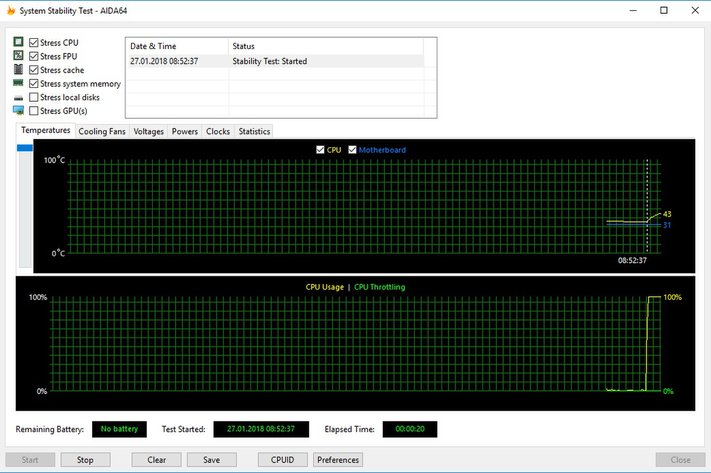
Aida64
The Aida64 CPU stress test offers several freely combinable options that could not be more different. After all, Aida64 also offers a real memory stress test and the maximum possible utilization of the cache, as well as a load test of the computing units without extensive memory usage. So you can do everything and nothing or colorfully diceed test. The 30-day trial version can be downloaded here. The time limit or the cost of use beyond this test period is certainly the only stumbling block.
After all, in addition to logging many sensor values into a self-configurable file, the software also offers graphical outputs of the monitoring in real time. This ranges from display as a curve to use in the taskbar or via interface in third-party programs.
CPU + FPU + Cache
Anyone who thinks that a lot helps a lot is wrong here. In contrast to the specialized tests for the individual sub-areas, all the loads generated when selecting all options together are at first glance only (upper) average. Nevertheless, it is actually very realistic, because it reflects a normal usage behavior with demanding standard applications very well and with the most likely.
| CPU Package (PECI) |
Core Average |
Sensor Socket |
Working Memory |
Cpu Watts |
System Watts |
|
|---|---|---|---|---|---|---|
| Reading |
78 °C | 80 °C | 79 °C | 32 °C | 128 W | 184 W |
| Compared to The Max. |
89.7 % | 93.0 % | 75.2 % | 88.9 % | 74.4 % | 73.0 % |
| Review | – high package temperature – rather low storage temperature – mean power consumption of CPU and overall system |
|||||
| Suitability | – Stability tests – Cooling tests for medium-strength performance |
|||||
Single test CPU
The values are at first quite moderately in the lower range of all tested programs. Aida64, however, dispenses with the extensive utilization via AVX and SSE as well as the utilization of cache and memory. This brings you close to the maximum loads of older programs that do not rely on current command set extensions, but does not reach too high temperatures. If you want to test older computer systems, or if you want to slowly test your performance against the limit values, you can start with this test.
| CPU Package (PECI) |
Core Average |
Sensor Socket |
Working Memory |
Cpu Watts |
System Watts |
|
|---|---|---|---|---|---|---|
| Reading |
56 °C | 56 °C | 70 °C | 26 °C | 84 W | 123 W |
| Compared to The Max. |
64.4 % | 65.1 % | 66.7 % | 72.2 % | 48.8 % | 48.8 % |
| Review | – very low package temperature – very low storage temperature – low power consumption of CPU and overall system |
|||||
| Suitability | – Stability tests for mini PCs and older hardware | |||||
Single test FPU
The extreme and rather one-sided utilization of the computing cores leads not only to very high package and base temperatures but also to the highest measured core temperatures of all test runs. This makes this option primarily suitable for performance testing of potent cooling systems in the boundary range. If something throttles, it's here.
| CPU Package (PECI) |
Core Average |
Sensor Socket |
Working Memory |
Cpu Watts |
System Watts |
|
|---|---|---|---|---|---|---|
| Reading |
85 °C | 86 °C |
98 °C | 26 °C | 156 W | 225 W |
| Compared to The Max. |
97.7 % | 100% |
93.3 % | 72.2 % | 90.7 % | 89.3 % |
| Review | – very high package temperature – very low storage temperature – high power consumption of CPU and overall system |
|||||
| Suitability | – Cooling tests for performance coolers | |||||
Single test cache
The larger the usable cache of a CPU (also in area). Memory is also slightly more heavily loaded, so this test is good for longer runs on overclocked systems when it comes to stability, not maximum cooling performance.
| CPU Package (PECI) |
Core Average |
Sensor Socket |
Working Memory |
Cpu Watts |
System Watts |
|
|---|---|---|---|---|---|---|
| Reading |
69 °C | 67 °C | 79 °C | 33 °C | 114 W | 171 W |
| Compared to The Max. |
79.3 % | 77.9 % | 75.2 % | 91.7 % | 66.3 % | 67.9 % |
| Review | – medium-high package temperature – rather higher storage temperature – mean power consumption of CPU and overall system |
|||||
| Suitability | – Stability tests for overclocked systems | |||||
Single Test System Memory
In this run, we achieve the highest memory load we have ever seen in these stress tests. This ranges from the power consumption of the RAM modules to the measured temperature of the warmest module. This test is very suitable as a single test for memory stability or as a selectable supplement to the other stress test options.
| CPU Package (PECI) |
Core Average |
Sensor Socket |
Working Memory |
Cpu Watts |
System Watts |
|
|---|---|---|---|---|---|---|
| Reading |
48 °C | 52 °C | 47 °C | 36 °C |
75 W | 116 W |
| Compared to The Max. |
55.2 % | 49.5 % | 54.7 % | 100% |
43.6 % | 46.0 % |
| Review | – very low package temperature – highest measured storage temperature – very low power consumption of CPU and overall system |
|||||
| Suitability | – Stability tests for memory | |||||
- 1 - Einführung und Testsystem
- 2 - Prime95 mit AVX oder SSE
- 3 - OCCT mit vier Varianten
- 4 - Aida64: FPU vs. Cache vs. Memory
- 5 - powerMAX, Heavy Load
- 6 - CPU Only: Leistungsaufnahme
- 7 - CPU Only: Temperaturen
- 8 - System: Prime95 + GPU
- 9 - System: MSI Kombustor, OCCT
- 10 - System: Aida64, powerMAX, Heavy Load
- 11 - System: Leistungsaufnahme
- 12 - System: Temperaturen
- 13 - Zusammenfassung und Fazit


Kommentieren