


Why do we need stability and stress tests?
This time we want to question how we can optimally test the stability and, of course, the cooling of our CPU. Not only too high clock rates or too low voltages can ultimately make the system unstable, because even too high temperatures can negatively affect stability and performance. But how do you stress a system in a convenient and as safe way as possible, and which programs do you need for it?
Until now, we had already focused on the graphics cards as a single component, this time it is about the CPU as such on the one hand and the overall system on the other, because in the end you will want to share all the components. But there are smaller hurdles, too, which apply to most of them at first.
- Part 1: Test graphics cards correctly (click here
) - Part 2: CPU stability test and stress tests of the overall system (this test)
Important note for all stress tests
We have to inform our readers before starting our own tests that the test programs presented here can not only partially take full advantage of the processors and graphics cards, but that in some cases even the tests set by the manufacturer can be used completely. power limits. The use of such so-called "power viruses" and "stress tests" is therefore not safe and certainly not in continuous use.
Those who wish to use such programmes on their own responsibility and at their own risk must at the same time ensure that, in the course of the process, they have all the relevant parameters up to the temperatures in question with appropriate and, above all, appropriate Programs continuously and completely monitored, in order to be able to intervene in a secure manner if necessary and to be able to abort the tests immediately!
Choosing the right monitoring programs
We had already written in great detail about the appropriate tools for the graphics card individual tests in the first part and linked them. However, we need other tools to monitor the CPU and the overall system, which can give us all the relevant data, and not just the graphics card values.
The tool "HWiNFO64" is suitable for similar programs and can be downloaded here for free. There is actually nothing that cannot be read out and even written to a file in real time, but the sensor loop is also correspondingly sluggish due to the many values to be read out. Even intervals of one second often lag behind the timestamp.
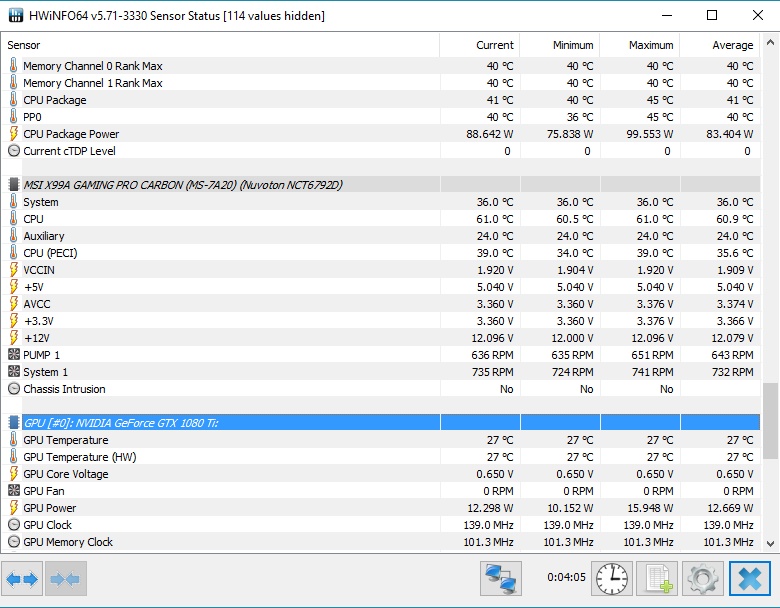
Therefore, we strongly recommend that you not only hide the information not needed in the respective test (network, system, data carrier, etc.) for better clarity, but also to exclude it from the loop altogether. With such a slimmed-down selection, it works exactly and true to time even in the 500ms interval. Nevertheless, a second should be completely sufficient.
Choosing the appropriate CPU
We deliberately do without our normally used X299 and X99 systems and instead use an Intel Core i7-8700 on a normal Z370 motherboard with 16 GB of memory, which we run as DDR4 3200. This brings us much closer to the currently most likely newly purchased systems, especially since some sensors are not available at all or only less frequently on the consumer platforms.
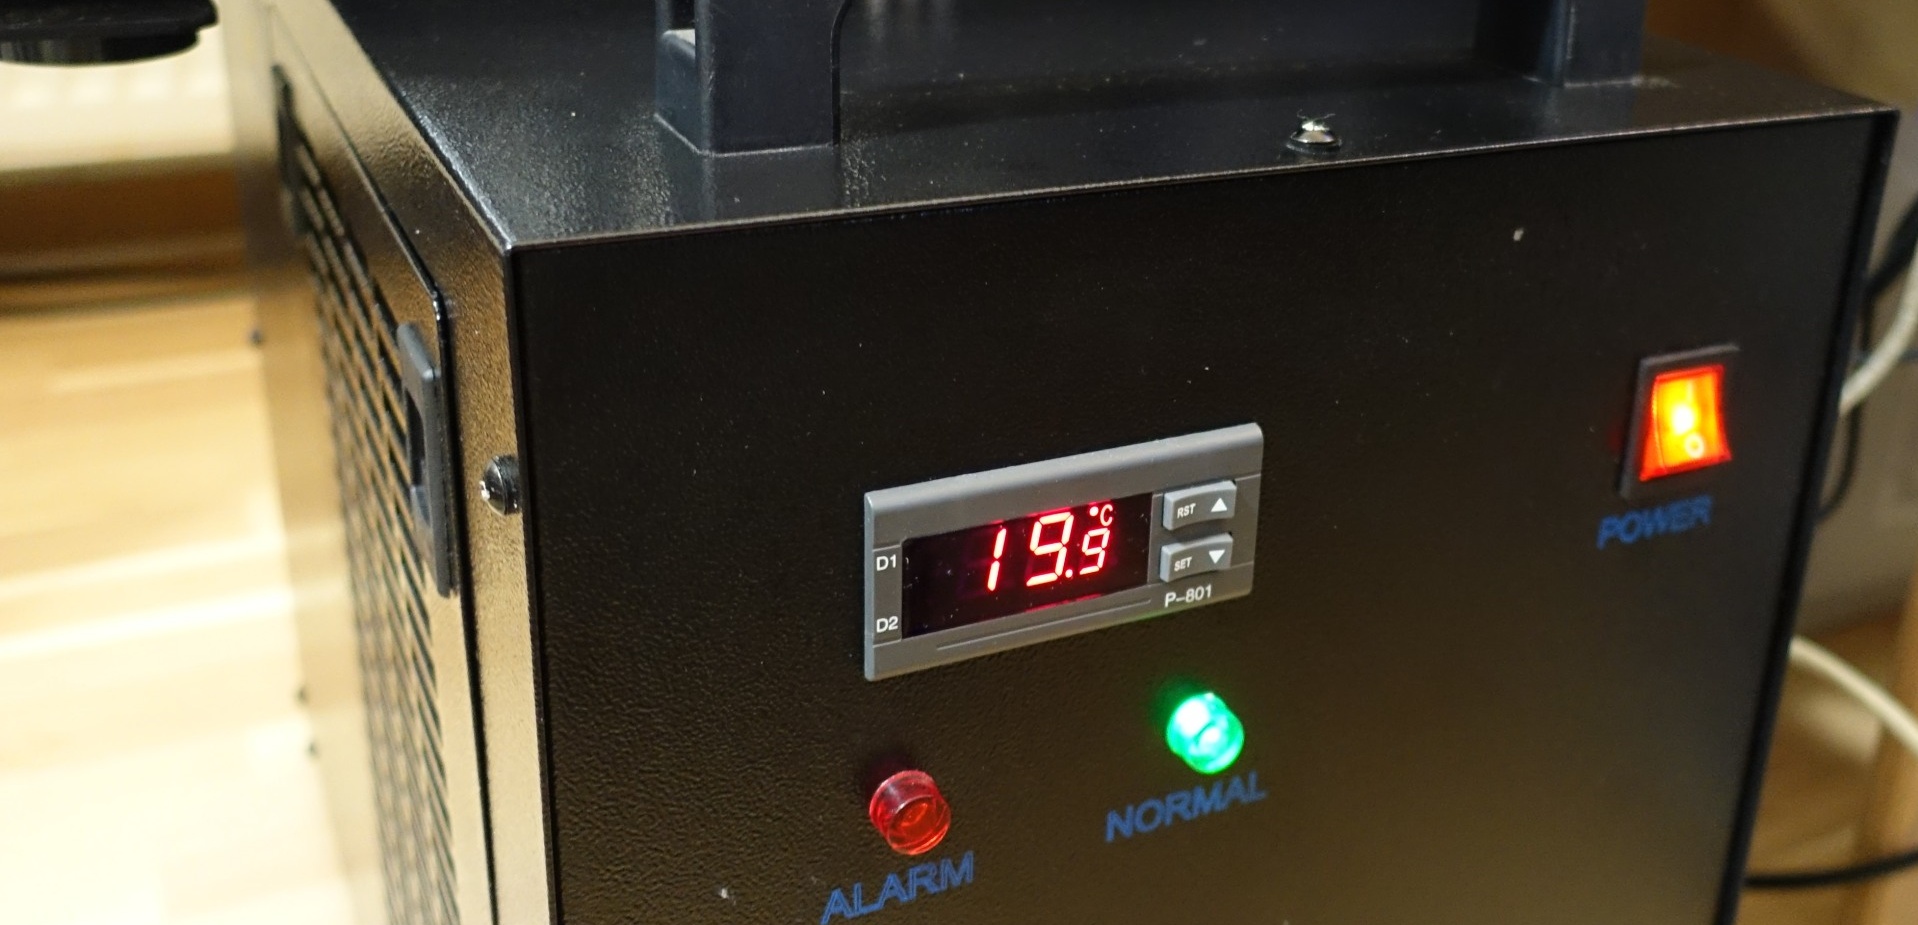
But our Alphacool Ice Age 2000 Chiller is again part of the game, which ensures exactly 20°C water temperature and thus makes this test and the comparability of the temperatures of the individual stress programs with each other possible.
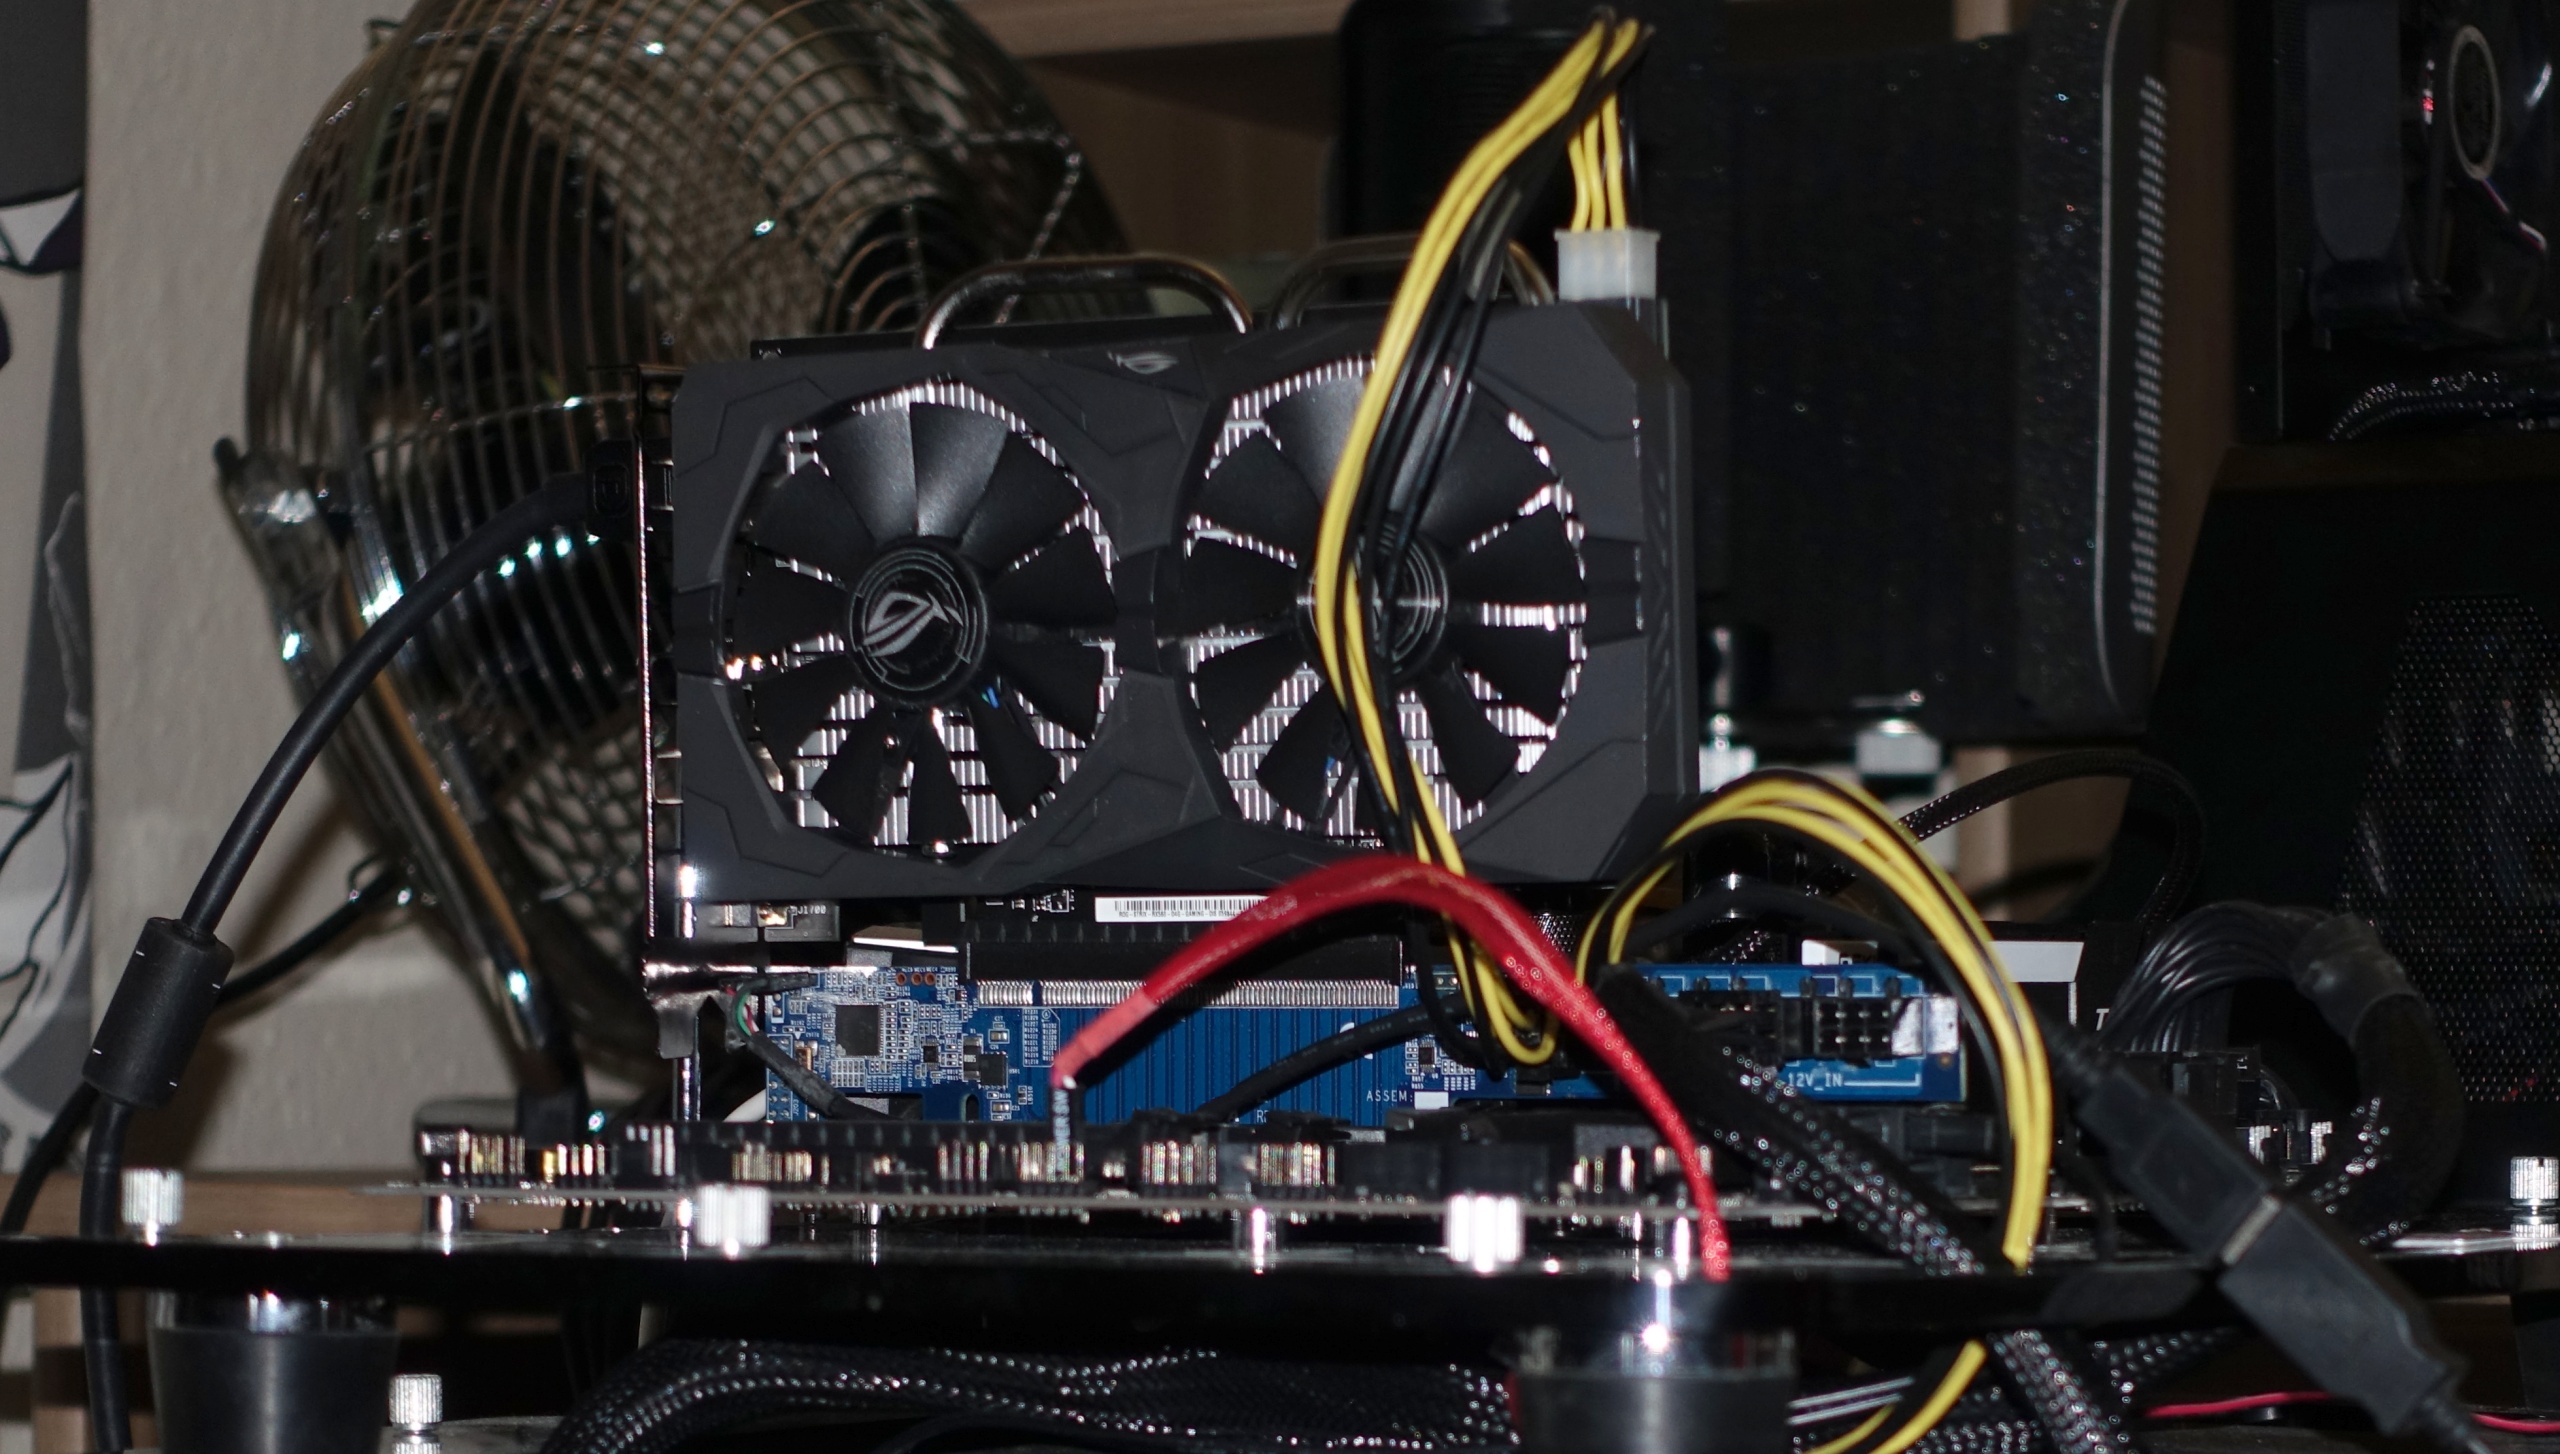
The graphics card is the same as the Asus RX 560 Strix OC as from the first part, so that the tests also harmonize in terms of content and remain comparable. Faster graphics cards do not change the core messages and only ensure that the overall power consumption increases proportionally. However, this does not change the CPU load in our tests of the overall system.
Test system and measurement methods
The new test system and the methodology have already been described in great detail in the basic article "How We Test Graphics Cards" (English: "How We Test Graphics Cards") and therefore, for the sake of simplicity, we now only refer to this detailed Description. So if you want to read everything again, you are welcome to do so. However, we have adjusted the substructure including CPU and cooling for this article once again.
If you are interested, the summary in table form quickly provides a brief overview:
| Test systems and measuring rooms | |
|---|---|
| Hardware: |
Intel Core i7-8700 MSI Z370 Gaming Pro Carbon AC 2x 8GB G.Skill TridentZ DDR4 3600 1x 1050 GB Crucial MX300 Be Quiet Dark Power Pro 11, 850-watt power supply |
| Cooling: |
Alphacool Ice Block XPX Alphacool Ice Age 2000 Chiller Thermal Grizzly Kryonaut (for cooler change) |
| Housing: |
Microcool Banchetto 101 |
| Graphics card: | Asus RX 560 Strix OC |
| Monitor: | Eizo EV3237-BK |
| Power consumption: |
non-contact DC measurement on the PCIe slot (Riser-Card) non-contact DC measurement on the external PCIe power supply Direct voltage measurement on the respective feeders and on the power supply 2x Rohde & Schwarz HMO 3054, 500 MHz multi-channel oscillograph with memory function 4x Rohde & Schwarz HZO50, current togor adapter (1 mA to 30 A, 100 KHz, DC) 4x Rohde & Schwarz HZ355, touch divider (10:1, 500 MHz) 1x Rohde & Schwarz HMC 8012, digital multimeter with storage function |
| Thermography: |
Optris PI640, infrared camera PI Connect evaluation software with profiles |
| Operating system | Windows 10 Pro (1709, all updates) |
- 1 - Einführung und Testsystem
- 2 - Prime95 mit AVX oder SSE
- 3 - OCCT mit vier Varianten
- 4 - Aida64: FPU vs. Cache vs. Memory
- 5 - powerMAX, Heavy Load
- 6 - CPU Only: Leistungsaufnahme
- 7 - CPU Only: Temperaturen
- 8 - System: Prime95 + GPU
- 9 - System: MSI Kombustor, OCCT
- 10 - System: Aida64, powerMAX, Heavy Load
- 11 - System: Leistungsaufnahme
- 12 - System: Temperaturen
- 13 - Zusammenfassung und Fazit


Kommentieren