Aida64 FPU + GPU
The problem with Aida is that while the built-in combined stress test summarizes individual areas that do not negatively affect each other's performance-technically negatively, the ratio of graphics and CPU load is also simply not correct and not realistic harmonized with each other. It is not even possible to generate loads as close to reality as possible. Only in sum could it still be applied, but, as has just been read, there are much better alternatives.
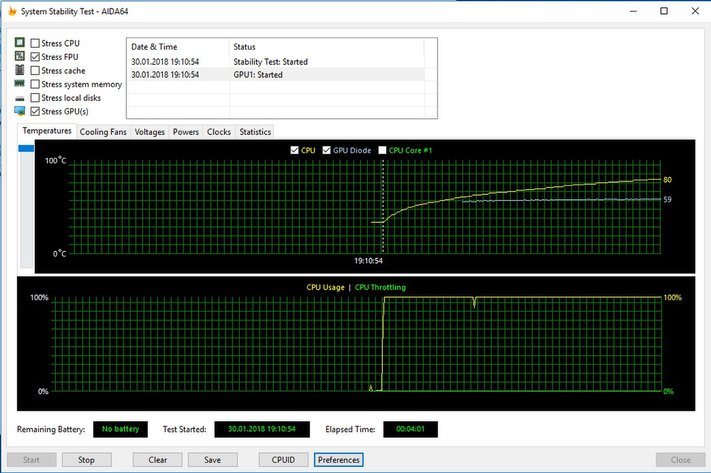
Because even if you were to throw together "Stress CPU", "Stress system memory" and "Stress GPU(s)", you would not get a really realistic image. No matter what you choose and combine, it doesn't get any better.
| CPU Package (PECI) |
Core Average |
Sensor Socket |
GPU Diode |
Cpu Watts |
Gpu Watts |
System Watts |
|
|---|---|---|---|---|---|---|---|
| Reading |
84 °C | 83 °C | 96 °C | 61 °C | 150 W |
86 W | 307 W |
| Compared to The Max. |
98.8 % | 97.6 % | 92.3 % | 95.3 % | 88.8 % |
85.1% | 86.0 % |
| Review | – high package temperature – very high base temperature – average storage temperature – GPU power consumption below game level – CPU power consumption well above game level |
||||||
| Suitability | – Rather unsuitable as a combined test | ||||||
powerMAX with AVX or SSE and GPU
With pure GPU stress, powerMAX wasn't in the absolute top spot, but maybe the CPU test is appropriate? Again, we test both variants to find out the best suitability. We start the GPU stress tester in windowed mode so as not to push the GPU test too much into the background. We also make sure that the focus is on the window of the graphics stress test.
 AVX + GPU
This combination is almost the same as what we have already written about Aida64. Far too high CPU load, combined with a slightly too low graphics load. So this doesn't really harmonize – but it's beautifully simple and what very comfortable. Nevertheless, neither the absolute maximum nor the normal operation can be explored really well.
| CPU Package (PECI) |
Core Average |
Sensor Socket |
GPU Diode |
Cpu Watts |
Gpu Watts |
System Watts |
|
|---|---|---|---|---|---|---|---|
| Reading |
79 °C | 79 °C | 98 °C | 62 °C | 156 W |
89 W | 313 W |
| Compared to The Max. |
92.9 % | 92.9 % | 94.2 % | 96.9 % | 92.3 % |
88.1% | 87.0 % |
| Review | – rather high package and core temperature – very high base temperature – rather low storage temperature – GPU power consumption below game level – CPU power consumption well above game level |
||||||
| Suitability | – Rather unsuitable as a combined test | ||||||
SSE + GPU
With the SSE code path, if we reduce the CPU load a little bit, the ratio also shifts a little more towards the graphics. Nevertheless, this is not enough to simulate a game operation. Again, it is not enough to explore the maximum. So it also applies to what we just wrote for the AVX code path.
| CPU Package (PECI) |
Core Average |
Sensor Socket |
GPU Diode |
Cpu Watts |
Gpu Watts |
System Watts |
|
|---|---|---|---|---|---|---|---|
| Reading |
69 °C | 68 °C | 82°C | 62 °C | 130 W |
90 W | 280 W |
| Compared to The Max. |
81.2 % | 80 % | 78.8 % | 96.9 % | 76.9 % |
89.1% | 78.4 % |
| Review | – slightly lower package and core temperature – average base temperature – rather low storage temperature – GPU power consumption below game level – CPU power consumption well above game level |
||||||
| Suitability | – Rather unsuitable as a combined test | ||||||
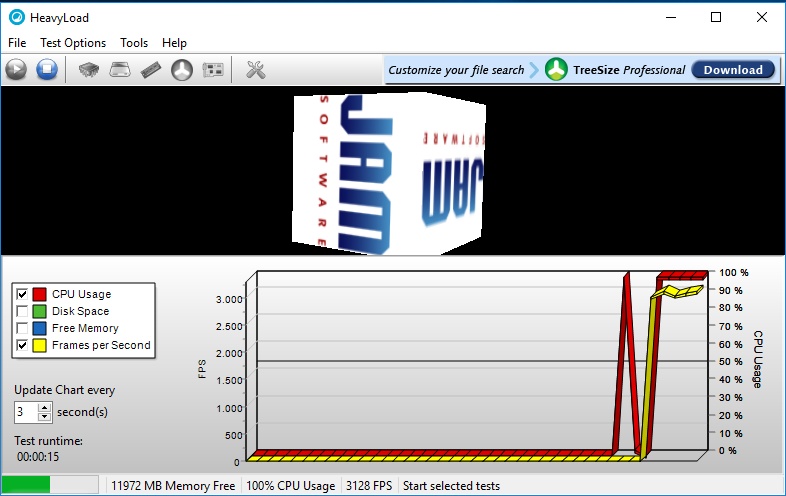
Heavy Load CPU and GPU
The program could not pull us off the stool during the CPU and GPU single test and in total as a combined test the score is "deficient" twice, quickly the grade "deficient". This combination is not to be used as a stress test or as a stability test in any form, unless Kevin-Justin wants to get intoxicated by the highest possible clock counts during overclocking, which is guaranteed to cause no errors in this program.
| CPU Package (PECI) |
Core Average |
Sensor Socket |
GPU Diode |
Cpu Watts |
Gpu Watts |
System Watts |
|
|---|---|---|---|---|---|---|---|
| Reading |
58 °C | 57 °C | 59 °C | 49 °C | 100 W |
34 W | 186 W |
| Compared to The Max. |
68.2 % | 67.1 % | 56.7 % | 76.6 % | 59.2 % |
33.7% | 52.1 % |
| Review | – very low package and core temperature – low base temperature – low storage temperature – Very low power consumption of the GPU |
||||||
| Suitability | – Completely unsuitable as a combined test | ||||||
- 1 - Einführung und Testsystem
- 2 - Prime95 mit AVX oder SSE
- 3 - OCCT mit vier Varianten
- 4 - Aida64: FPU vs. Cache vs. Memory
- 5 - powerMAX, Heavy Load
- 6 - CPU Only: Leistungsaufnahme
- 7 - CPU Only: Temperaturen
- 8 - System: Prime95 + GPU
- 9 - System: MSI Kombustor, OCCT
- 10 - System: Aida64, powerMAX, Heavy Load
- 11 - System: Leistungsaufnahme
- 12 - System: Temperaturen
- 13 - Zusammenfassung und Fazit











Kommentieren