


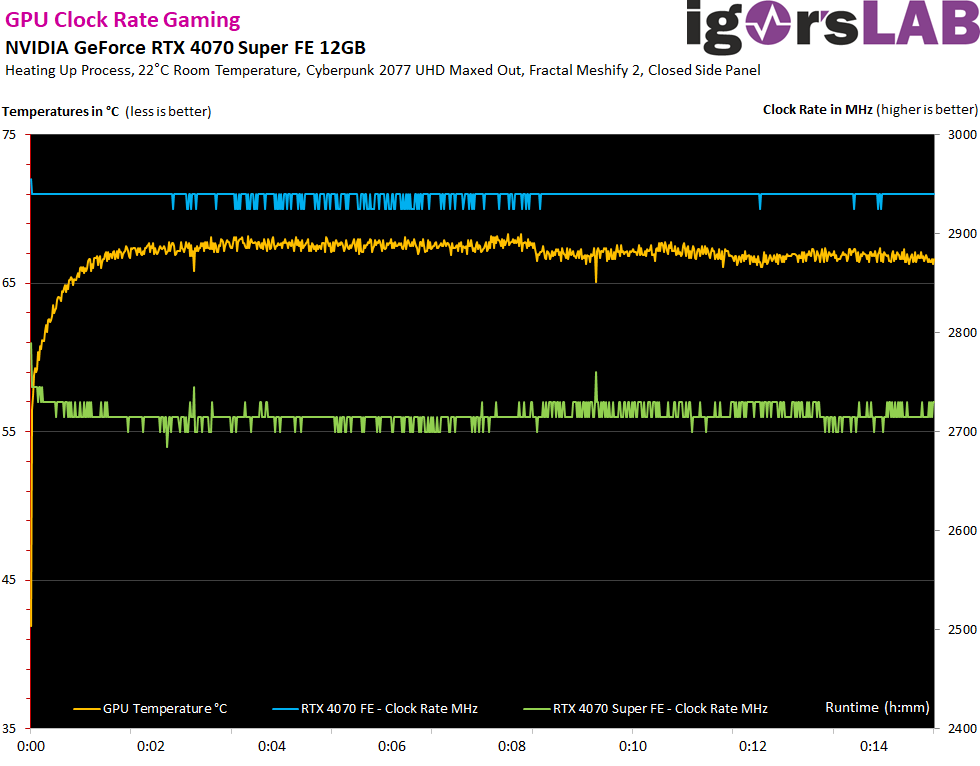
Real achievable clock rates and overclocking
This time, the clock rates and readout are simple. While the GPU clock of the Super card is 2775 MHz when cold, it levels off more or less permanently at 2730 MHz after it has warmed up completely, three boost steps lower. You can leave that alone. With manual OC and maxing out the TBP limit of 220 watts, it went up to just under 3 GHz (blue curve), but the card then became somewhat unstable. With the RTX 4070 Super FE, “only” up to 2730 MHz are possible, but there are significantly more computing units. Incidentally, the Super FE also exceeds the 2.8 GHz mark at 240 watts and even a little above that. But OC is still not an issue today.
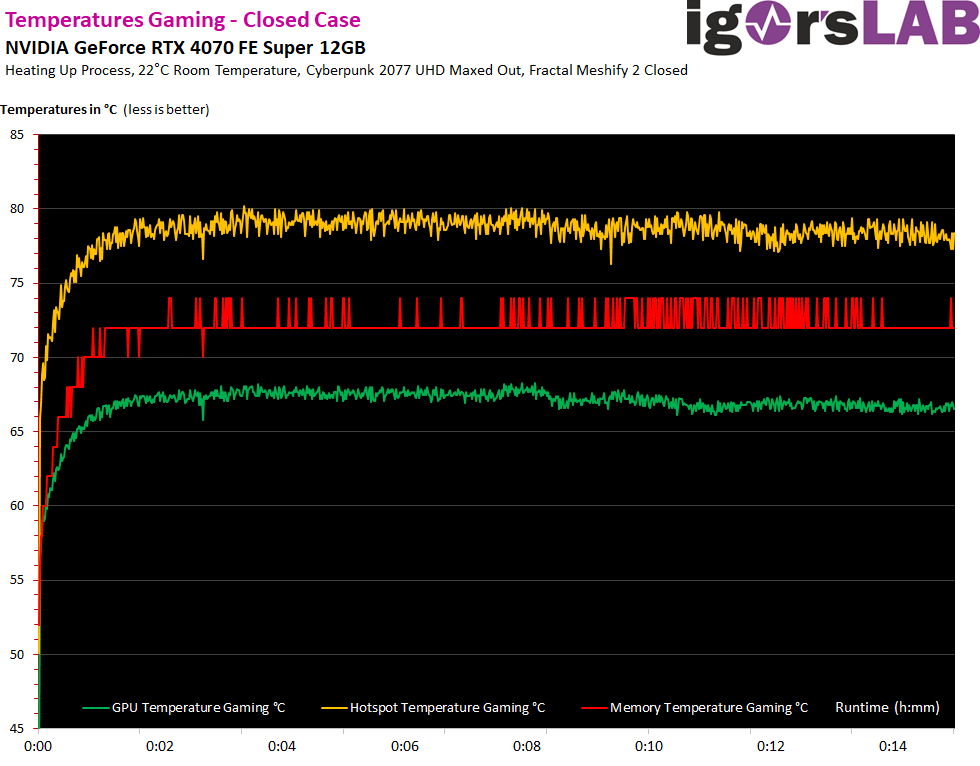
GPU temperatures in the housing
The differences are not as great as feared if you use a proper case. If you close the panel, the GPU temperature (edge) rises by around 2 Kelvin, while the GDC hotspot rises by up to 4 Kelvin. Nevertheless, the values of 67 °C (edge) and 80 °C (hotspot) are nothing to be alarmed about. With OC, the values rise to a good 71 °C or 84 °C (hotspot), which is just about right.
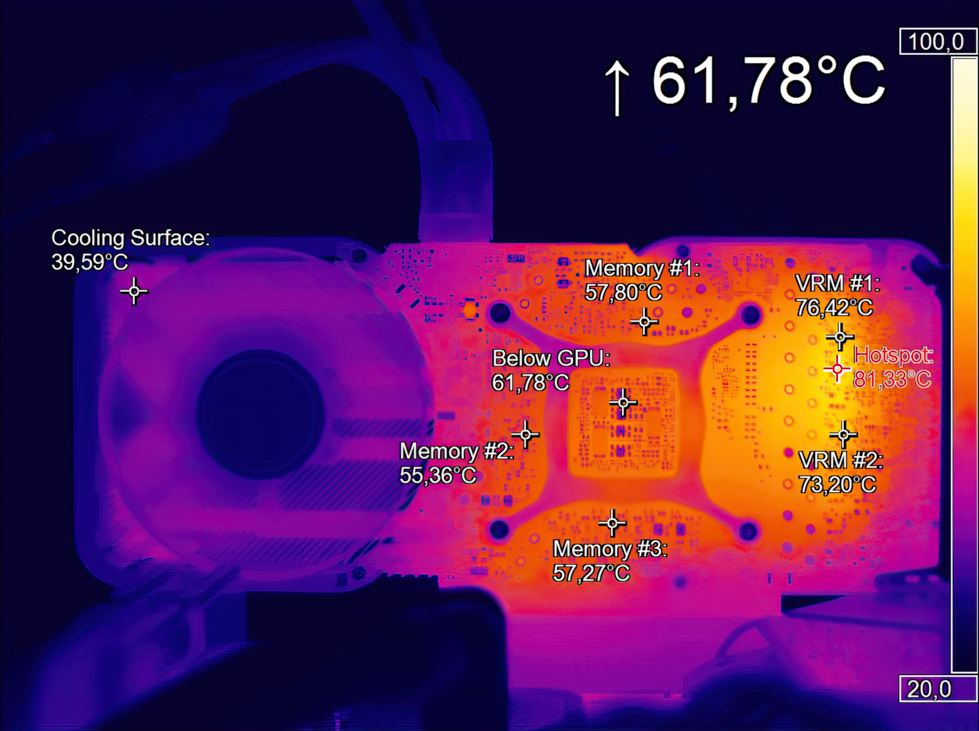
Infrared measurements (heat flow analysis)
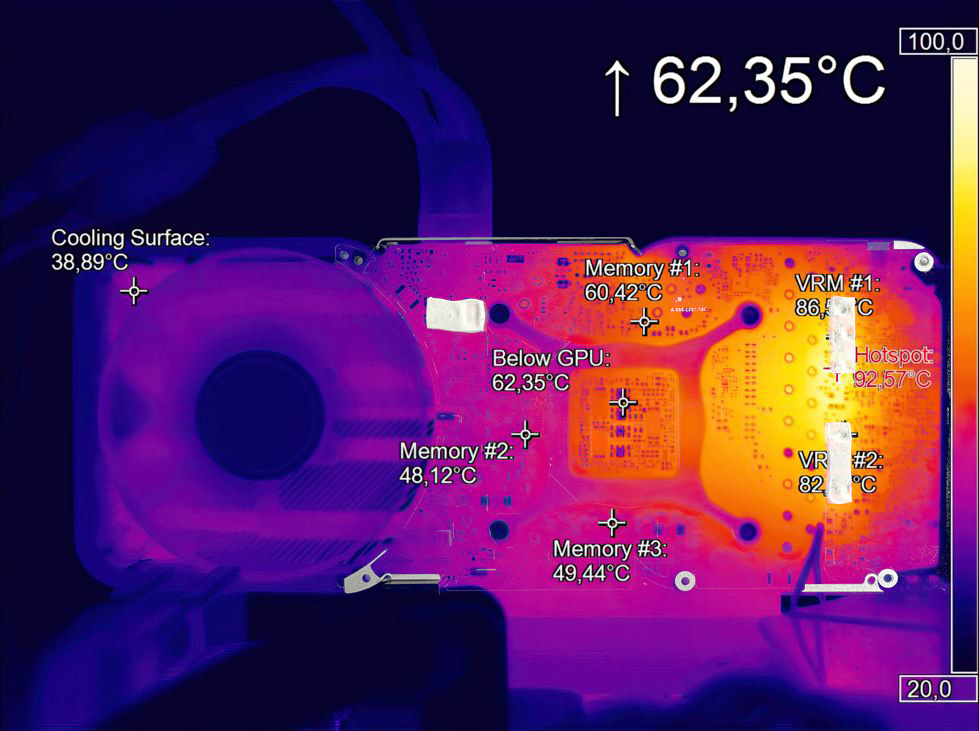
Let’s start with the gaming loop and we can see that the voltage converters get quite hot. The 7 puny phases are only 7 phases and we remember the teardown.
In the stress test, the temperatures of the voltage regulators continue to rise, but the same applies here. The cooling is anything but optimal at this point and you end up in the hotspot at almost 93 °C without a backplate.
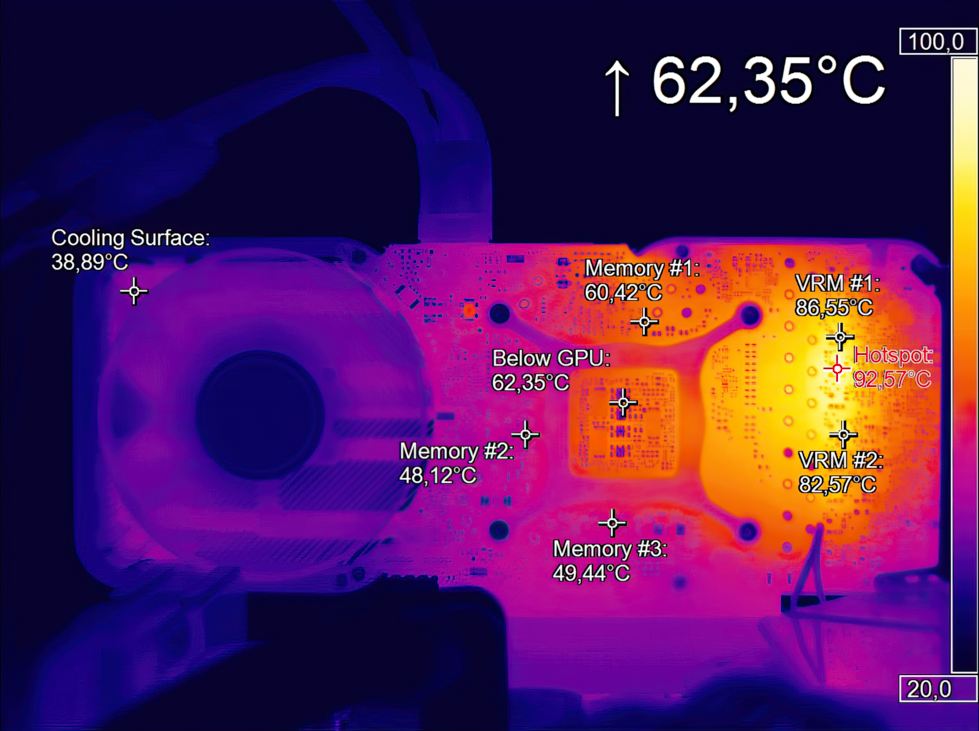
If you think the backplate will fix it, you’ve done the math without Foxconn as the manufacturer of the FE. The two pads on the backplate sit NEXT to the actual hotspot! This already annoyed me with the non-super, but with the 240 watts that are now possible, it’s even a bit critical because it’s getting towards 100 °C.
I treated the backplate to a matching bornitrite pad from my casket and use it to cool the hotspot much more precisely. You could also call it a direct increase in value. 🙂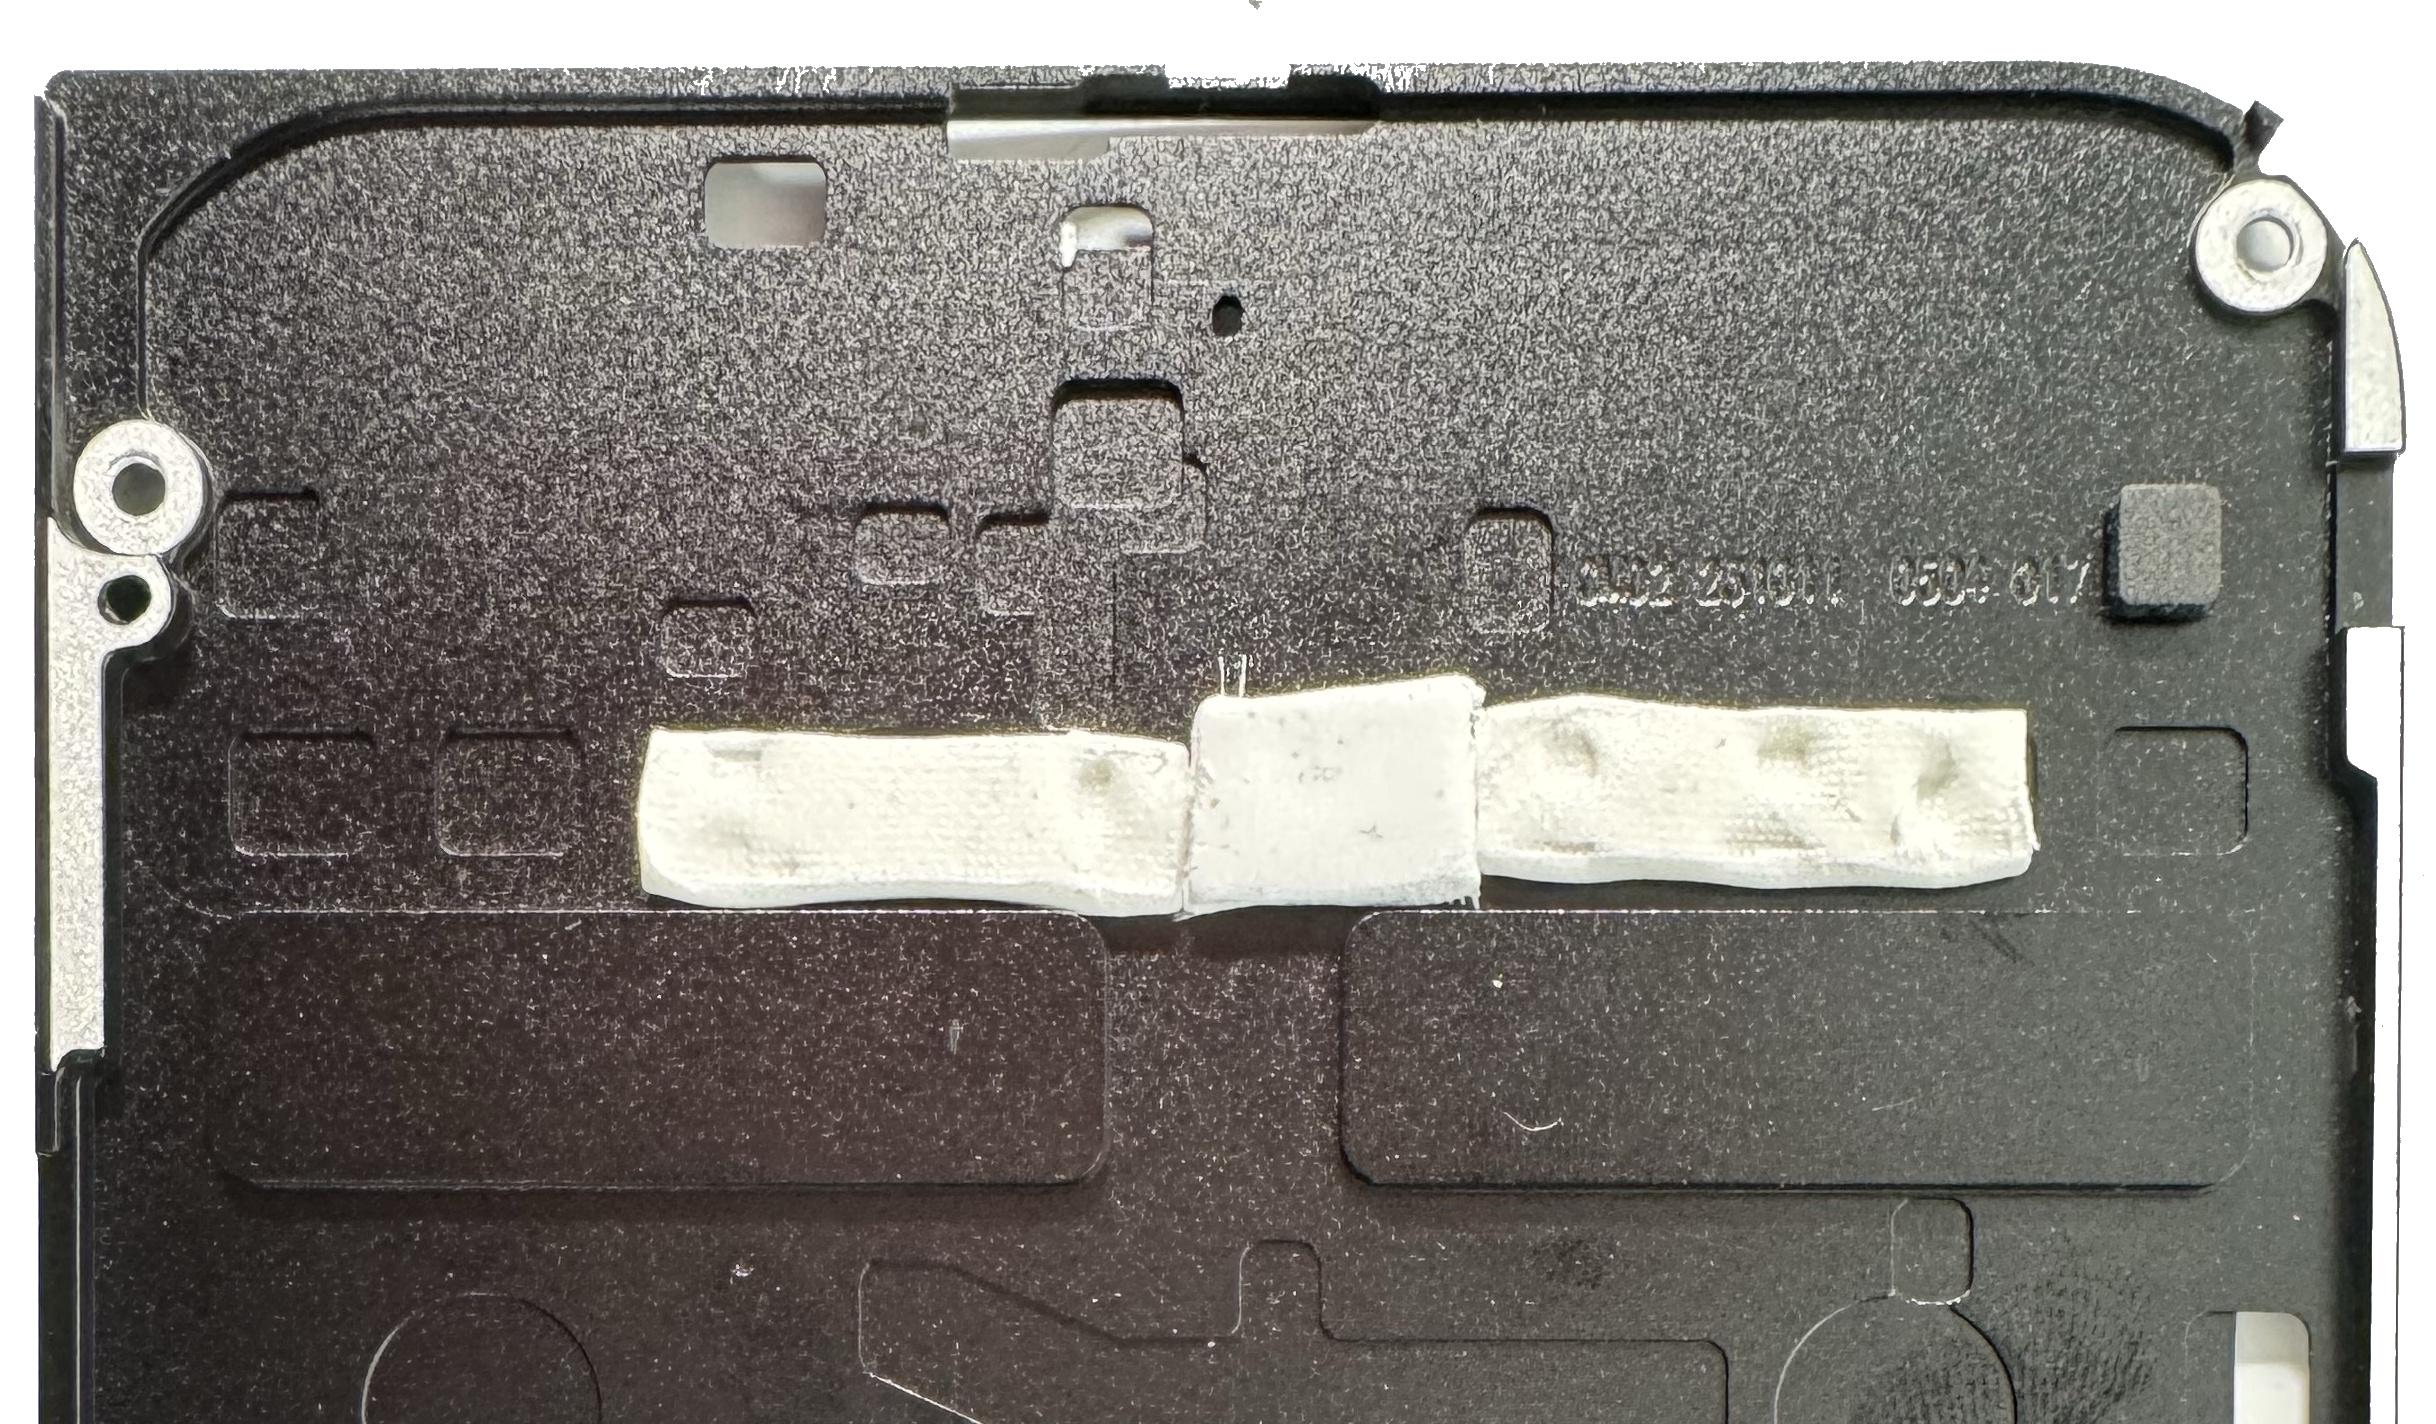

- 1 - Introduction, technical Data and Features
- 2 - Test System and Equipment
- 3 - Teardown: PCB, Components and Cooler
- 4 - Material Analysis and a Surprise
- 5 - Gaming Performance FHD (1920 x 1080)
- 6 - Gaming-Performance WQHD (2560 x 1440)
- 7 - Gaming Performance Ultra-HD (3840 x 2160)
- 8 - Gaming Performance DLSS vs. FSR
- 9 - Gaming Performance Frame Generation
- 10 - Latencies in Detail
- 11 - Workstation Graphics and Rendering
- 12 - Power Consumption and Load Balancing
- 13 - Transients and PSU Recommendation
- 14 - Temperatures, Clock Rate and Infrared Analysis
- 15 - Fan Curves and Noise
- 16 - Summary and Conclusion


61 Antworten
Kommentar
Lade neue Kommentare
Veteran
Veteran
Veteran
Veteran
1
Veteran
Urgestein
Urgestein
1
Mitglied
Veteran
1
Mitglied
Mitglied
Veteran
Urgestein
Veteran
Urgestein
Alle Kommentare lesen unter igor´sLAB Community →