


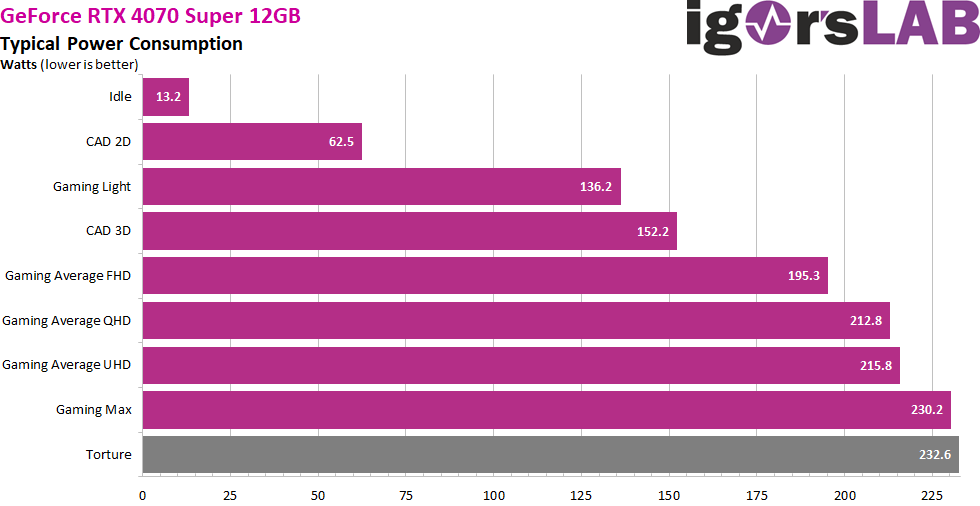
Power consumption in factory settings as a summary
The approx. 13 watts in idle mode (12 and 3.3 volts) are ok. With a second monitor and a different resolution, however, this quickly becomes 36 watts and more. Incidentally, we can see very clearly that the full TBP of 220 watts is rarely exhausted and only the torture loop or a single game even reaches the limit here. Normally, it is always less.
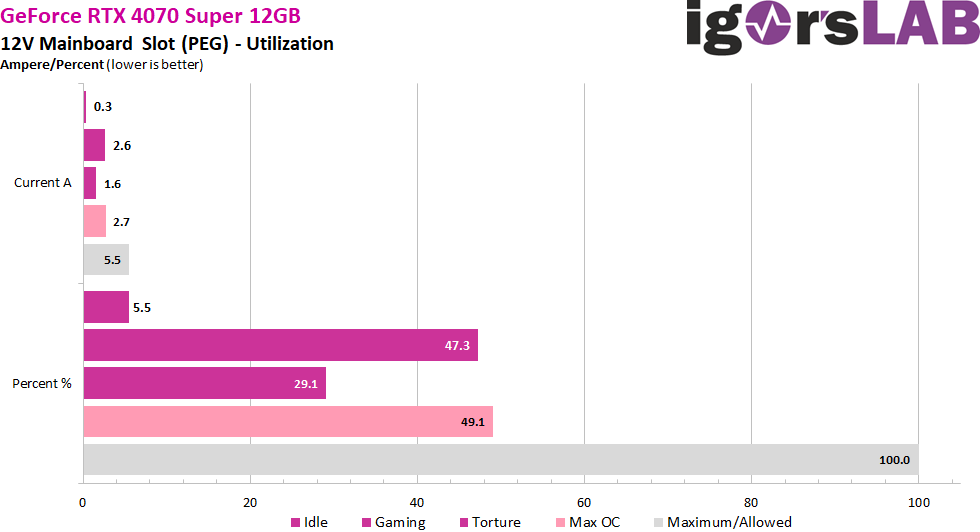
Load distribution between the PCIe slot and the PCIe sockets
NVIDIA uses the PCIe slot a little, especially for gaming. However, the flowing currents are still less than half of the maximum permitted 5.5 amps, even with the increased power limit.

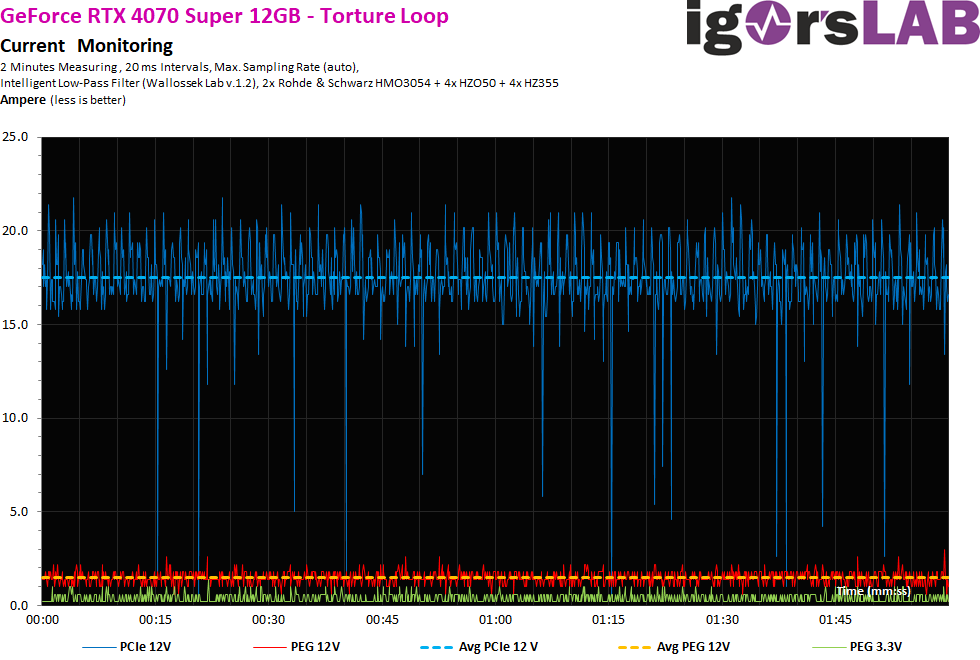
Rough 20 ms intervals
Let’s first take a look at the flowing currents. Measurements were taken at rough 20 ms intervals, i.e. around 50 times per second, in order to simulate the load on the supervisor chip of the power supply units (switch-off). We can see that even short load peaks are capped at 25 A at the latest, but a real limitation looks different. This is something that illustrates the control frenzy of Boost.
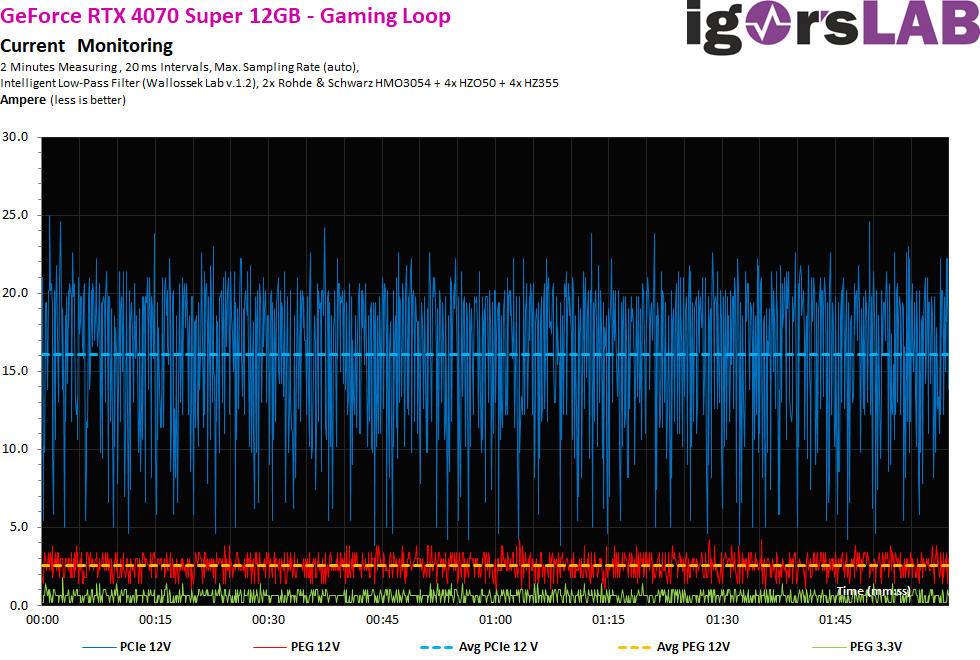
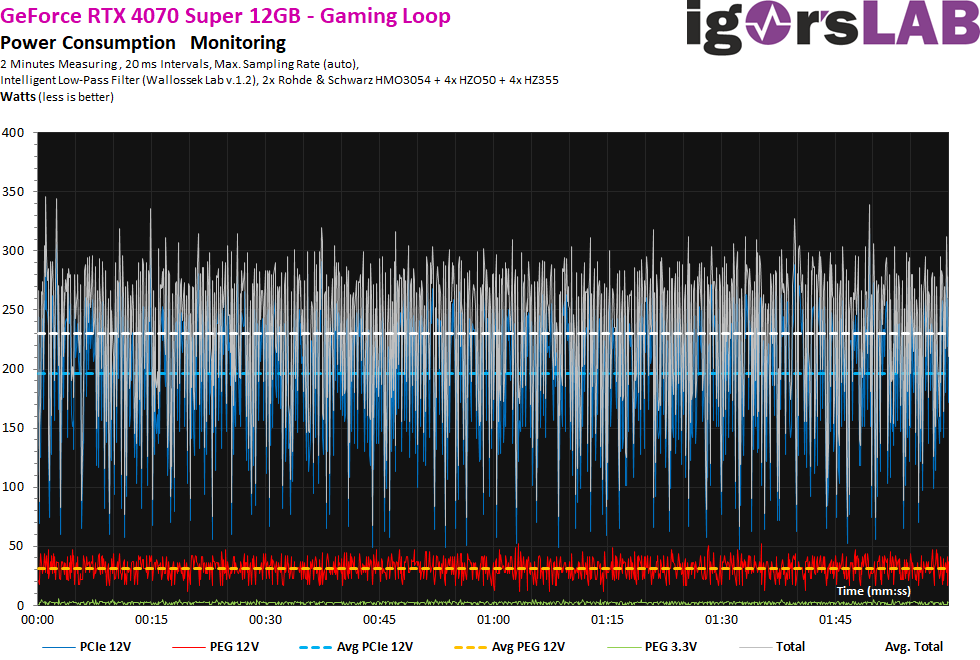
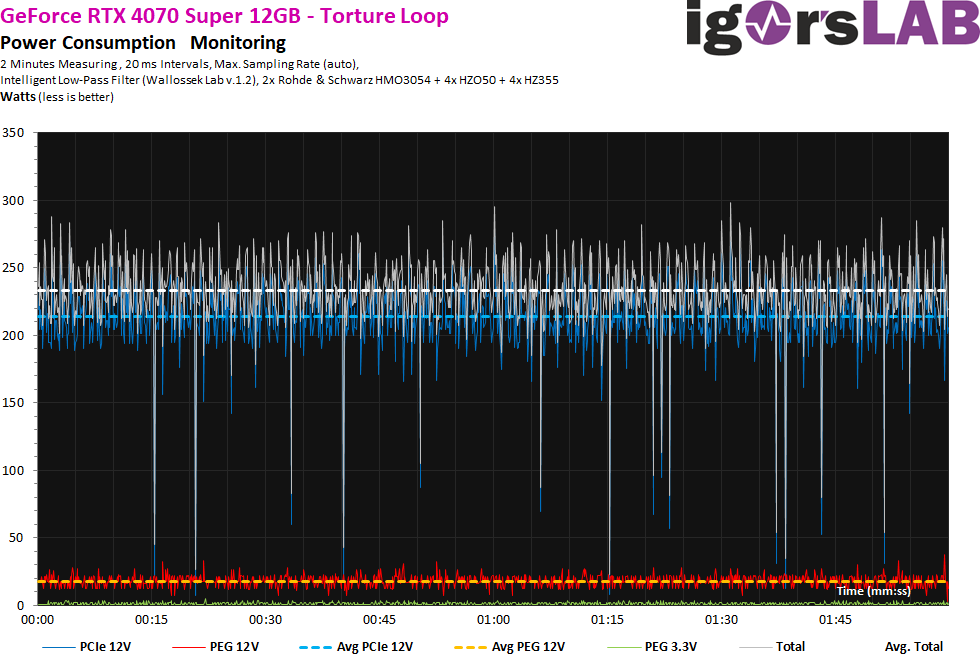
Nevertheless, we still need to take a look at the voltages, or the product of voltage and current flow. I’ve already written that I’ve measured different power supply connections here, even though all the connections meet again somehow on the graphics card board at the end. What we can now see here as much clearer fluctuations and peaks is due to the partially slightly overvoltage power supply and therefore to the voltage and not the currents. This is due to technical reasons, but is not a problem. However, we can also see that the few peaks at well over 300 watts are not caused by the flowing current (graphics card), but actually result from the power supply! This is also due to the topology and, above all, the rather puny input filter with only one coil on the individual rail.
The Torture test is hardly any different. The super variant now regulates somewhat more hectically.
If you now add the voltage again, you can see a stronger ripple, which in turn results from the somewhat jittery operating voltage. However, to the power supply’s credit, it must also be said that this affects all current products from all manufacturers and can hardly be avoided.

- 1 - Introduction, technical Data and Features
- 2 - Test System and Equipment
- 3 - Teardown: PCB, Components and Cooler
- 4 - Material Analysis and a Surprise
- 5 - Gaming Performance FHD (1920 x 1080)
- 6 - Gaming-Performance WQHD (2560 x 1440)
- 7 - Gaming Performance Ultra-HD (3840 x 2160)
- 8 - Gaming Performance DLSS vs. FSR
- 9 - Gaming Performance Frame Generation
- 10 - Latencies in Detail
- 11 - Workstation Graphics and Rendering
- 12 - Power Consumption and Load Balancing
- 13 - Transients and PSU Recommendation
- 14 - Temperatures, Clock Rate and Infrared Analysis
- 15 - Fan Curves and Noise
- 16 - Summary and Conclusion


61 Antworten
Kommentar
Lade neue Kommentare
Veteran
Veteran
Veteran
Veteran
1
Veteran
Urgestein
Urgestein
1
Mitglied
Veteran
1
Mitglied
Mitglied
Veteran
Urgestein
Veteran
Urgestein
Alle Kommentare lesen unter igor´sLAB Community →