


But now enough of the preliminary skirmish! Matching the binning of the K and KF CPUs, we were again able to test 30 CPUs, so that at least the data can be compared relative to the number of units. To collect truly representative data, we would of course need to test a 3- or 4-digit number of CPUs. The following comparison should therefore only be regarded as a rough estimate. First, however, there is the overview of the test system including the hardware used:
|
Test systems |
|
|---|---|
| Hardware: |
|
| Cooling: |
|
| Housing: |
|
| Periphery: |
|
| Measuring devices: |
|
To judge the quality of the cores, we again use the Silicon Prediction (SP) rating of our Asus Maximus Z690 Apex motherboard. How this works is explained in the previous article, which I link to you again here. I also use the data from this again for comparison in the following diagrams.
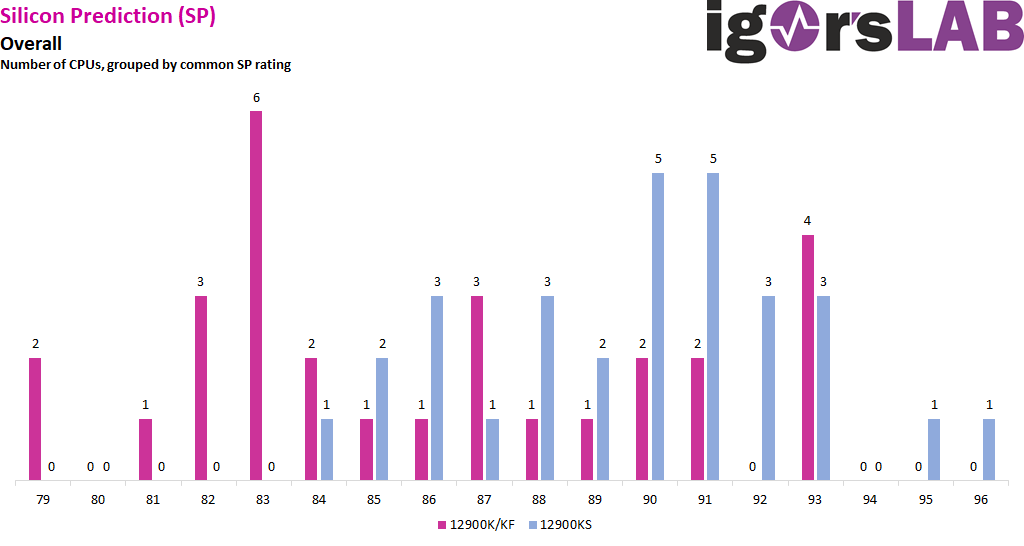
The KS CPUs have a slightly higher total SP value and the gradient increases and decreases a bit more evenly than in the previously tested K and KF CPUs. However, since the total SP is ultimately only made up of the SP values of P and E cores, a look at the individual data should also not be missing.
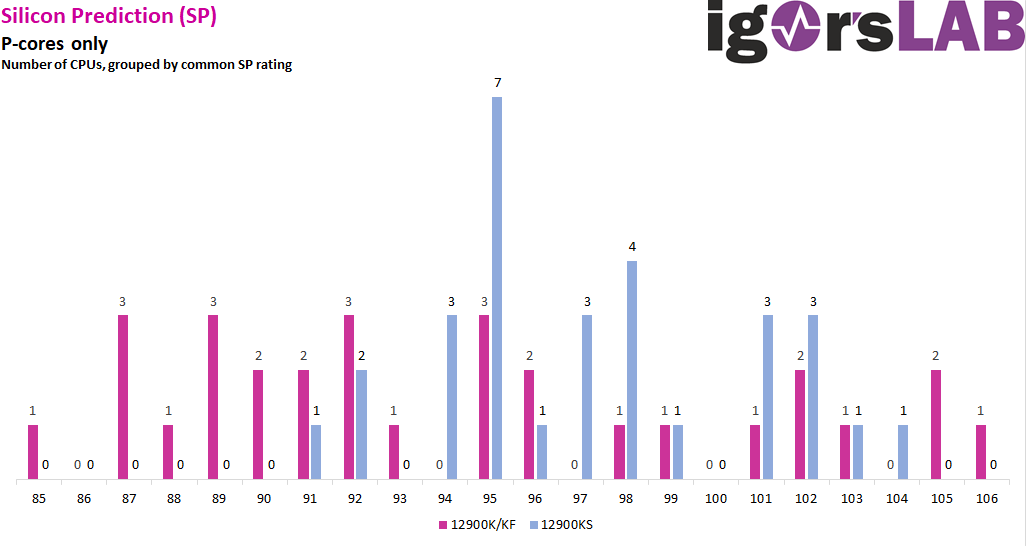
The KS CPUs are also only found in the right two thirds of the distribution diagram for the P-cores, with most CPUs having a P-core SP of 95. The K and KF CPUs are more spread out and have outliers on the left and right ends of the spectrum, so at least according to this metric, the top 3 CPUs are not “KS”.
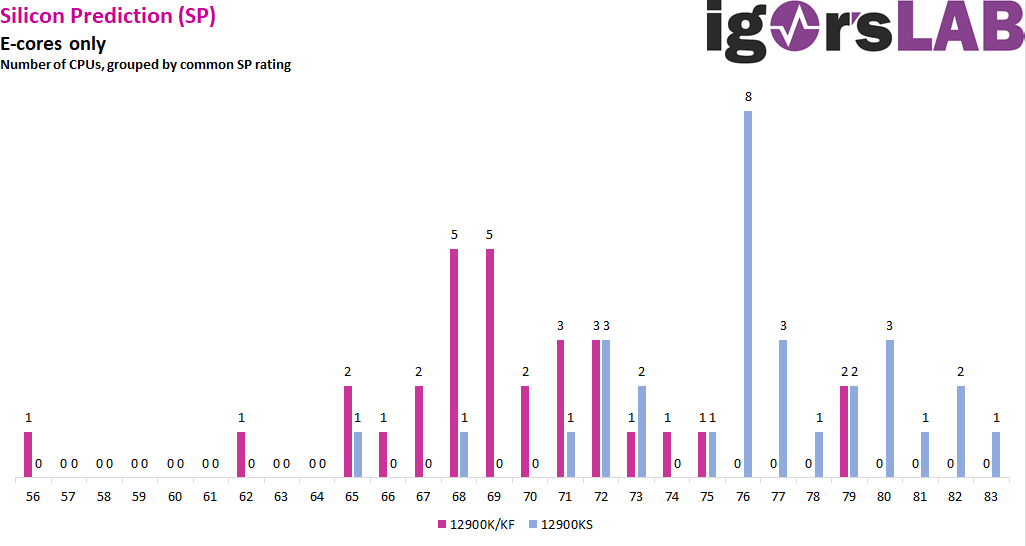
The improvement of the KS chips is even more obvious in the E-cores, so the E-cores may have the bigger share in the improvement of the total SP. The most common SP value here is 76, while for the K and KF chips it is equally distributed at 68 and 69.
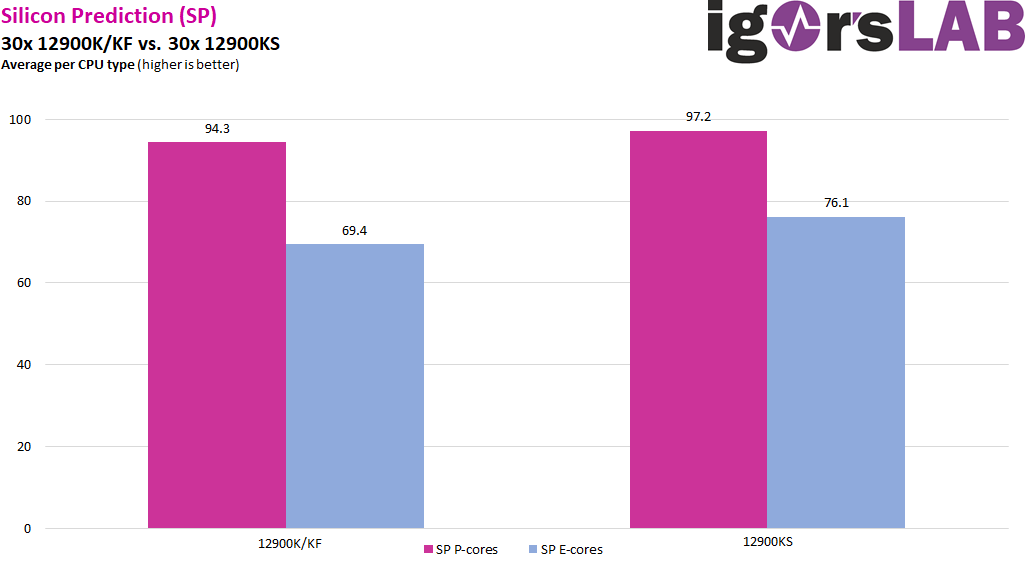
If we now look at the average SP value of P and E cores, we see an improvement of about 3 points for the P cores and almost 7 points for the E cores. However, the former is twice as important for the calculation of the total SP, so that the difference in the total SP is only 4 points, 85.7 for K/KF and 89.7 for KS. The higher silicon quality is already evident here, but this does not tell the whole story about the new KS CPUs by far – more about that on the next page.
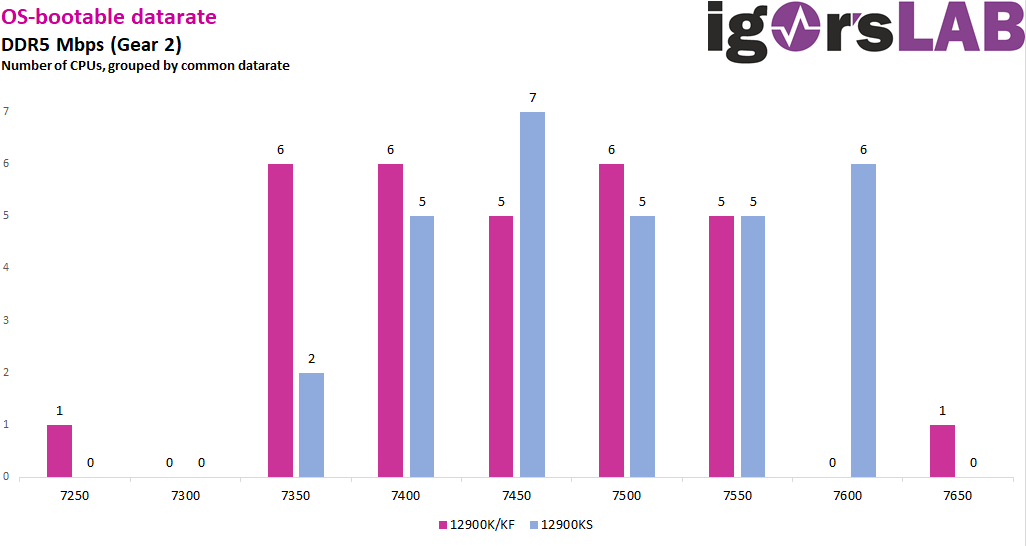
Now I would like to show you the tested DDR5 clock rates that the memory controllers can boot into Windows. Here, the distribution is analogous to the overall SP, with the KS chips having fewer outliers up and down and thus being able to exhibit more consistent quality overall. After all, the second-most possible clock rate is also the second-highest with 7600 Mbps. Overall, the KS chips also show a slight improvement compared to the K and KF CPUs. However, we cannot say definitively whether this is due to the selection for the KS SKU or general improvements in production since the launch of the Alder Lake CPUs.


51 Antworten
Kommentar
Lade neue Kommentare
Urgestein
Mitglied
Mitglied
Urgestein
Urgestein
Urgestein
Urgestein
Urgestein
Urgestein
Urgestein
Urgestein
Urgestein
Mitglied
Urgestein
Mitglied
Urgestein
Mitglied
Alle Kommentare lesen unter igor´sLAB Community →