


Important preliminary remarks
We have not known since today that the processors are subject to very large variations in quality during production. This time, however, our test samples are not directly from Intel, but are normal retail CPUs, as you can buy them as a normal customer in-store. Pre-selection by the manufacturer must therefore be ruled out.
In this context, however, we had to note that our copy of the Core i7-7700K in the German laboratory is a rather poor qualitative sample and we were therefore clearly unlucky.
To be clear, this definitely has no effect on the benchmark results, but on power consumption, cooling and possible overclockability of the processors.
Therefore, after the execution of each of the four tested CPUs, we have added a page that deals specifically with serial scattering. To do this, we were able to use a test pattern for comparison, which Intel's PR could provide us with at short notice, albeit far too late. But more on that later.
The Core i7-7700K
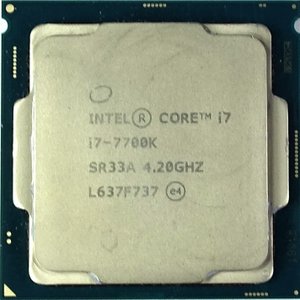
The CPU has an open multiplier and also a significantly higher base clock than the non-K models. Of course, this also opens up enough space for your own manual overclocking attempts.
If the factory-defined base clock is 4.2 GHz, the CPU manages to operate all cores with 4.5 GHz Turbo Core, even under extreme loads.
Let's take a look at how this CPU behaves under different loads. As already written, it's a kind of extreme case – but it also shows what you can expect if you're unlucky when you buy.
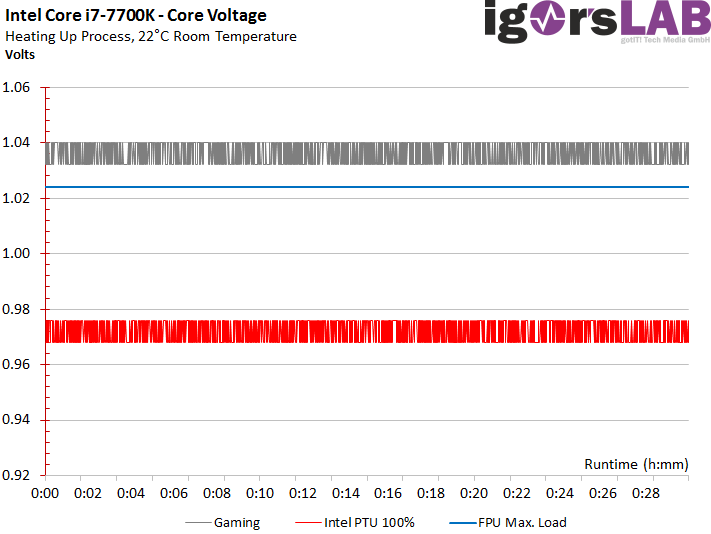
Core Voltages (Vcore)
Let us first turn to the actual adjacent core voltage (Vcore), which should not be confused with the given VID or what, for example, Dynamically display GPU-Z or CoreTemp as VID or Voltage.
Our sensor value is supplied by the motherboard and shows the voltage as it is applied to the test object after the voltage converters.
Since the loads change dynamically and quickly with gaming (grey curve), this works quite well with the voltage adjustment, because it is only controlled down when the loads increase more strongly. This can also be seen in the blue curve, for which we had a constant computational load.
In order to protect the CPU from excessive loss lines, the motherboard adjusts the voltage depending on the load, but keeps the voltage at a constant level almost all the time.
During the run with a really extreme stress test, which we will discuss in a time, the CPU is switched again properly, because the CPU already reached thermal limits despite compact water cooling, in which it rotted down for safety reasons.
Normal Load: Gaming
We determine the gaming load with a special savegame from Watchdogs 2. For reasons of reproducibility, the game person stands at a very busy highway in the city center, where the permanent traffic and many NPCs create a relatively high CPU load.
This load represents the average over the time of 30 minutes, because we were able to determine over a longer, real gaming session with very different challenges to the CPU. Depending on the game, this can of course be more or less.
Let's first consider the power consumption as a total value, the proportion of computing units (IA Core) and the remaining functional areas such as cache, memory controller, etc. (Uncore). After heating, an average of up to 77 watts is due for the entire CPU, which is comparatively high. It is easy to see that only up to 67 watts are required for the computing units. The value for Uncore then contains things like the cache or the storage controller, while the difference between the package and the sum of IA Core plus Uncore indicates the remaining power dissipation.
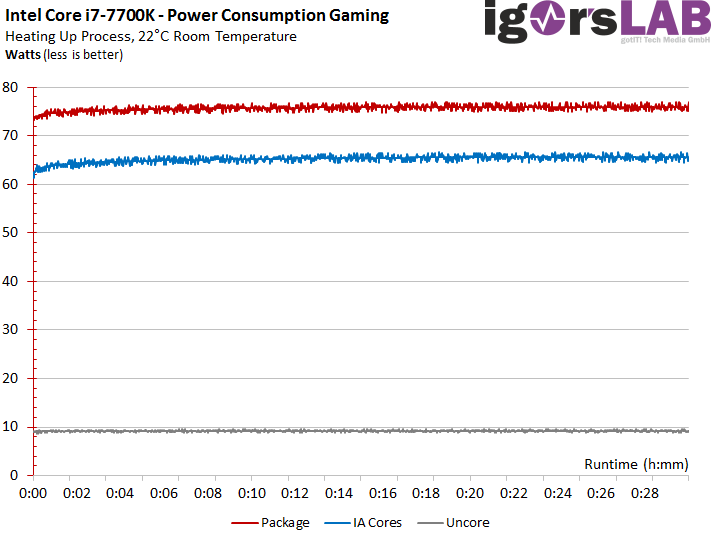
With continuous warming, we can observe a certain increase in power consumption values, which clearly indicates increasing leakage currents. In gaming, the increase is almost three watts.
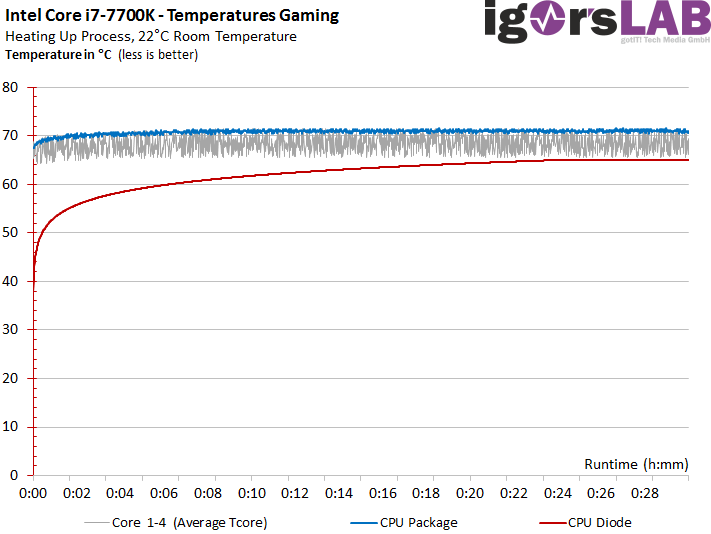
Temperatures rise to varying degrees depending on the position of the respective readout sensor, but stabilize after more than 22 minutes at a maximum of 71°C.
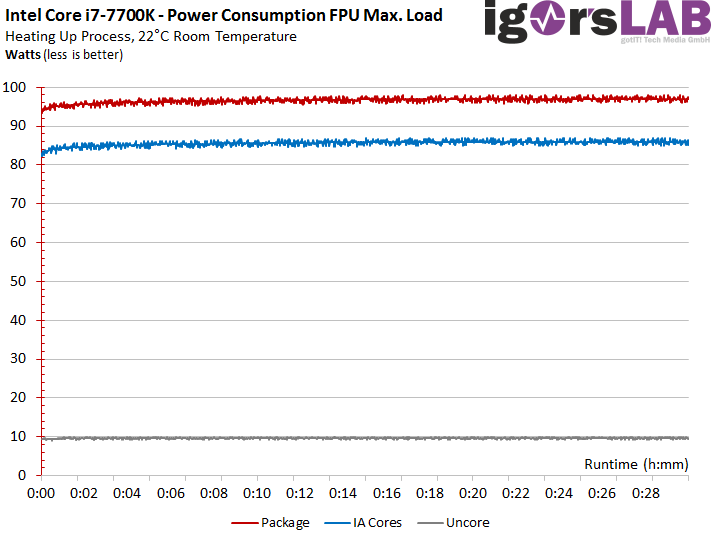
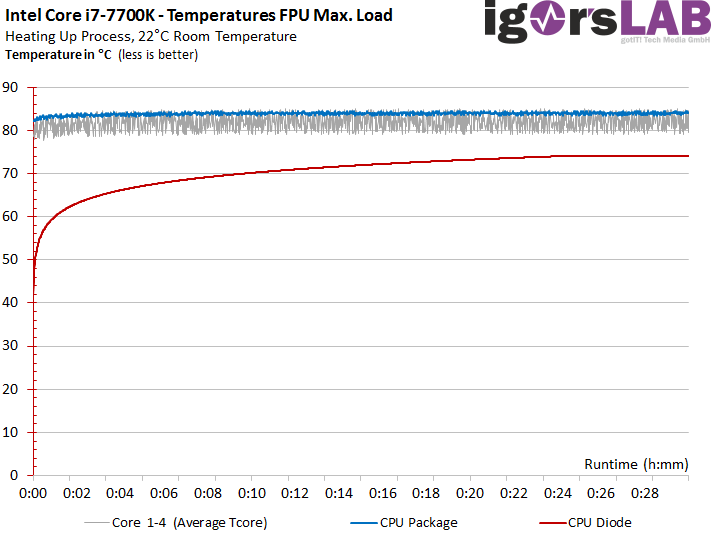
Heavy Load: Torture (Floating Point Unit)
At the next run we let the CPU calculate and use the stability test of Aida 64 (finalware). We only charge the FPU, so that the highest possible power consumption values are generated here. The power consumption climbs up to 98 watts, but again shows a significant increase due to leakage currents, which increase as heating progresses.
With up to 85°C Tcore, this CPU is already just below what you would call a normal user with "just still healthy". In any case, a thermal margin for higher overclocking is different.
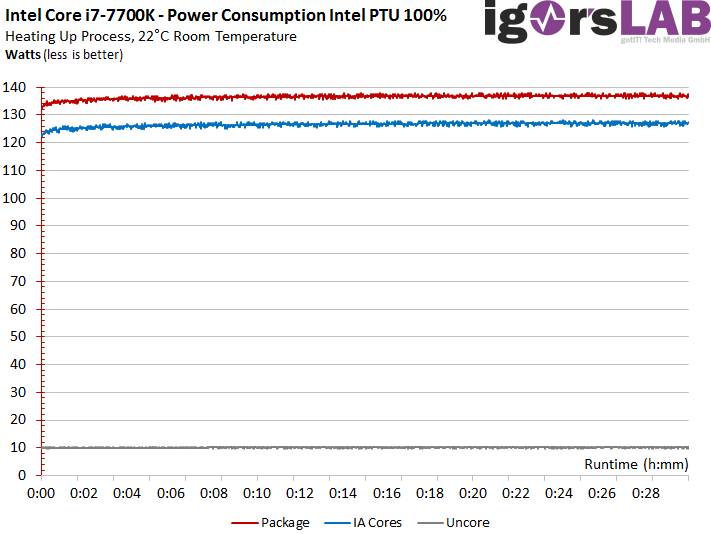
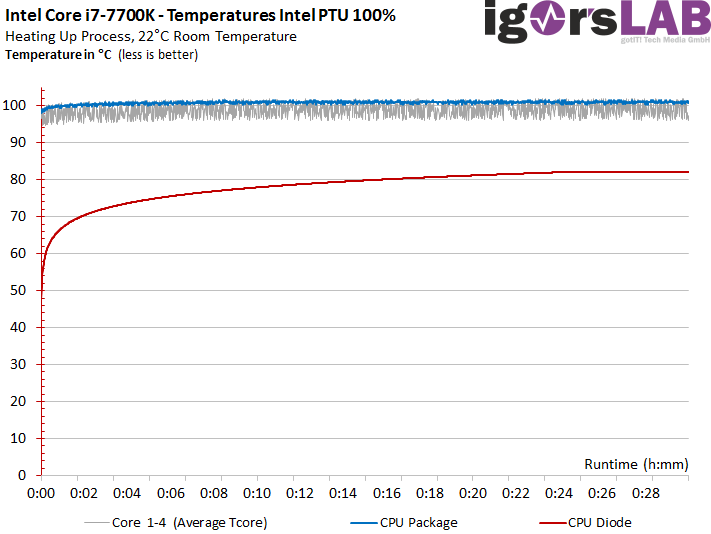
Maximum Load: Intel Power Thermal Utility (100%)
Worse is always going on and so thoracic hammers are finally unpacking. Intel's Power Thermal Utility is nothing for fear bunnies, and probably for Kaby Lake for good reason. A whopping 137 watts now pulverizes the CPU in total, whereby the test pattern in the US editorial office was 18 watts more economical! But we continue to test with what we hold in our hands, and will later deal with the differences separately.
Unfortunately( and only logically), we experience the same heavy explosion in the temperatures. We record up to 101°C, which corresponds to the achievement and short-term exceeding of the permissible maximum temperature. No wonder this leads to the thermal throttling of the CPU (up to 25%) in a very short time. After all, the CPU survived, because she too had to endure this ordeal for 30 minutes.
Now, however, just under 140 watts are nothing that could embarrass the used water cooling per se, because this one manages to tame a Core i7-6950X even up to four GHz, resulting in significantly higher power losses. Here, the small chip surface (density!) and above all the thermal paste used simply add up to a rather ominous alliance, which should make the eyes of every accountant and controller shine, but which drives the end user's worry wrinkles on the forehead. .
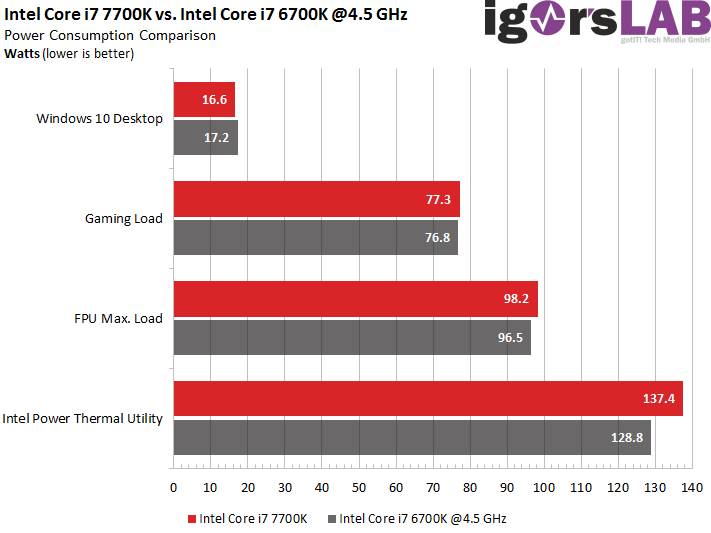
Intel Core i7-7700K vs. Core i7 6700K x 4.5 GHz
In the performance benchmarks, we had compared the Core i7-7700K with an equally high-clocked Core i7-6700K, which could really beat itself respectably, even if it was already acting hard at the maximum possible upper limit. The chip quality of our Core i7-6700K is probably slightly above average, but is also not a real golden sample, but rather good storeware.
That's why we're now starting the comparison of the mediocre Skylake CPU with a rather poor Kaby Lake CPU at the same time. And we are not badly surprised that our Skylake model can even slightly below the Core i7-7700K in power consumption despite manual OC and slight voltage increase in the BIOS!
After that, a rather mediocre overclocked Core i7-6700K would be even more efficient than a poor sales copy of the Core i7-7700K at nominal time. We are already regretting the online retailers, because we are pretty sure that the CPU ping pong could break new records after the launch. We have even obtained a first statistical survey, but we want to take a closer look at it in the section on series action.
The voltages of the Core i7-6700K are always higher than those of the Core i7-7700K, which relies on a new manufacturing process. Nevertheless, this is not yet a guarantee that one can generally be above the previous generation in terms of efficiency.
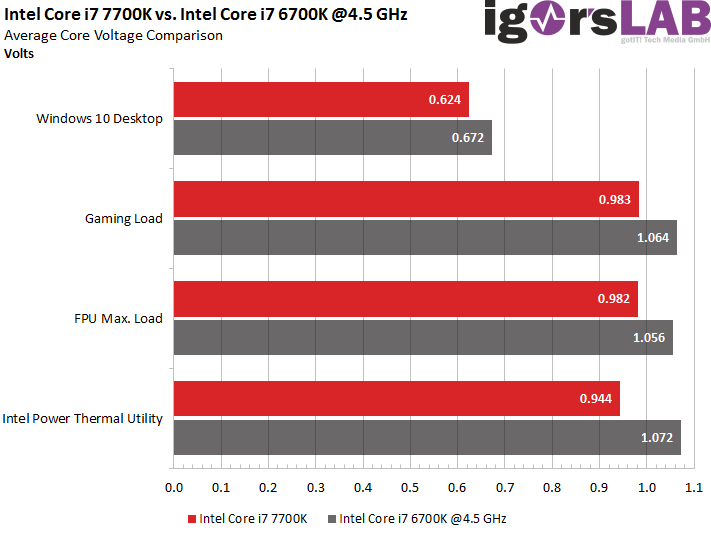
We must point out clearly at this point that the dispersions between the chip qualities of the two CPUs can significantly distort the result. However, we will (need to) come back to the topic of serial scattering later.
Intermediate conclusion
We learn two things from these measurements of our qualitatively acceptable CPU compared to the first tested Core i7-7700K. First, Intel PTU is really not a toy, and secondly, the Core i7-7700K still has enough thermal and power reserves outside of this torture chamber to sustain further manual overclocking.
- 1 - Einleitung
- 2 - Z270, Optane, Overclocking-Tools und HD Graphics 630
- 3 - Test-Setup und Overclocking
- 4 - Benchmarks: Rendering und Office
- 5 - Benchmarks: Workstation-Anwendungen
- 6 - Benchmarks: DTP und Multimedia
- 7 - Benchmarks: Gaming und integrierte Grafik (iGP)
- 8 - Core i7-7700K: Leistungsaufnahme & Temperaturen
- 9 - Core i7-7700: Leistungsaufnahme & Temperaturen
- 10 - Core i5-7600K: Leistungsaufnahme & Temperaturen
- 11 - Core i5-7600: Leistungsaufnahme & Temperaturen
- 12 - Unterschiedliche Chipqualität und ihre Folgen
- 13 - Fazit


Kommentieren