


This CPU, like the Core i7-7700K, has an open multiplier and also has a significantly higher base clock than the non-K models. Of course, this also opens up enough space for your own manual overclocking attempts.
If the factory-determined base clock is 3.8 GHz. so the CPU manages to operate all cores with immehin 4.2 GHz Turbo Core, even at extreme loads. Let's look again at how this CPU behaves under different loads.
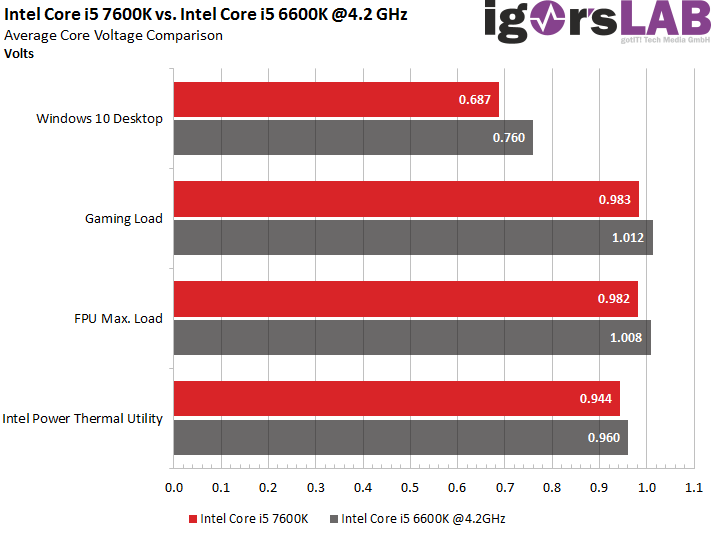
Core Voltages (Vcore)
However, before we get to the power consumption and the resulting temperatures by converting it into waste heat, we again compare the core voltage (Vcore), which should not be confused with the VID adjustable in the BIOS (which is always higher). What we measure here are the real voltage values provided by the converters for the CPU.
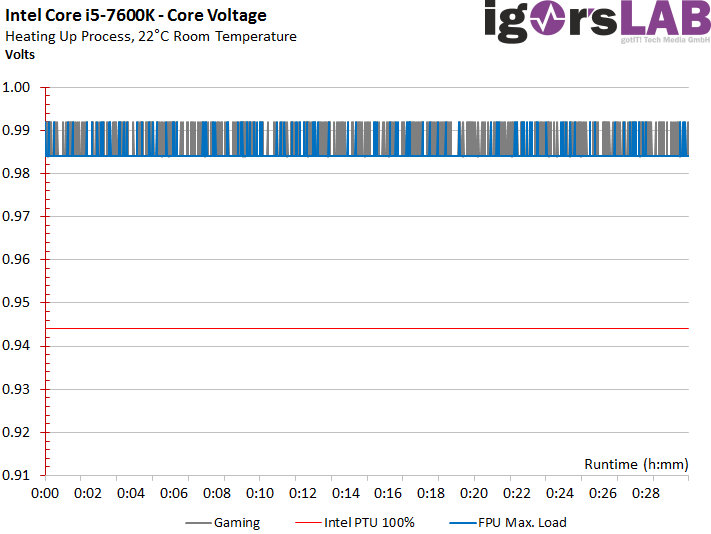
We clearly see that the tension is as the loads increase. This is necessary to ensure that the allowable loss line of the CPU is not exceeded and to ensure that the CPU is not destroyed. The higher the load, the lower the voltage differences in the curve.
Normal Load: Gaming
As with the previous two CPUs, we determine the gaming load. For example, the standard gaming load is due an average of 54 to 56 watts for the entire CPU, which is a good value and still significantly lower than what Intel specifies for the TDP class in question (90 watts). You can also see that only up to 45 watts are required for the computing units, which distributes the difference to the total power consumption over the rest of the CPU.
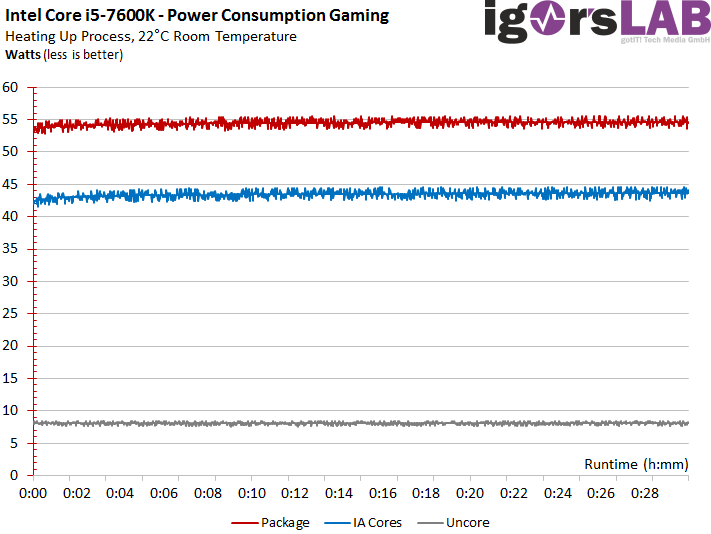
In contrast to the increase in temperatures, we have already seen a smaller increase in power consumption values, so that the losses due to leakage currents after heating can increase to up to 2.2 watts.
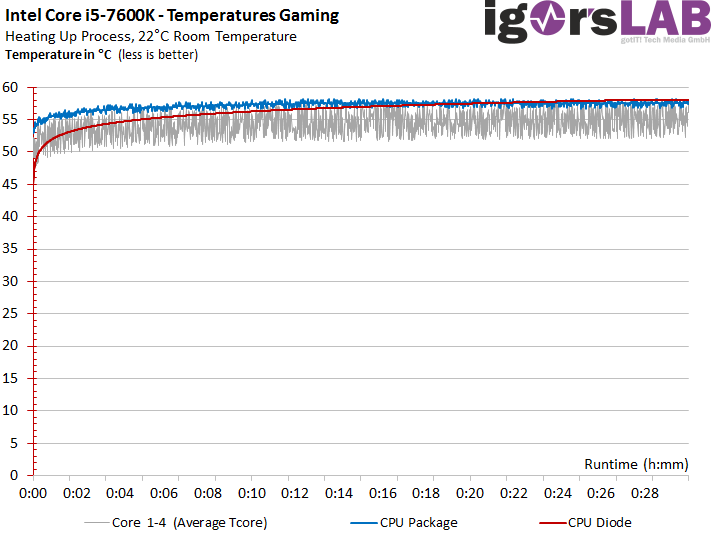
Temperatures rise to varying degrees depending on the position of the respective readout sensor, but stabilize after more than 25 minutes.
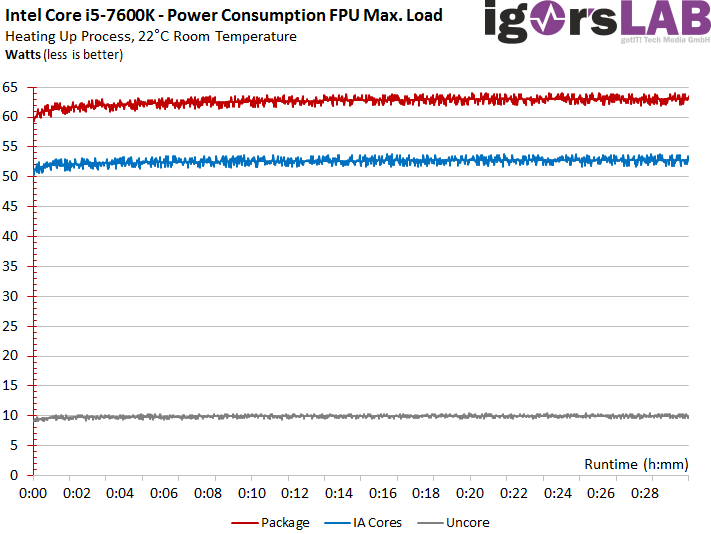
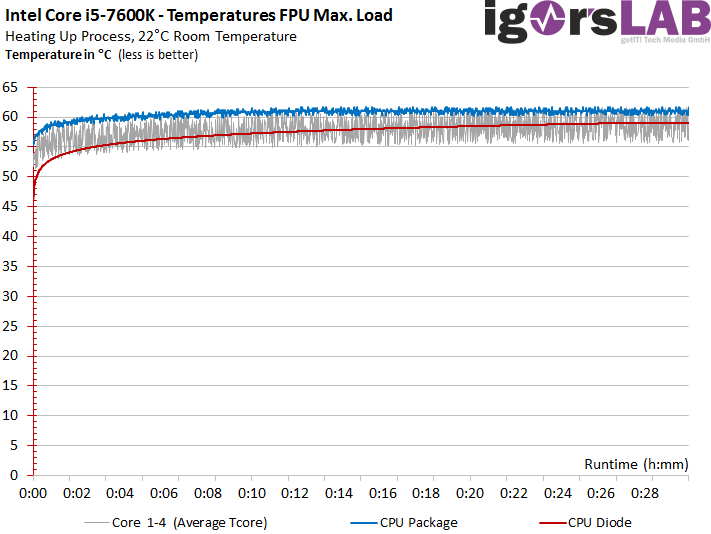
Heavy Load: Torture (Floating Point Unit)
At the next run we let the CPU calculate again, so that a measurably higher power consumption of up to 64 watts results. Losses from leakage currents as warming rise also remain in the same frame as gaming.
Temperatures are also rising significantly, and once again everything already written for the gaming scenario applies. With up to 61°C, however, everything is still very easy to shear and can be cooled well with simpler air coolers.
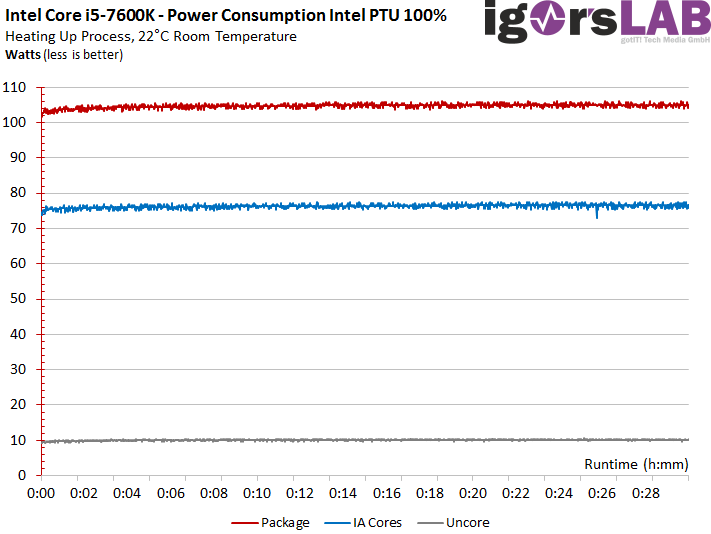
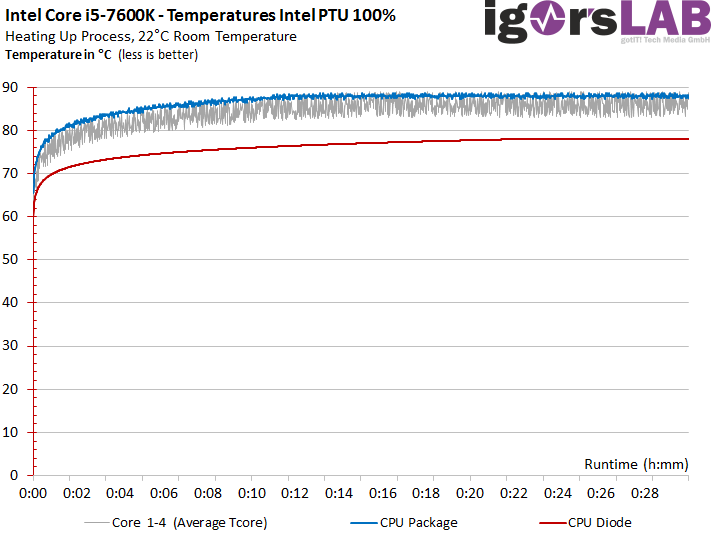
Maximum Load: Intel Power Thermal Utility (100%)
If we start this extreme test, then the power consumption increases again very significantly. With up to 104 watts for the entire CPU, you are far above the mark that Intel generally calls a TDP. Interestingly, the further losses due to higher leakage currents after heating do not exceed the 2 watt limit compared to the cold CPU.
At the temperatures we see that the GPU diode stays a little cooler and rather marks the lower limit of the average temperature over all cores, while the readout value for the CPU package flanks the peak values. But the 88 to 89°C are already very borderline here.
Intel Core i5-7600K vs. Core i5 6700K x 4.2 GHz
We had Skylake participate in the benchmark runs with two adequate CPUs brought to the same pace to the successor model in order to be able to draw conclusions about the IPC. However, power consumption is also an important indicator of what may have improved. And something has happened if you don't catch one of the potato chips!
If one looks at the power consumption in direct comparison for a total of four scenarios, it is noticeable that under load significantly less power has to be absorbed in order to achieve a similar performance. It can also be seen that the difference with increasing loads is always greater.
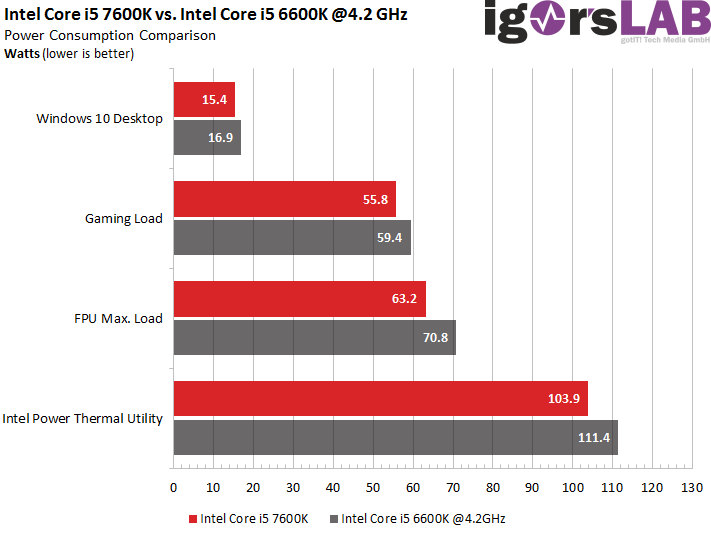
The reasons are likely to be mainly due to the improved manufacturing process, which allows significantly lower voltages, as our sensor sections have shown. But this with the voltages is at least worth questioning, as already shown by the comparison between the Core i7-7700K and the Core i7-6700K, which overclocked to the same clock level, which nevertheless remained more economical in terms of power consumption despite significantly higher Vcore.
At this point, we must again make it clear that the dispersions between the chip qualities of the two CPUs can significantly distort the result. Since only one CPU was available at a time, this comparison is rather exemplary. But we'll come back to the topic of serial scattering later.
Intermediate conclusion
We learn two things from these measurements of our core i7-7700K, which was tested first. First, Intel PTU is really not a toy, and secondly, the Core i7 7600K still has enough thermal and power reserves outside of this torture chamber to sustain further manual overclocking.
- 1 - Einleitung
- 2 - Z270, Optane, Overclocking-Tools und HD Graphics 630
- 3 - Test-Setup und Overclocking
- 4 - Benchmarks: Rendering und Office
- 5 - Benchmarks: Workstation-Anwendungen
- 6 - Benchmarks: DTP und Multimedia
- 7 - Benchmarks: Gaming und integrierte Grafik (iGP)
- 8 - Core i7-7700K: Leistungsaufnahme & Temperaturen
- 9 - Core i7-7700: Leistungsaufnahme & Temperaturen
- 10 - Core i5-7600K: Leistungsaufnahme & Temperaturen
- 11 - Core i5-7600: Leistungsaufnahme & Temperaturen
- 12 - Unterschiedliche Chipqualität und ihre Folgen
- 13 - Fazit


Kommentieren