


Benchmark selection and practical relevance
Of course, you could make it easy and roll out synthetic benchmarks that show exactly one thing in the end: that there is actually nothing to show.
In any case, not when the equivalent models of Skylake and Kaby Lake compete against each other at the same pace. Intel wants to make a few small improvements. But is this sufficient for standard applications to at least a measurable advantage, if one does not notice a real difference subjectively?
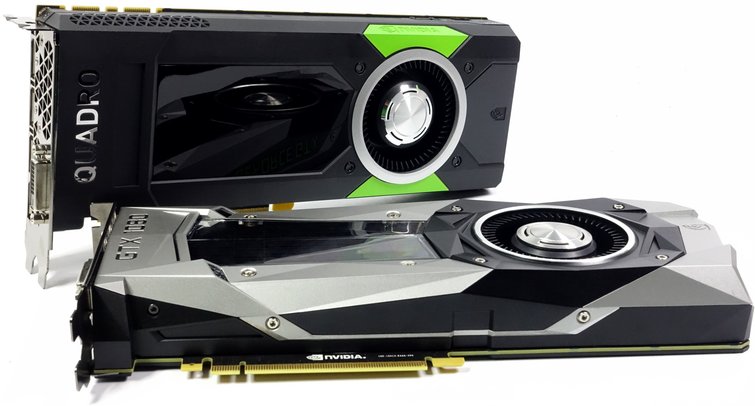
Since we will use both in-house benchmarks and very good standard software from the workstation sector, we need for everything that provides a graphical output, of course, also the appropriate graphics cards, which our test objects as little as possible or only a little Limit. Therefore, in the end, nvidia's GeForce GTX 1080 FE and Quadro P5000 graphics cards, which are about the same speed, have to be directed to each other when it comes to graphical output on the same Niiveau, because some applications only run with certified drivers.
There is a very specific reason why we like to rely on standard industrial software: almost all aspects are evaluated in the interaction, because the greatest engine does not help if you do not get the power on the road at the end. In addition, these tests almost always run very long and also in several iterations, so that the results are reproducible and have a very small tolerance range. But there's more to it.
Together with the four larger Kaby Lake CPUs, we test the top models of the previous generation Skylake – once in factory condition and once overclocked to the level of the Kaby Lake counterparts. This armada is completed by Intel's Core i7-4790K and AMD's fastest CPU at the moment, the FX-9790. The charts will show us that it makes little sense to fill the bottom half with more CPUs.
Rendering: Blender and the "Ryzen" workload
It's a pity that Ryzen isn't on the market yet, because then it would certainly have looked much better for AMD in terms of the competitive chart entries.
However, since AMD has already released an official benchmark in which the new Ryzen clocked to 3.4 GHz (without turbo) should be as fast as Intel's Core i7-6900K, we have – like AMD – Blender in version 2.78a as well as the render project released for download by AMD with the corrected 150 tiles.
As many simultaneous threads as possible, coupled with the highest possible clock, are in the end also the guarantors of success in this benchmark, because every reader can also understand at home for comparison and whose results are certainly also good as a forum entry will make.
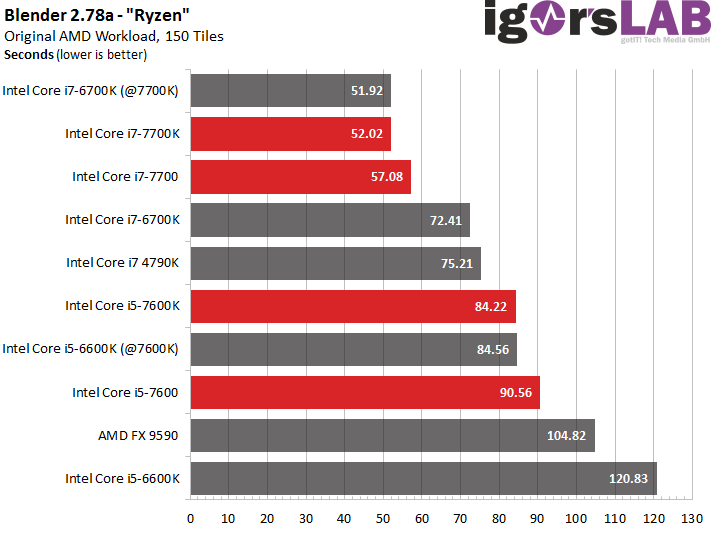
We see that Kaby Lake and Skylake are pretty much the same, even if the beat is the same. The actual increase in performance compared to the older models in the factory state is therefore the result only of the listener clocking of the newer models, but not from a possible architectural improvement.
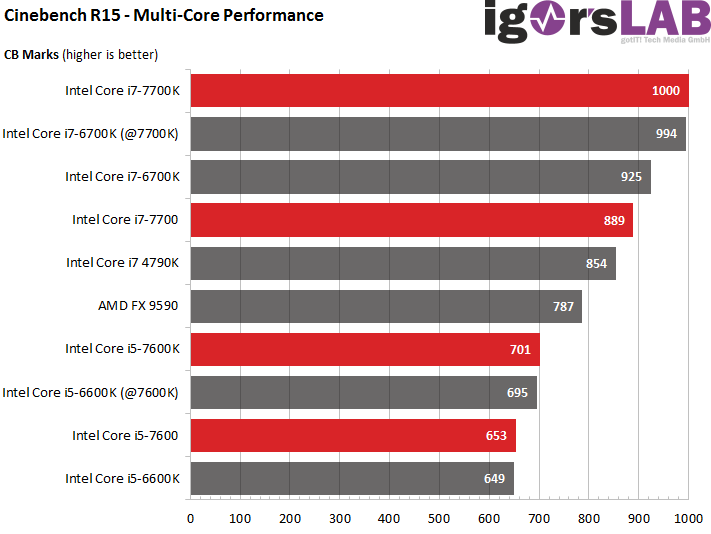
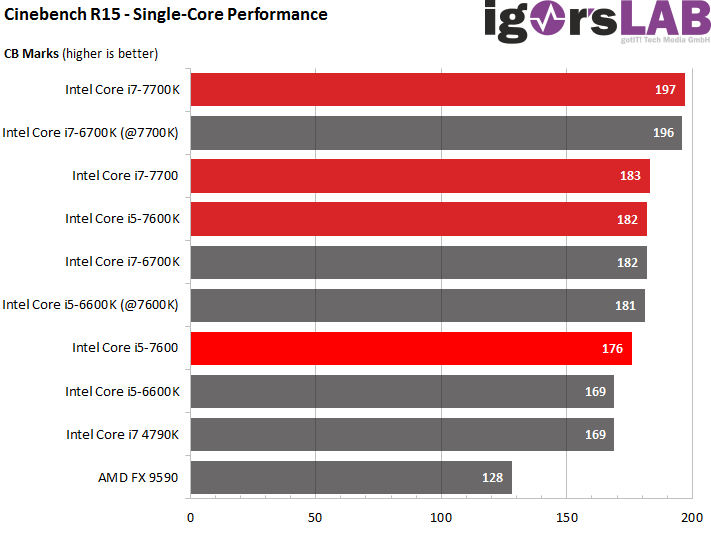
Rendering: Cinebench R15
Maxon's Cinebench R15 is also a very good test object for readers to compare themselves to their own hardware. It is also practical with this benchmark that you can have both multi-core and single-core performance evaluated when rendering.
If we allow all cores to render, the expected image results, because the highest possible number of threads and a high clock at the same time ensure the familiar image. It's also nice to see that AMD's FX-9590 can still be in the midfield, although the energy is a real effort.
By the way, Cinebench R15 is one of the few benchmarks where an equally fast-clocked Skylake CPU is visibly behind the Kaby Lake successor. These are not measurement inaccuracies, as we had several runs completed with otherwise identical hardware.
If you look at the result now, if only one core can be used extensively, the image tilts thoroughly – and with it the mood a little. There are two interesting failures in the overall picture: the FX-9590 is passed down, but the Haswell refresh in the form of the Core i7-4790K also sags significantly. Otherwise, the small difference between Kaby Lake and Skylake is again present.
2016 Microsoft Office
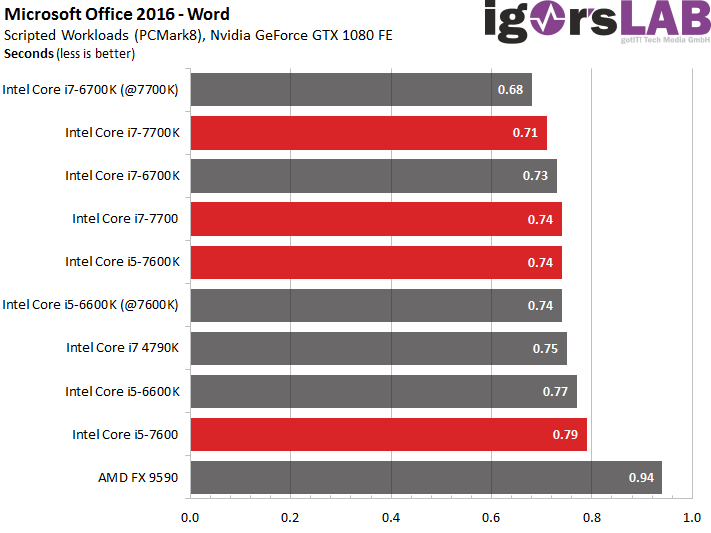
The very common Office suite must not be missing in the latest edition. We leave PCMark8 Professional to provide and control the respective workloads as well as the geometrically averaged evaluation (GEOMEAN) of the three individual benchmark runs with the three tested applications (Microsoft Excel, Word and PowerPoint).
Anyone who thinks that such a test would be boring is, by the way, hugely mistaken – especially since many readers also spend a lot of time with such programs. However, whether you can really save time with the Kaby Lake CPUs will have to be seen.
Let's start with Microsoft Word. In the end, the program is grateful for every MHz more clock and those who mostly only write will be able to thankfully do without expensive CPUs and features like SMT.
| Filesize: |
Pages: |
Words: |
Pictures: |
|
|---|---|---|---|---|
| Source document: |
3.25 MByte | 77 | 17.987 | 5 |
| Destination: |
57 MByte | 138 | 30.800 | 10 |
| Actions: |
– Start of the program and open the document – Open the target document in a new window – Copy a larger section of the source and destination document – Save target document with new file name – Raise the window of the target dikument – Cut and paste a larger section in the destination – Save target again – Text input with simulated input delay – Save target again – Insert images in the destination – Save target again and close program |
|||
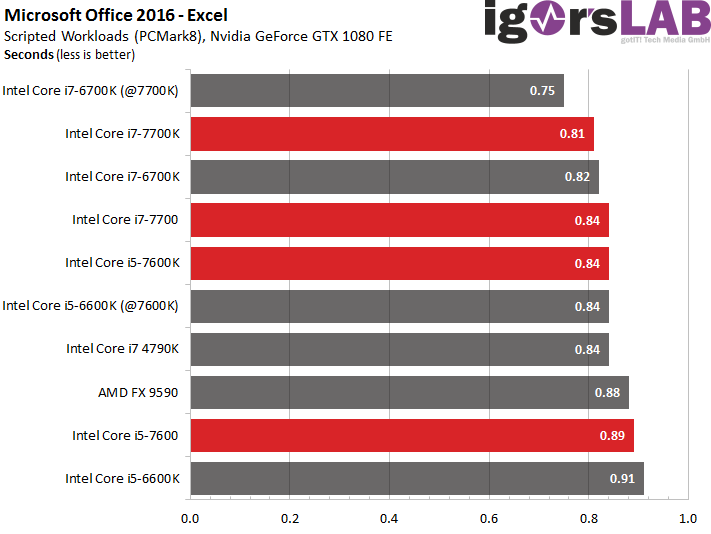
Excel is a bit more picky, because at least larger workloads benefit not only from the high clock but also from more usable threads. This pushes a dino like the FX-9590 up a little bit.
| Filesize |
Worksheets |
Active cells |
|
|---|---|---|---|
| Initial Files: |
4.62 MByte 2.33 MByte |
4 | 240.800 |
| Destination: |
4.18 MByte | 2 | 10.930 |
| Actions: |
– Program start and open all three worksheets – Open all workbooks – Enlarge the working window – Copying the data from the source and target workbook with formula evaluation – Copying the data from the source and target workbook without formula evaluation – Copying formulas stored in cells – Copying more data into these cells with formula evaluation – Insert specific values into three cells with formula evaluation – Save the target file and close the program |
||
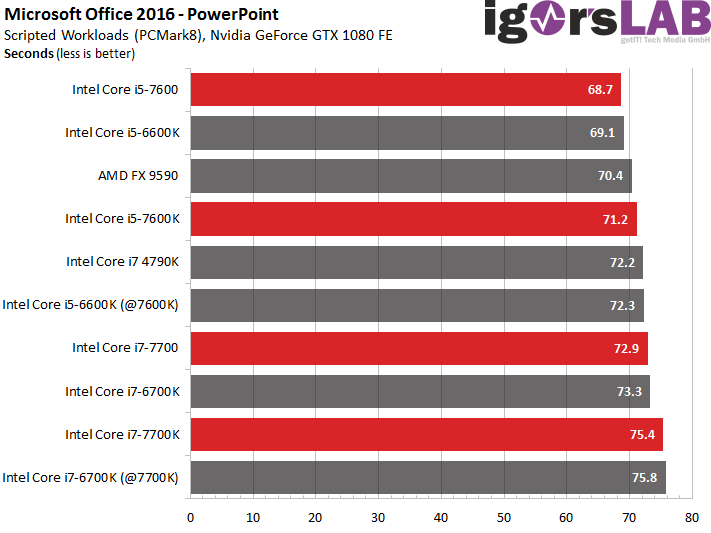
But what about PowerPoint? Whatever we do, the result is a little different than usual, but reproducible in CPU order. The last ones will be the first – at least with our CPU selection! What falls on Intel's newer Core i7 is SMT: PowerPoint can't do anything with many cores and seems to be easily swaying.
If you switch off the Core i7-7700K SMT, it will be faster. But even the beat doesn't help to get to the top. We suspect that the lower core to core latency of the slightly lower clocked models are helpful. And it also turns out that Kaby Lake can be a little bit faster at the same time, even if the differences are rather marginal.
| Filesize: |
Slides: |
Pictures: |
|
|---|---|---|---|
| Source file: |
27.1 MB | 15 | 12 |
| PDF Export: |
2.83 MB | 16 | 13 |
| Actions: |
– Program start and open the presentation – Enlarge application windows – Browse through the slides and simulate viewing through pauses – Add new foil – Insert and crop image – Insert text – Save file – PDF export and closing of the program |
||
We see that Office was not as boring as in normal working life. Nevertheless, it can also be noted as an interim conclusion that even smaller CPUs now cost significantly less money and still hardly any more time.
- 1 - Einleitung
- 2 - Z270, Optane, Overclocking-Tools und HD Graphics 630
- 3 - Test-Setup und Overclocking
- 4 - Benchmarks: Rendering und Office
- 5 - Benchmarks: Workstation-Anwendungen
- 6 - Benchmarks: DTP und Multimedia
- 7 - Benchmarks: Gaming und integrierte Grafik (iGP)
- 8 - Core i7-7700K: Leistungsaufnahme & Temperaturen
- 9 - Core i7-7700: Leistungsaufnahme & Temperaturen
- 10 - Core i5-7600K: Leistungsaufnahme & Temperaturen
- 11 - Core i5-7600: Leistungsaufnahme & Temperaturen
- 12 - Unterschiedliche Chipqualität und ihre Folgen
- 13 - Fazit


Kommentieren