


Synthetic benchmarks
The synthetics are a good opportunity to really run the big numbers, if they are correct. We will see later how well this works in reality with the real application benchmarks. That’s why I’m starting with CrystalDiskMark and four different file sizes. The SSDs were no longer brand new at the time of testing and I had already had fill levels of around 70% before deleting the data several times. However, the SSD never quite reached the specified maximum values from the data sheet when writing large blocks, but the values determined here are quite constant and, with a little good will, still correspond to the actual state of the then virgin product.
You can see very clearly that the dynamic pSLC does exactly what it is supposed to do, mind you with an empty (albeit not virgin) SSD. The annoying thing about a 2 TB SSD is that there is still so much space left and you should therefore never fill it more than 2/3 to 3/4 full with data. This must always be taken into account when planning. A higher load does not affect reading, but the dynamic SLC will certainly reach its limits at some point when writing. And if you do it over and over again, it will eventually no longer be possible to switch the memory modules between the two methods.
 |
 |
 |
 |
ATTO is very interesting this time, although I only work with two sizes here, which ultimately amounts to the same thing. The data is not quite similar to that of the CrystalDiskMark, but in reality is significantly lower than the manufacturer’s specifications. Of course, it has to be said that even what is measured here is still completely sufficient. Hence the “up to” and you’re in the clear.
 |
 |
Video streams
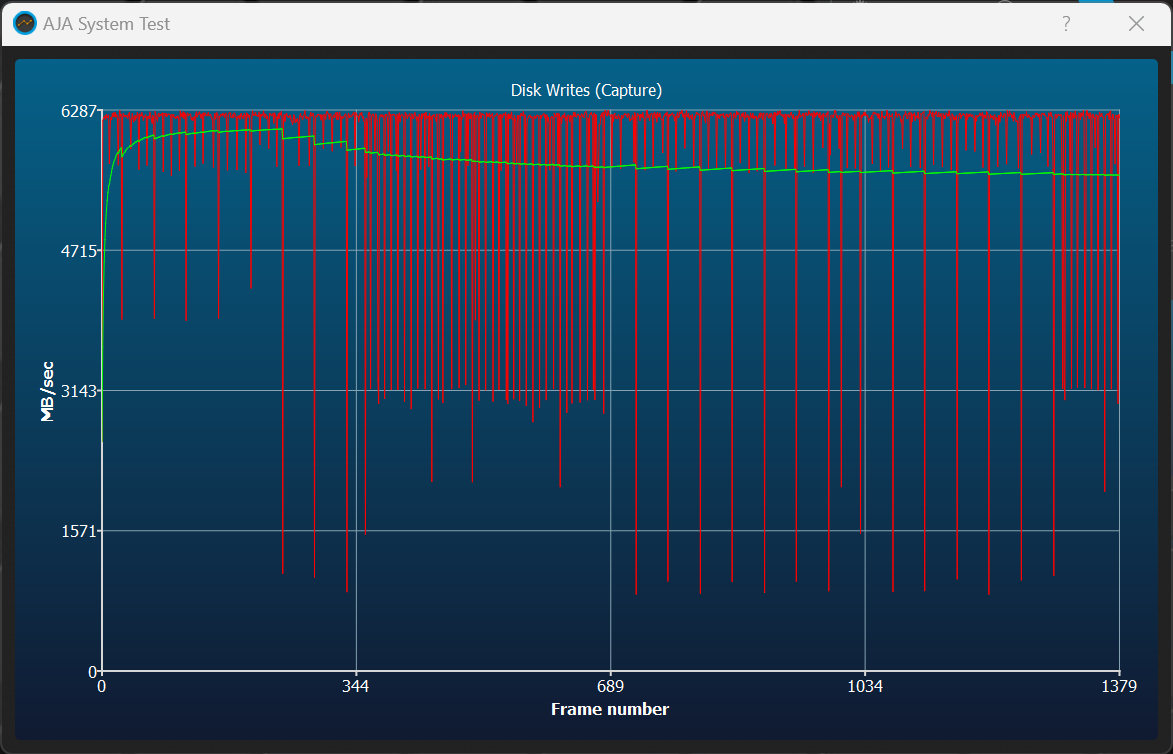
But what happens when you stream a video? The industry uses the AJA benchmark for this, which is effectively an interface between synthetic benchmarks and practical applications. Here, too, the HP FX700 does not fall short, even if it does deviate somewhat from the theoretical write and read rate, just like ATTO. Nevertheless, I compare it with the NETAC NV7000-t 2TB, which uses the same memory size, the same controller, but pure TLC instead of QLC. And we see that the write behavior is very, very similar, including the pattern of drops. So here it’s the controller and not the NAND modules themselves.
| HP FX700 (QLC) | NETAC NV7000 (TLC) |
 |
 |
We can see that the comments made on the previous page about the dynamic pSLC cache and the behavior with the larger file blocks apply in full. Smaller file movements would be even faster if the overhead of the file system is omitted. This is particularly noticeable at the end of the run. And that’s where the HP FX700 is clearly ahead.
| HP FX700 (QLC) |
NETAC NV7000 (TLC) |
 |
 |
For those who are curious, I also have the measurement report with all the details as a PDF:
BENCHMARK-TABLE


11 Antworten
Kommentar
Lade neue Kommentare
Veteran
Veteran
Mitglied
Veteran
Moderator
Urgestein
Mitglied
Urgestein
Moderator
Veteran
Mitglied
Alle Kommentare lesen unter igor´sLAB Community →