


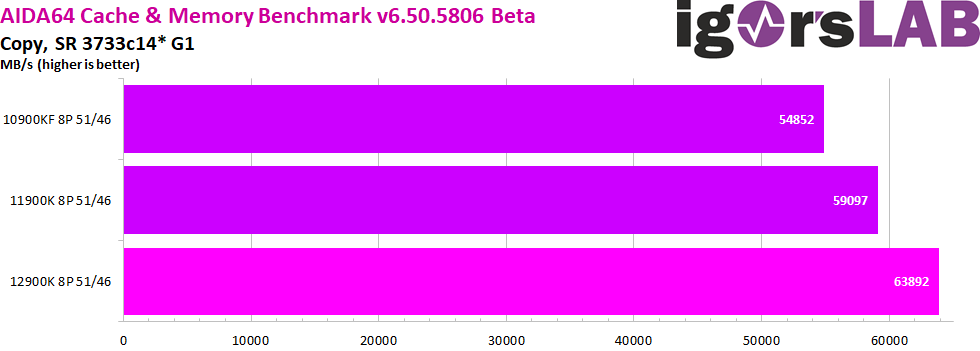
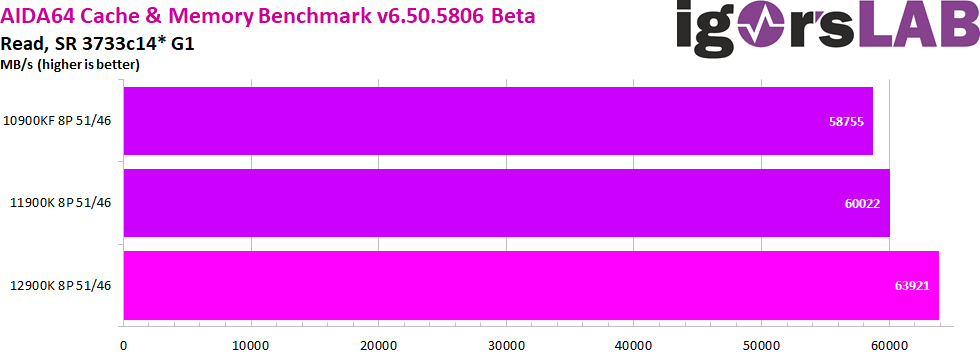
Let’s now take a last look at the detailed power consumption values of the respective CPU. As with the other resolutions, the pure package power of the respective SKU was measured across all games and during each individual benchmark run. And we’ll guess: The FPS are very, very similar, but the power consumption values are not. Often you get the same performance, but with very different consumption. Let’s do a fact check!
Power consumption compared to FPS
For a better illustration of power consumption in relation to FPS, I plot the already known FPS curves and CPU power consumption against each other. You can now select the same desired game in each of the two galleries and then compare these curves with each other. So everything as usual.
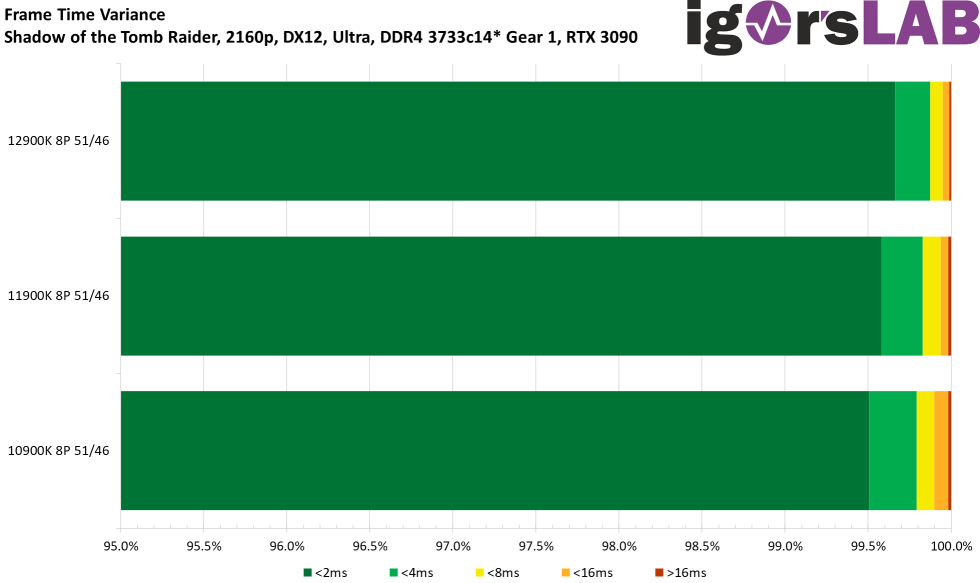

The trend that the three Alder Lake CPUs are very frugal continues here very impressively:


We also see in the sum of GPU and CPU (that belongs together, after all) that the faster CPUs naturally produce higher GPU power consumption.


Efficiency of the CPU in Watt per achieved FPS
Of course, you always have to look at the power consumption in the context of gaming performance. Here I calculated again how many watts you have to spend per second for each single frame. Still looks good for Intel, too.
With that, I’m also done with 1440p and you can turn the page.

- 1 - Introduction, Test System and Methods
- 2 - 720p - Gaming Performance
- 3 - 720p - Power Draw and Efficiency in each Game
- 4 - 1080p - Gaming Performance
- 5 - 1080p - Power Draw and Efficiency in each Game
- 6 - 1440p - Gaming Performance
- 7 - 1440p - Power Draw and Efficiency in each Game
- 8 - Overall Gaming Performance and Comparison
- 9 - Summary of Power Consumption and Efficiency
- 10 - Conclusion and Final Words (for now)


39 Antworten
Kommentar
Lade neue Kommentare
Mitglied
Urgestein
Urgestein
Veteran
1
Urgestein
Urgestein
Urgestein
Veteran
Veteran
Mitglied
Veteran
Mitglied
1
Veteran
Veteran
Mitglied
Urgestein
Veteran
Alle Kommentare lesen unter igor´sLAB Community →