


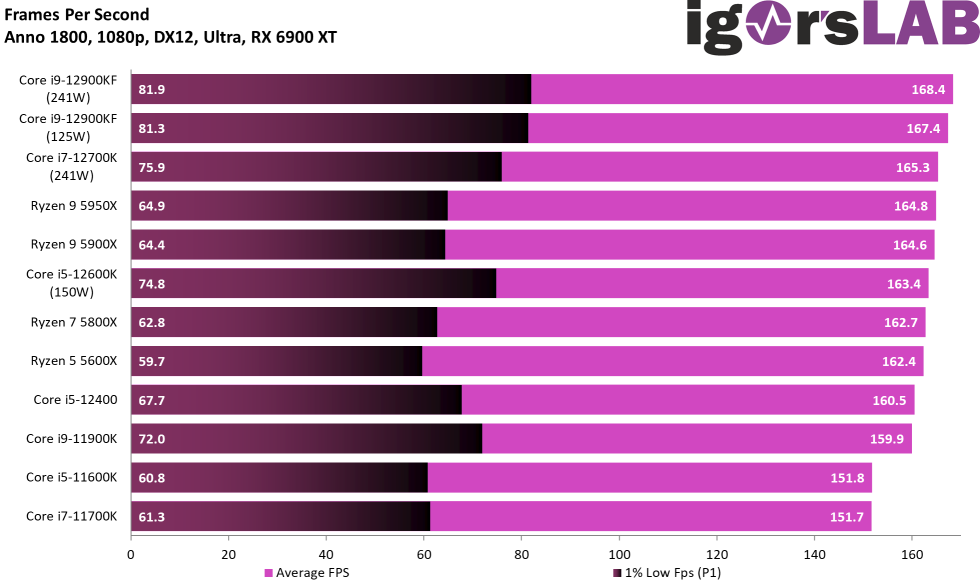
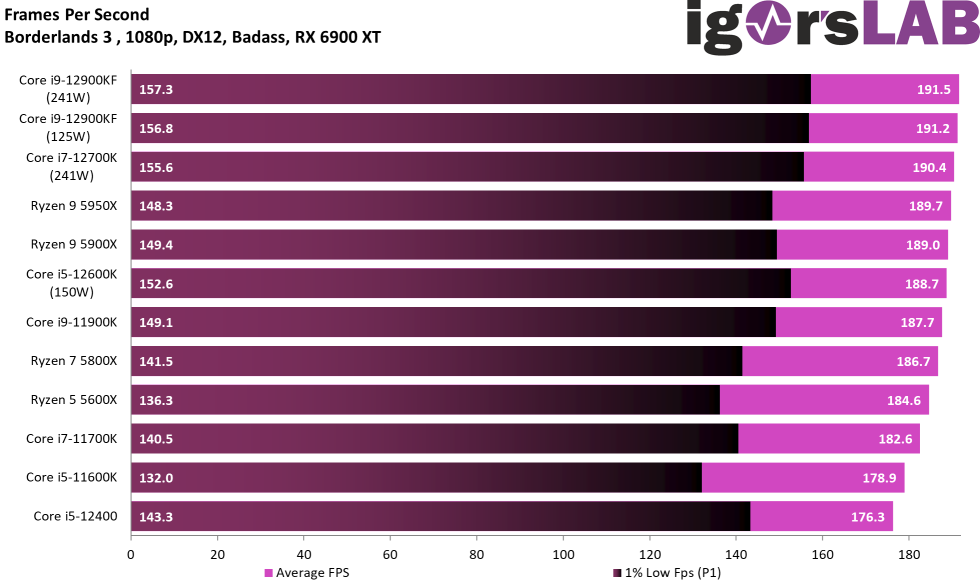
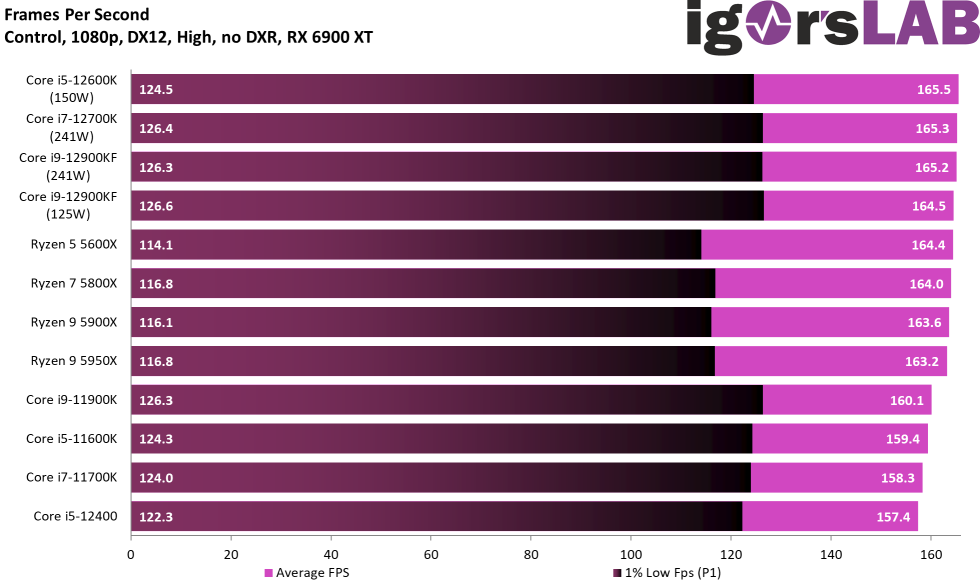
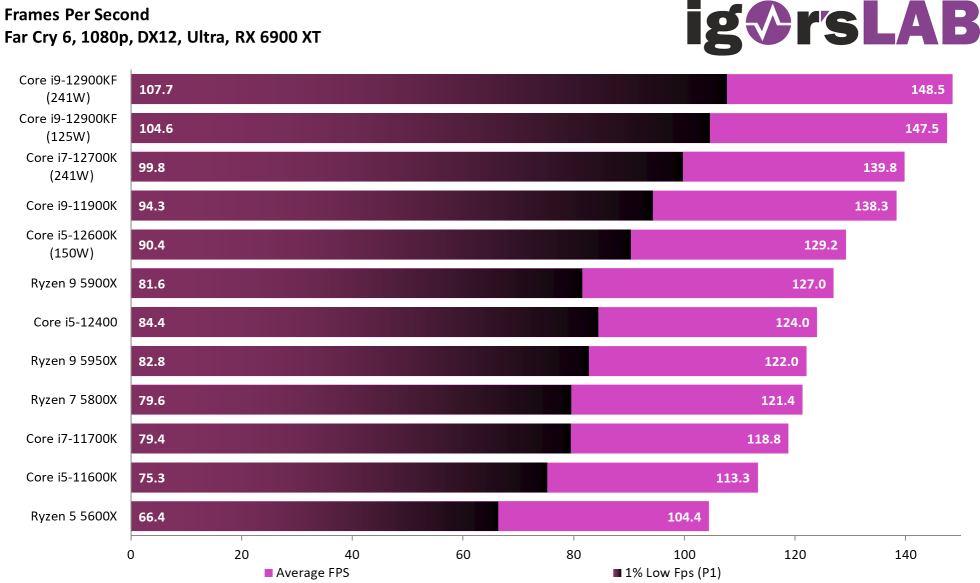
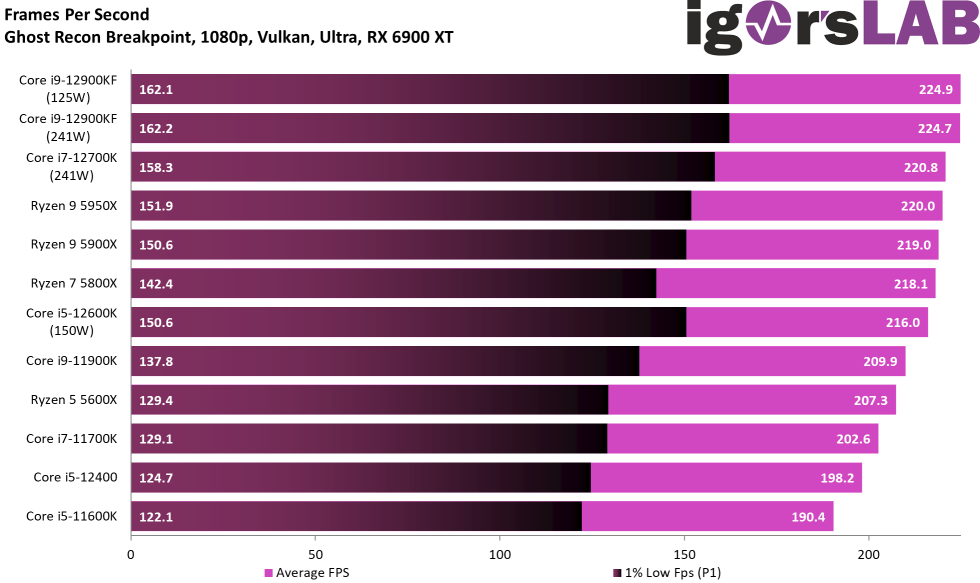
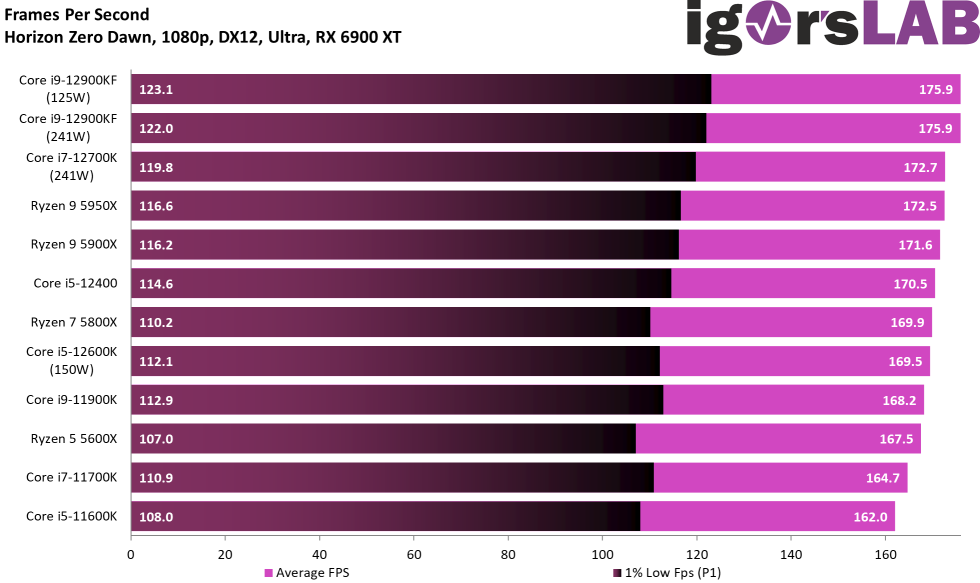
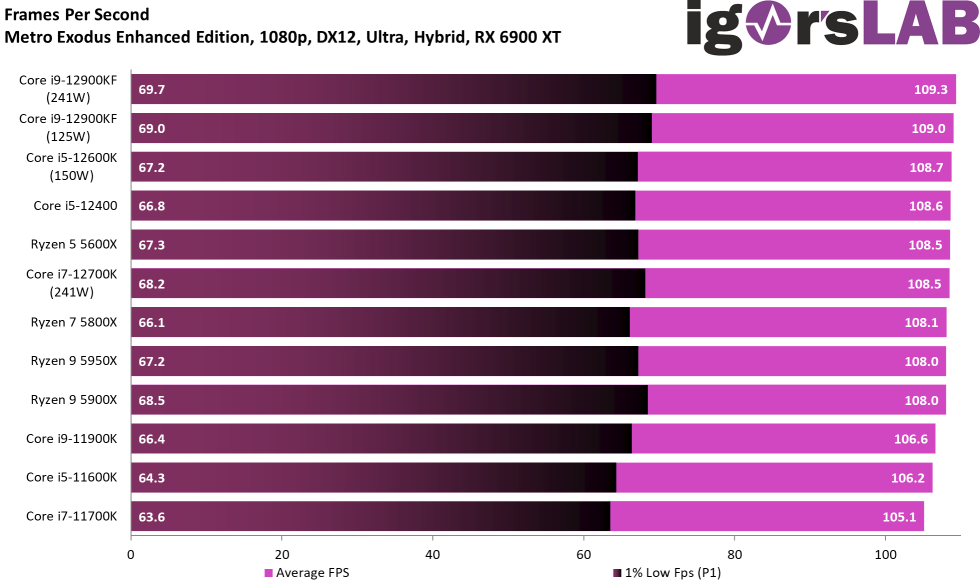
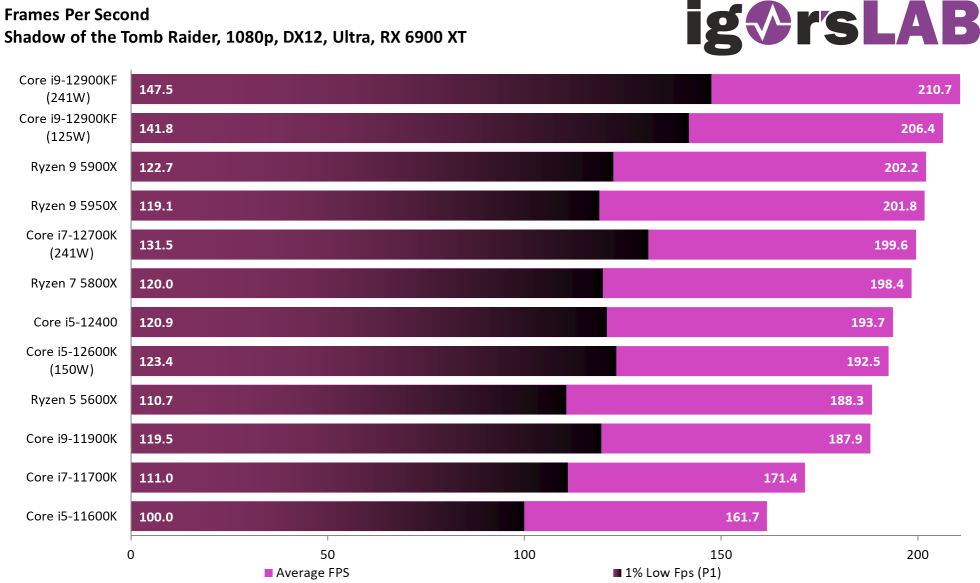
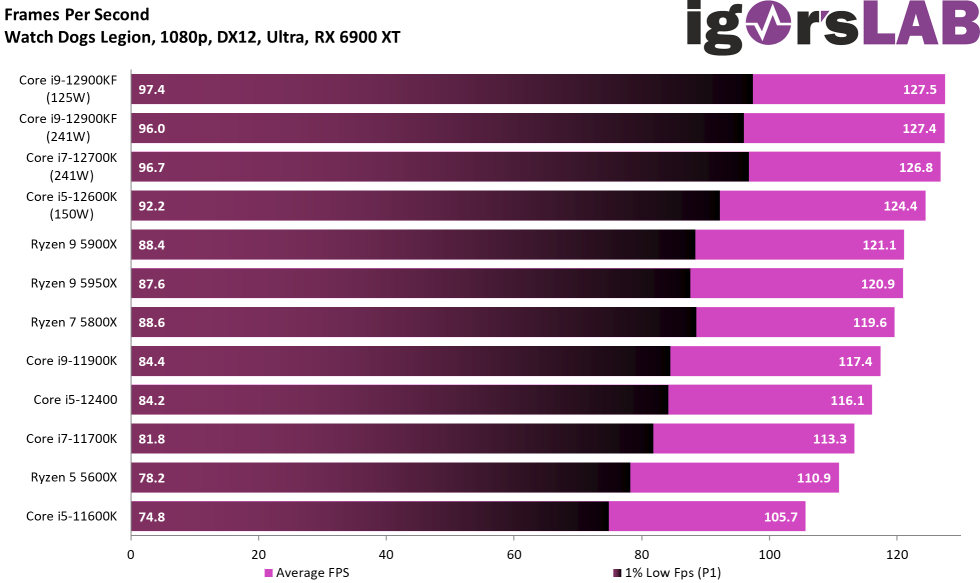
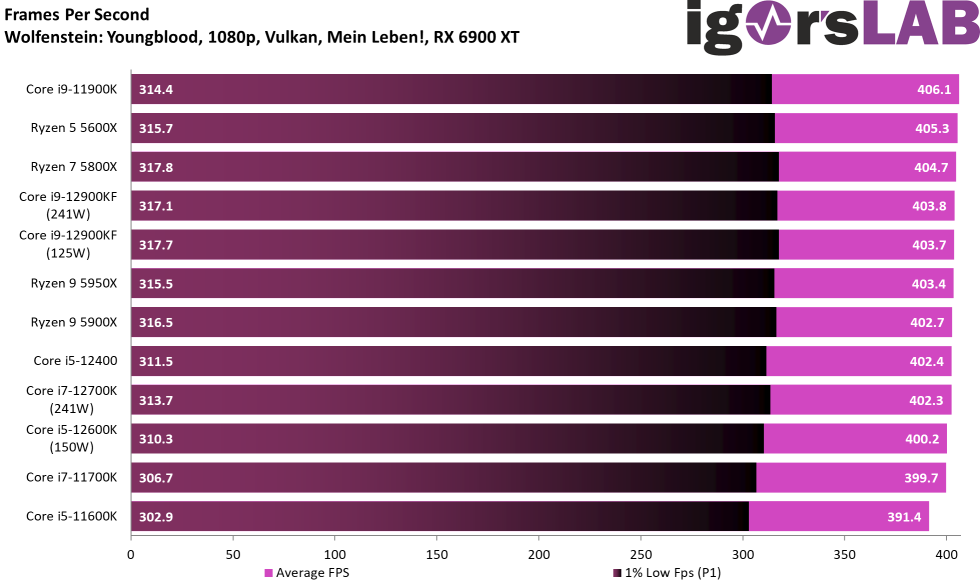
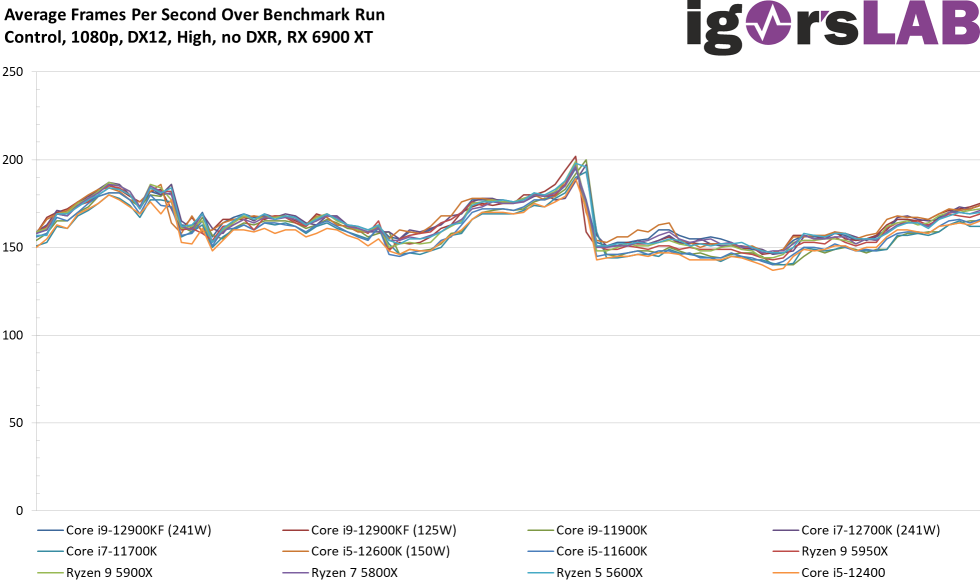
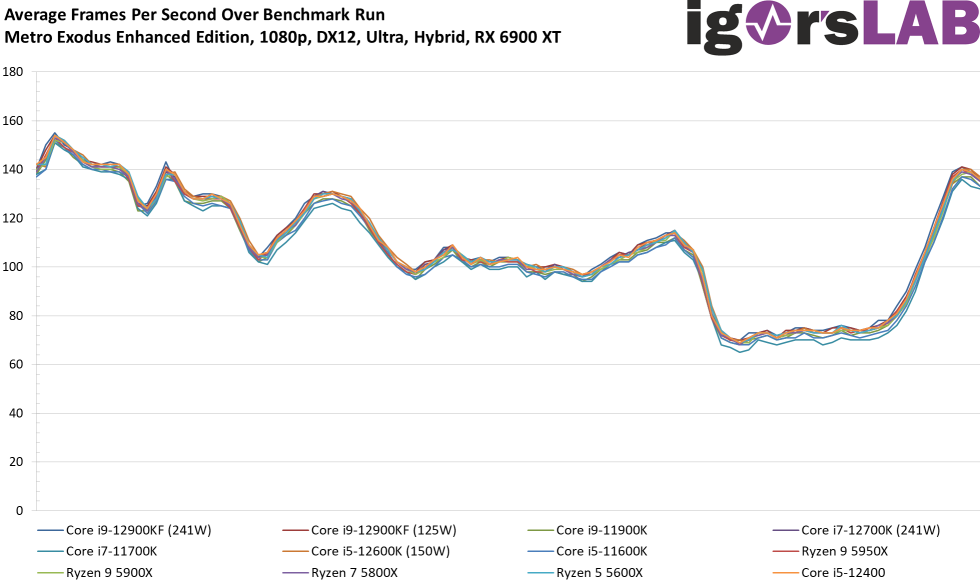
Now let’s move on to the measurements in 1080p, a resolution with 1920 x 1080 pixels. The bars now move visibly closer together, as the graphics card is now brought more into play. I simply recommend carefully browsing through all the individual benchmarks and looking at the position of the emulated Core i5-12400. Clock disadvantages yes, but you will rarely miss the e-cores. Thus, this CPU is perhaps worth even more for average gamers than a Core i5-12600K with DDR5 and Z690 board.
First, again, all games as FPS bars, with Intel CPUs leading the way on the P1. Especially with the min-FPS, this is definitely somewhat strange.
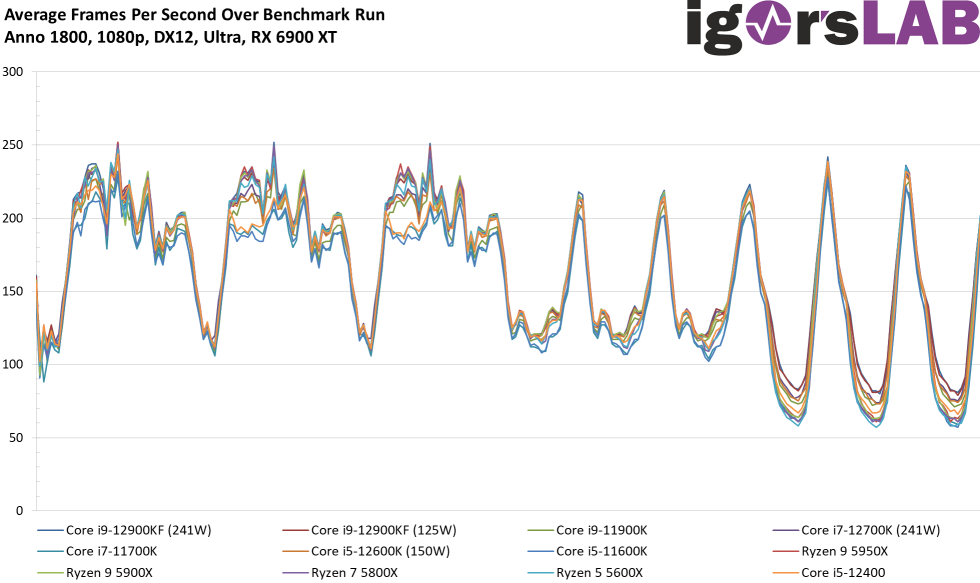
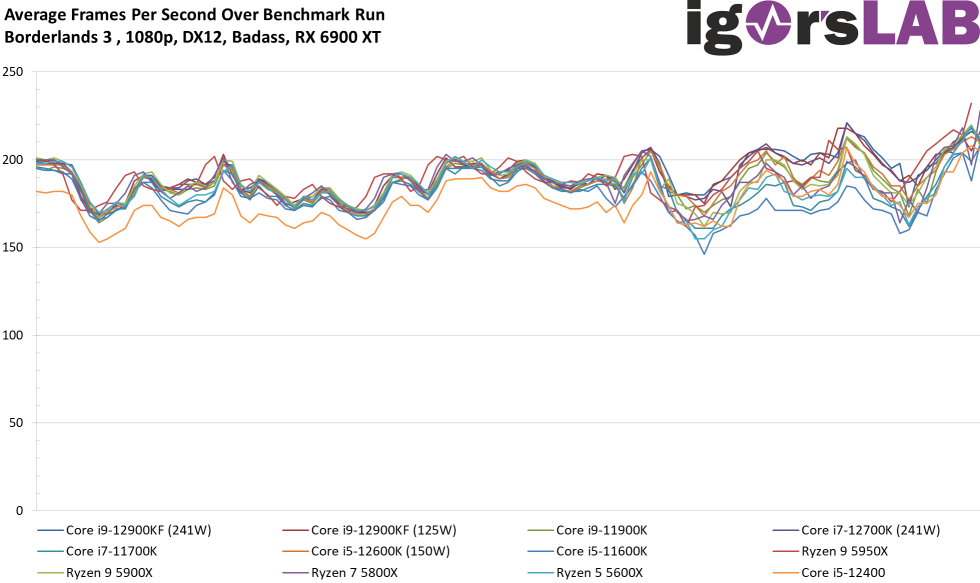
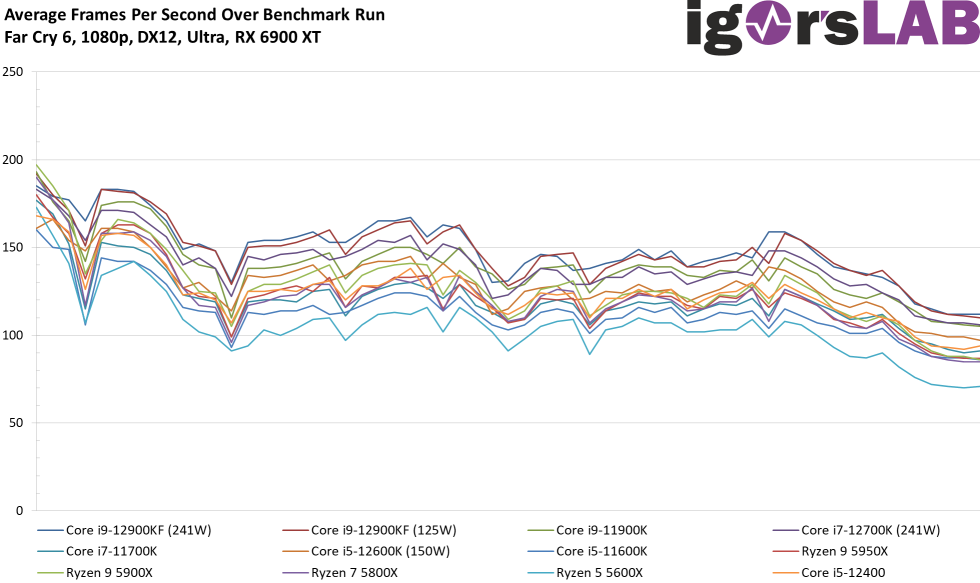
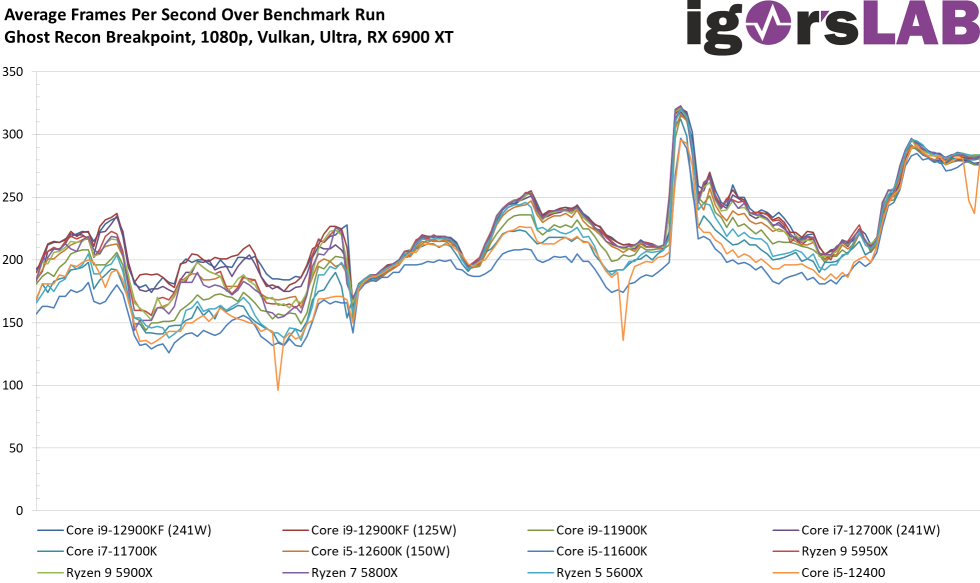
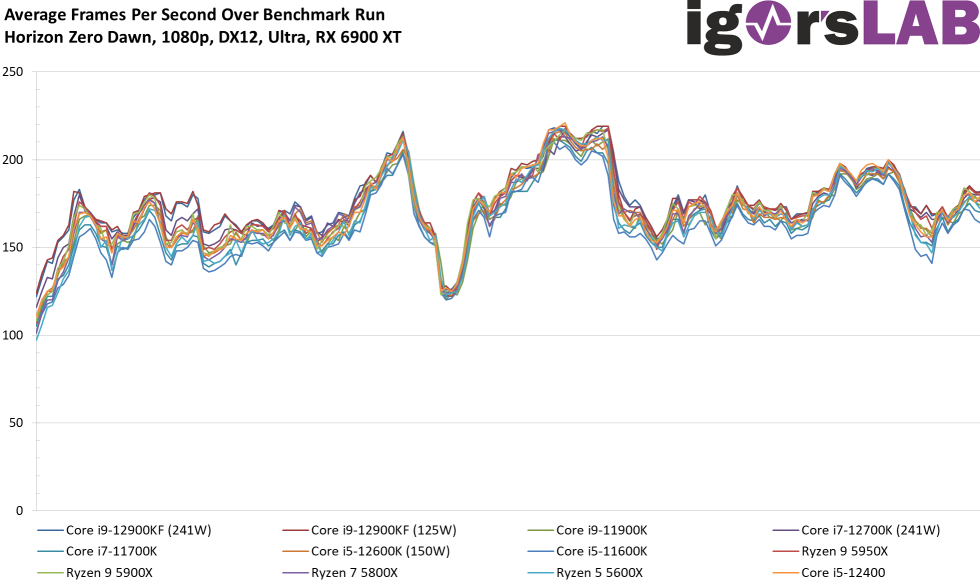
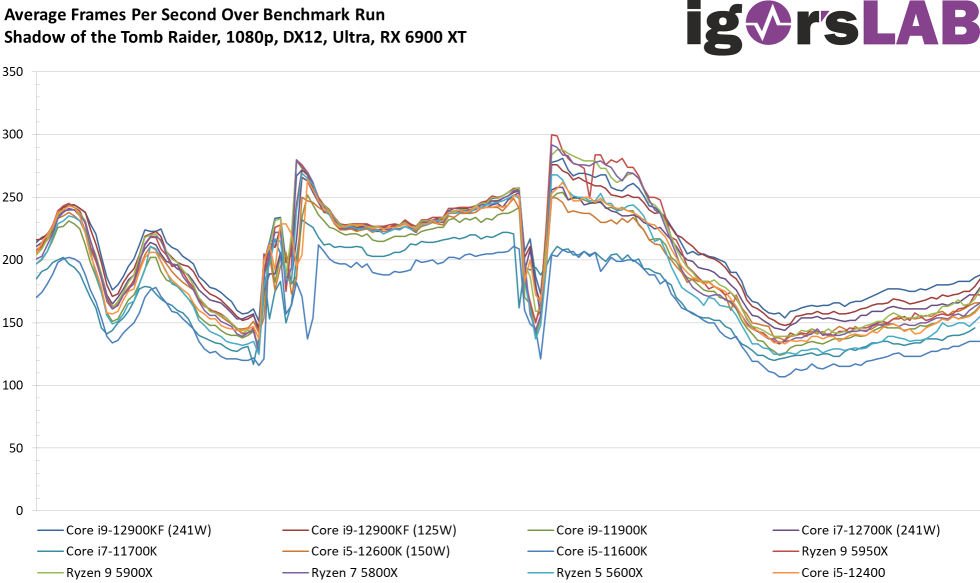
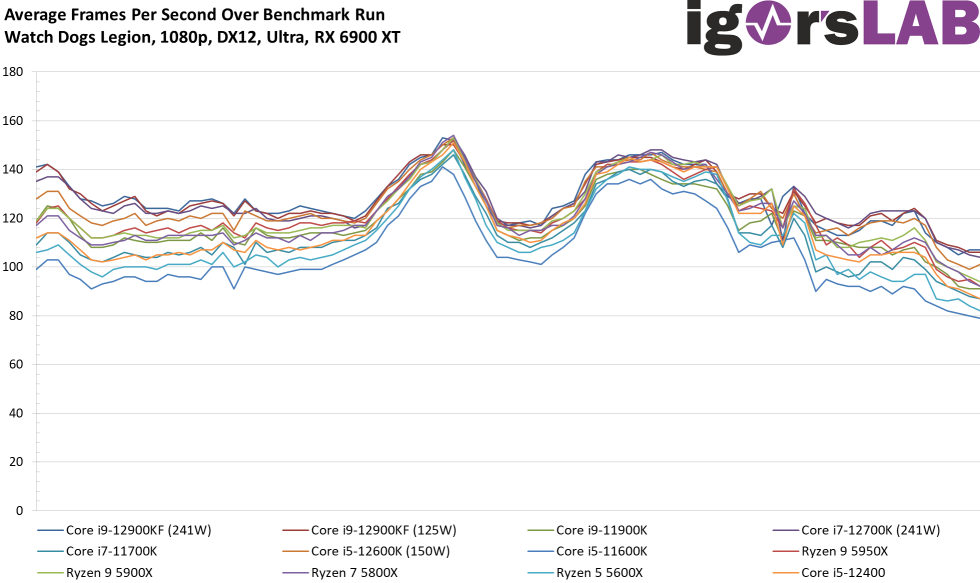
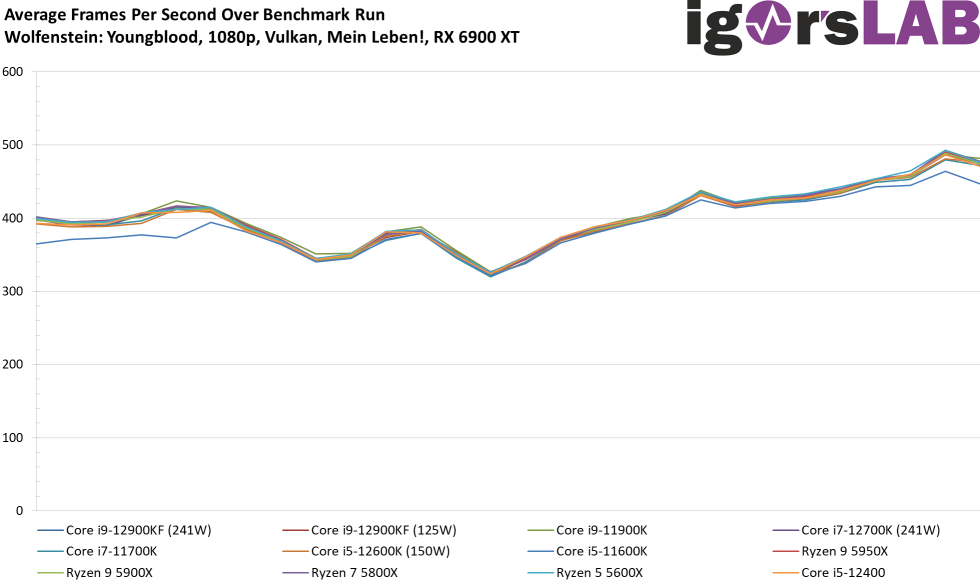
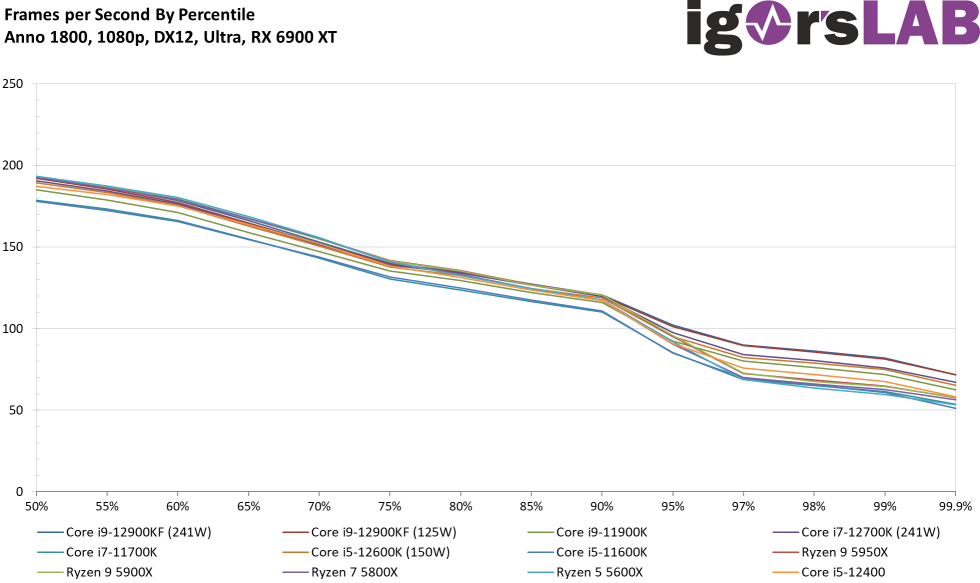
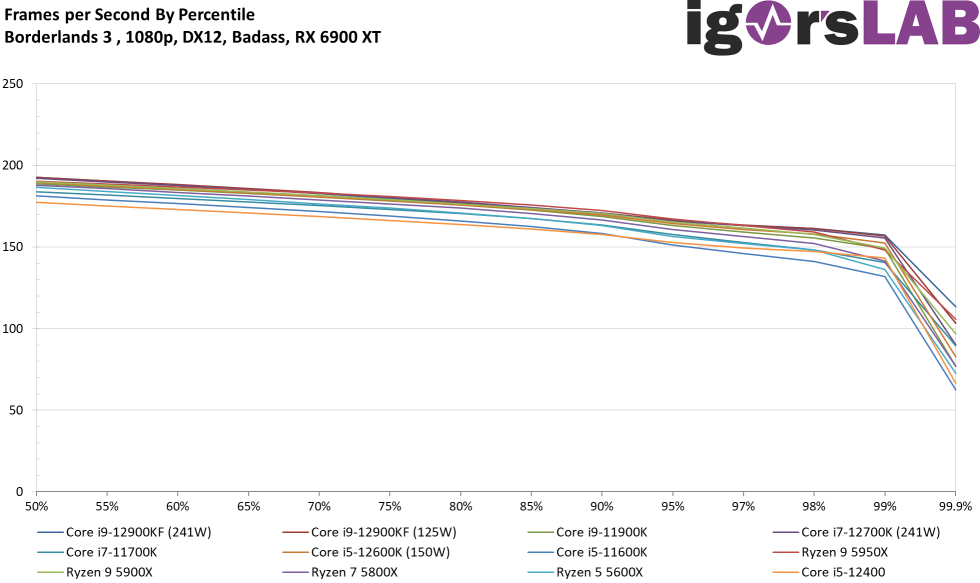
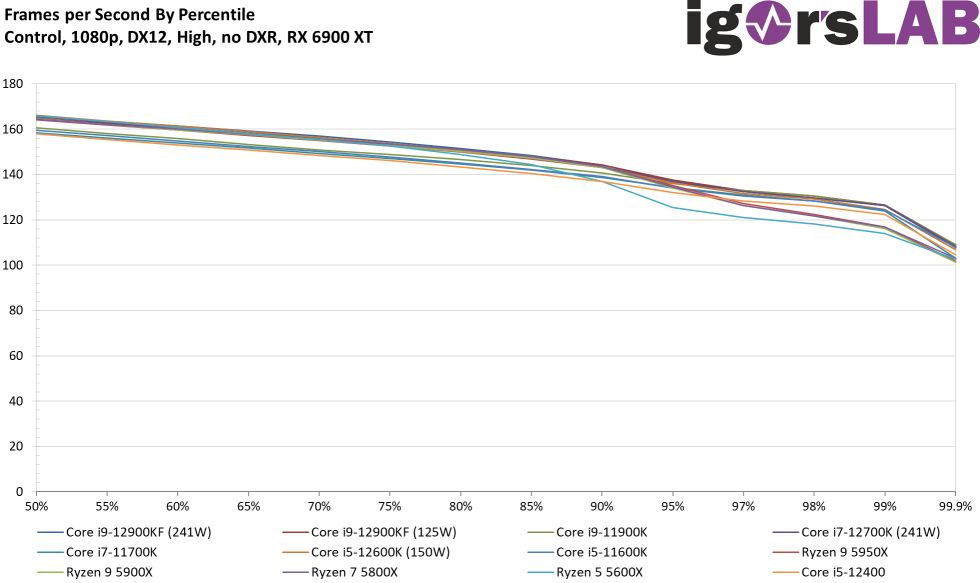
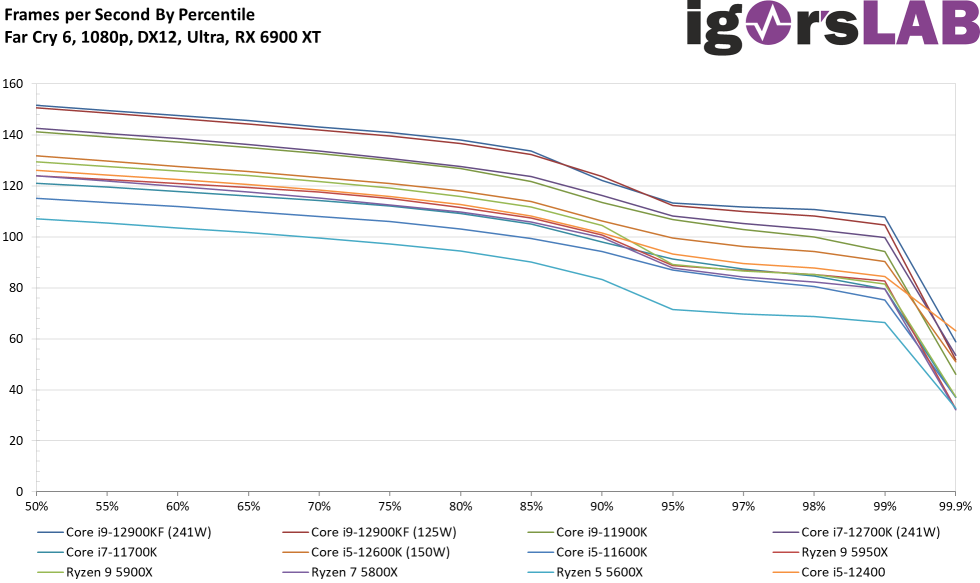
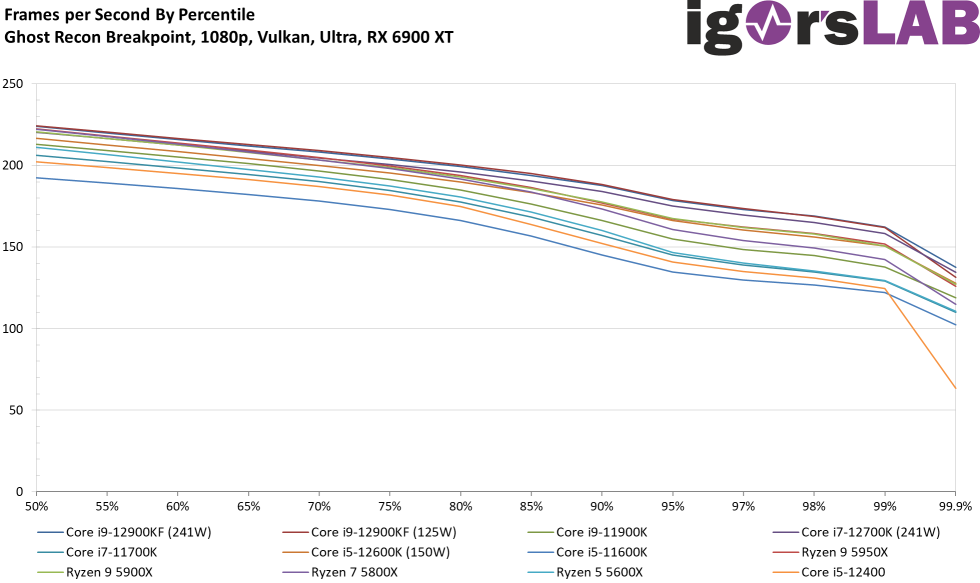
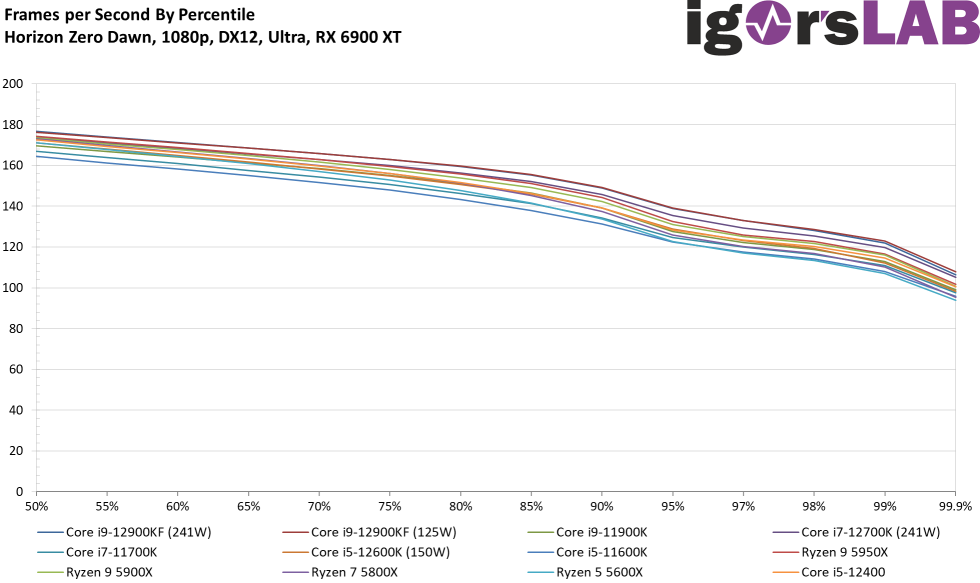
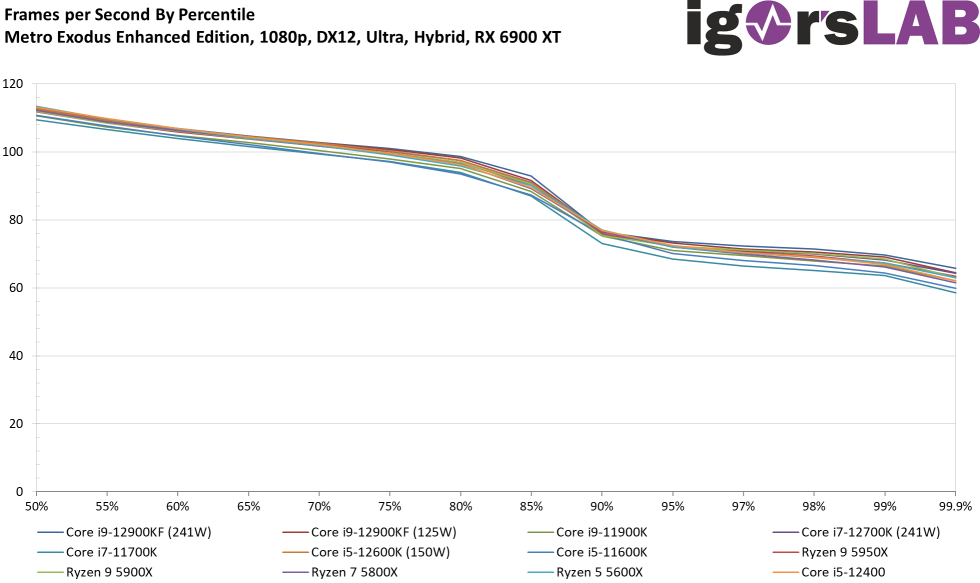
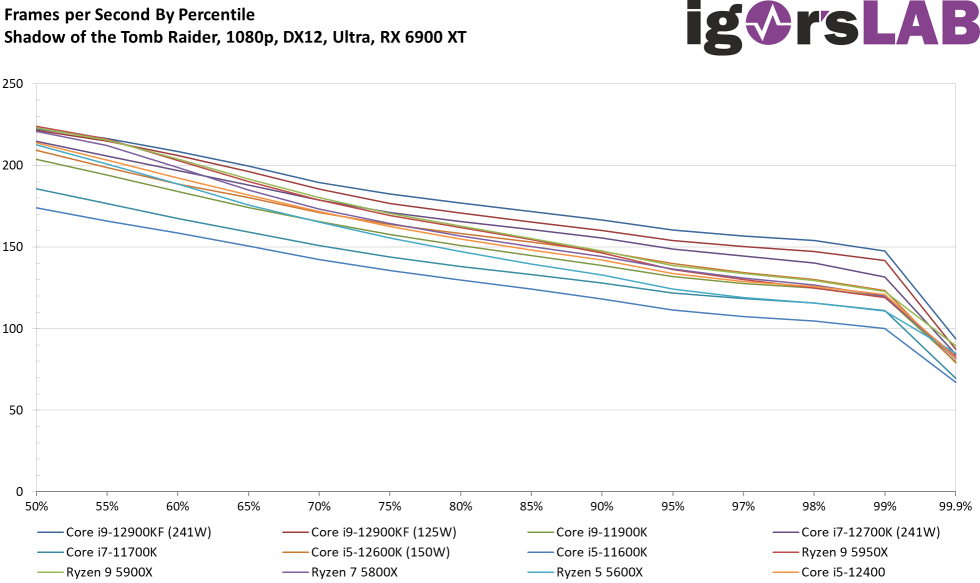
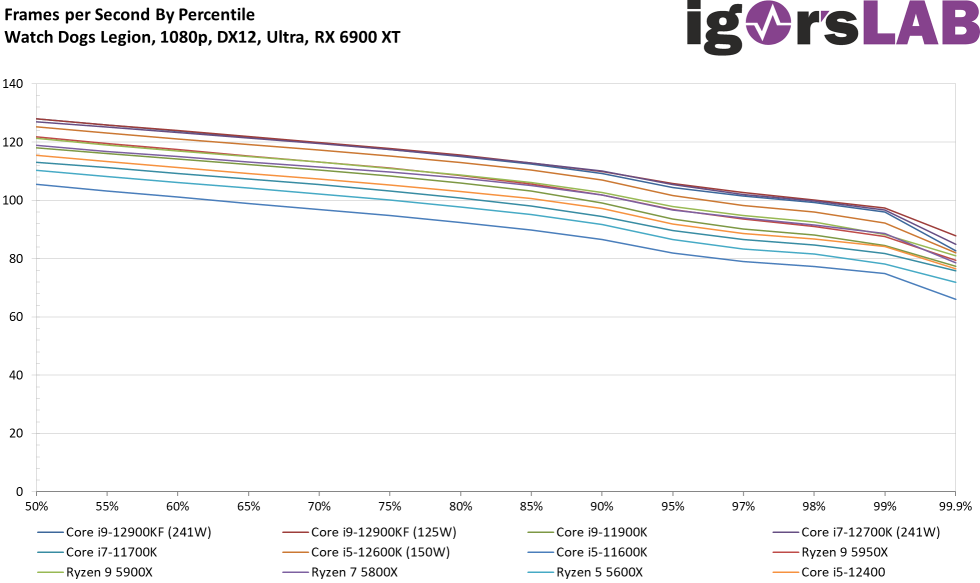
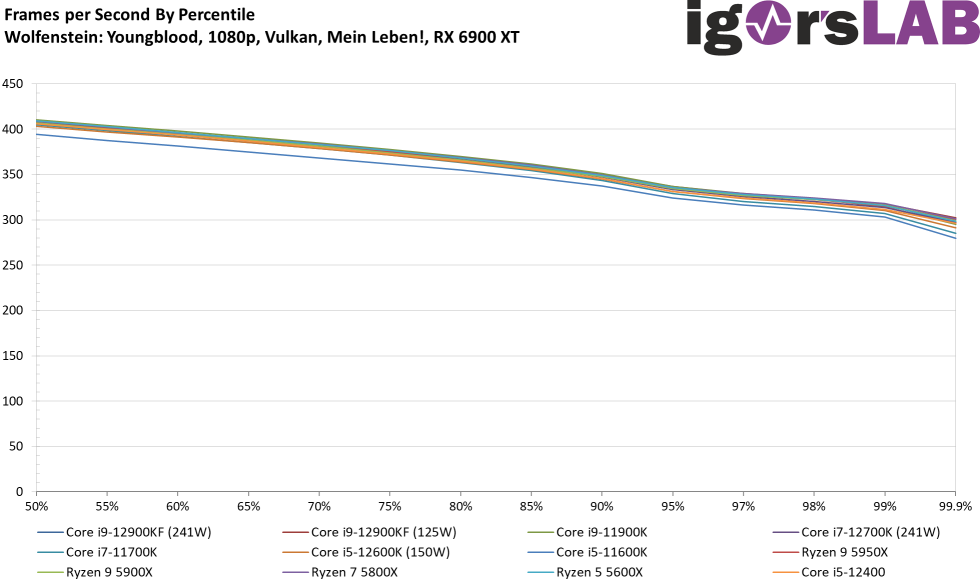
The whole thing now again as a curve with the well visible load distribution over the whole run:
Which brings us back to percentiles. And that’s where you’re actually interested not only in the P1 (1% low), but actually the whole rest of the process. From 97% upwards there is also a kink, which is usually only seen from the P1 (99%) in most graphics card tests:
The frametimes have changed slightly, but are not as crucial as the actual progression.
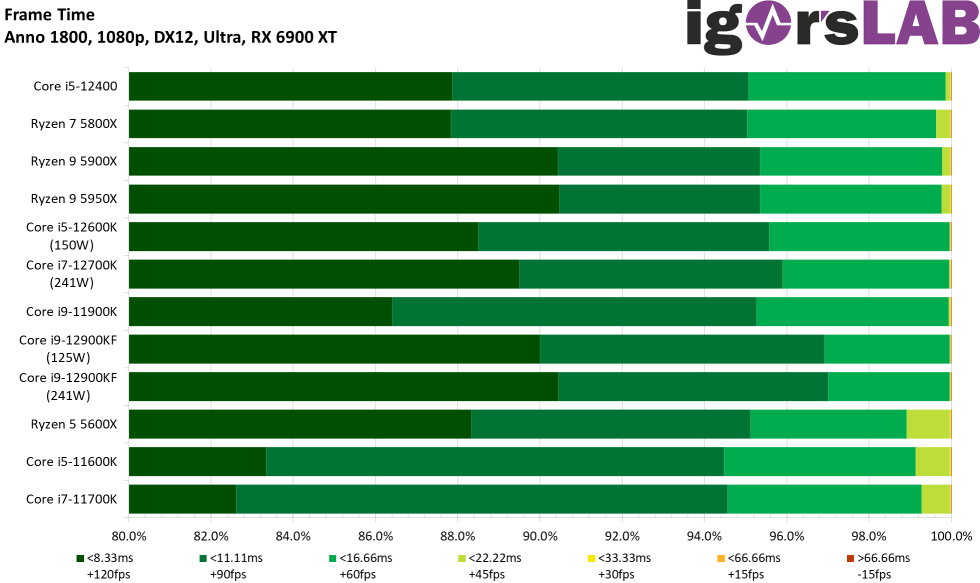
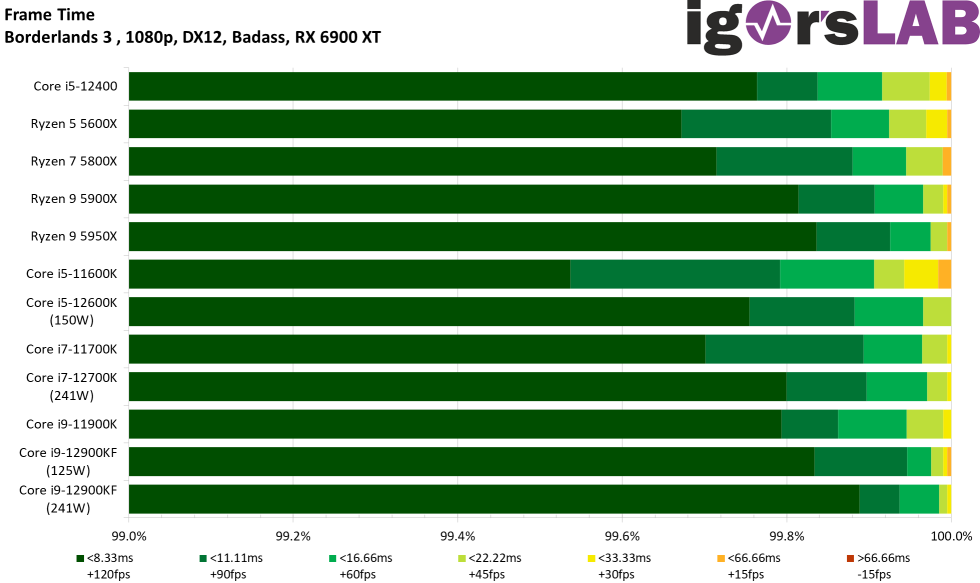
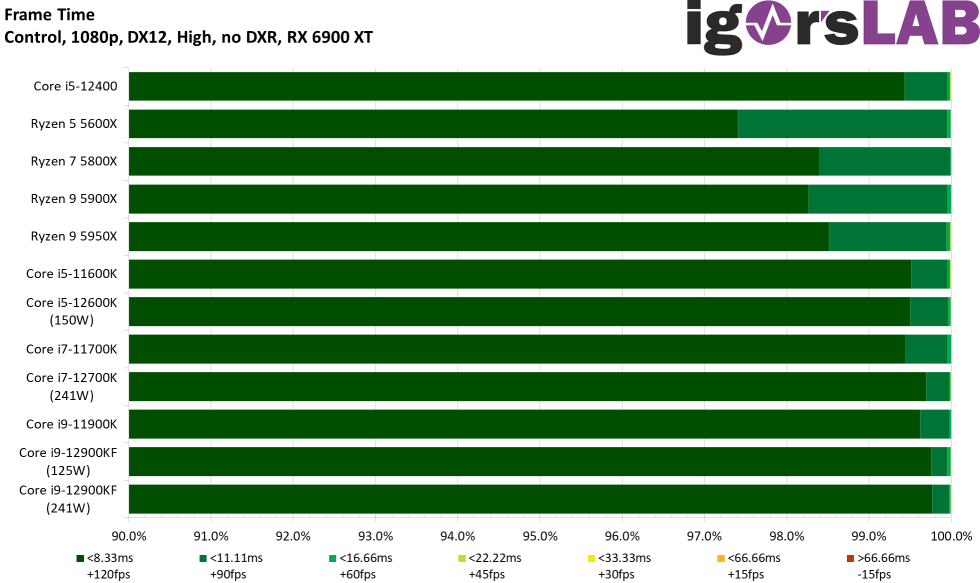
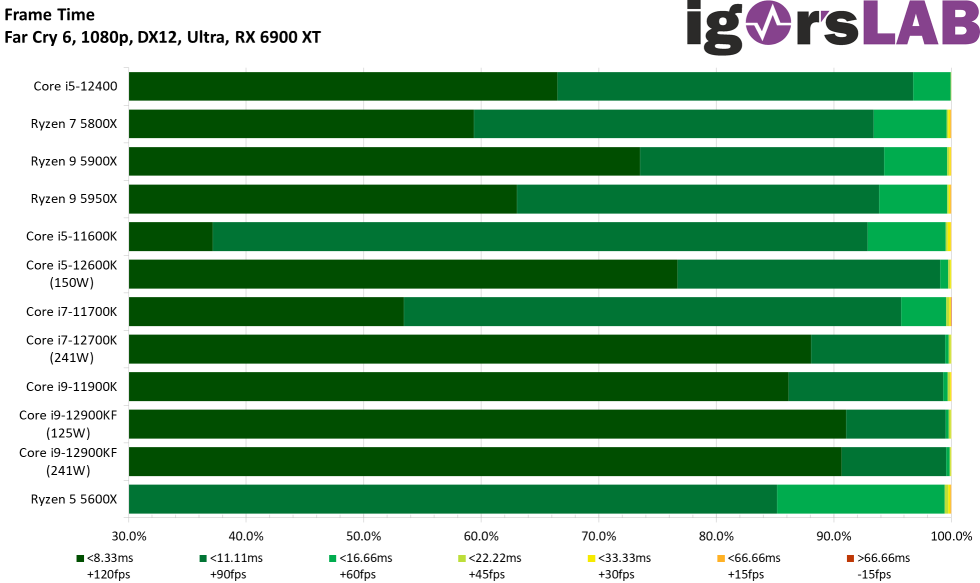
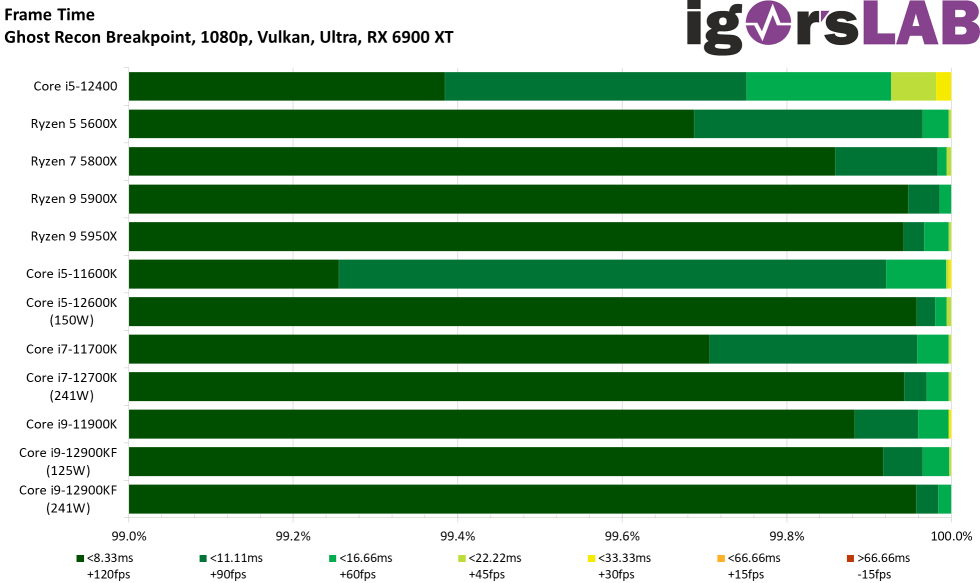
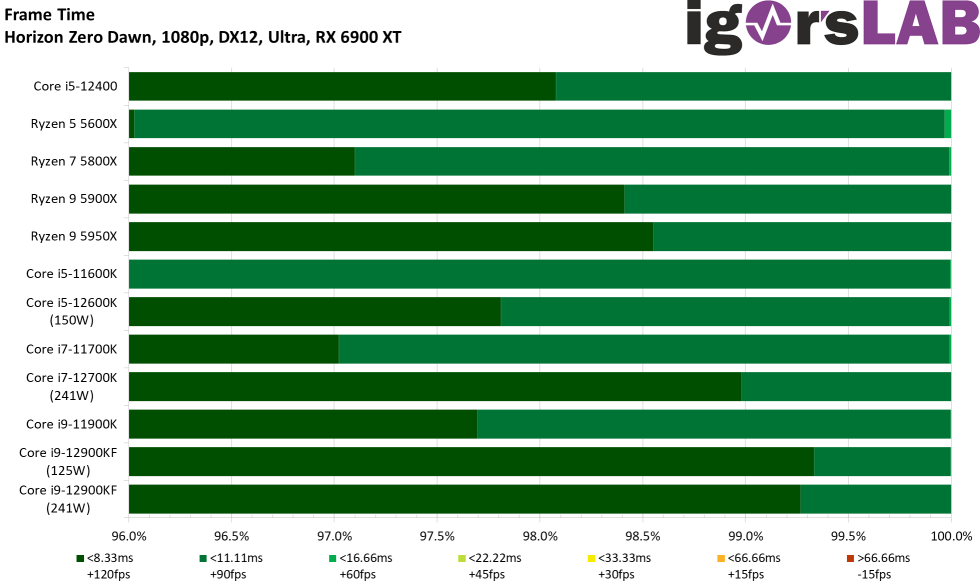
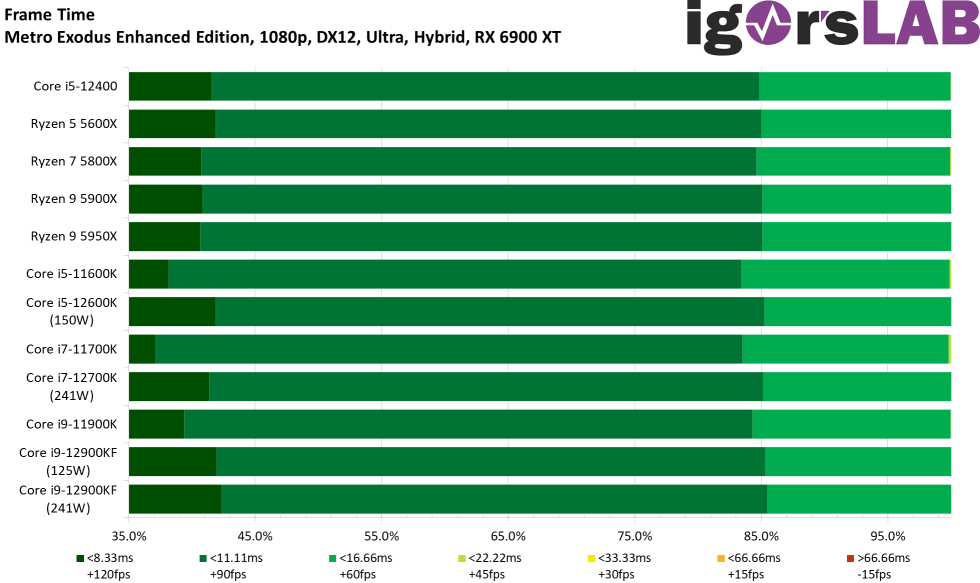
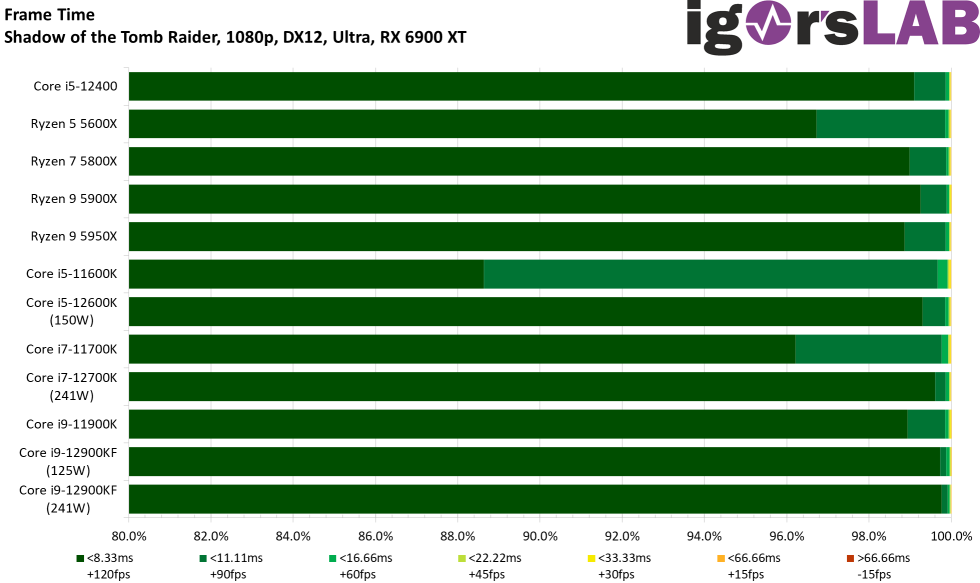
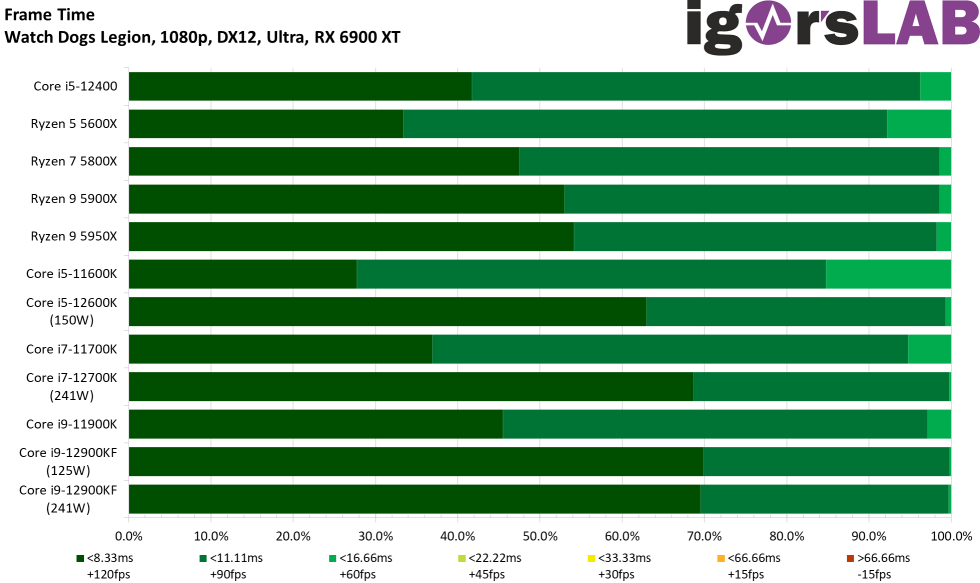
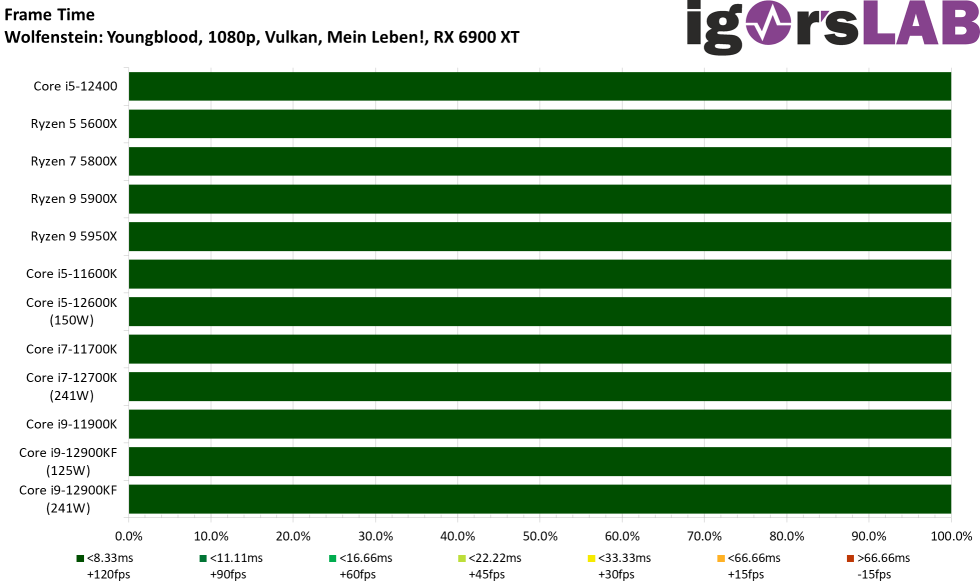
Because the frame times as such are again very good on all CPUs, we’d rather look at the variances again, that is, the signs of possible stutters that could bother us:
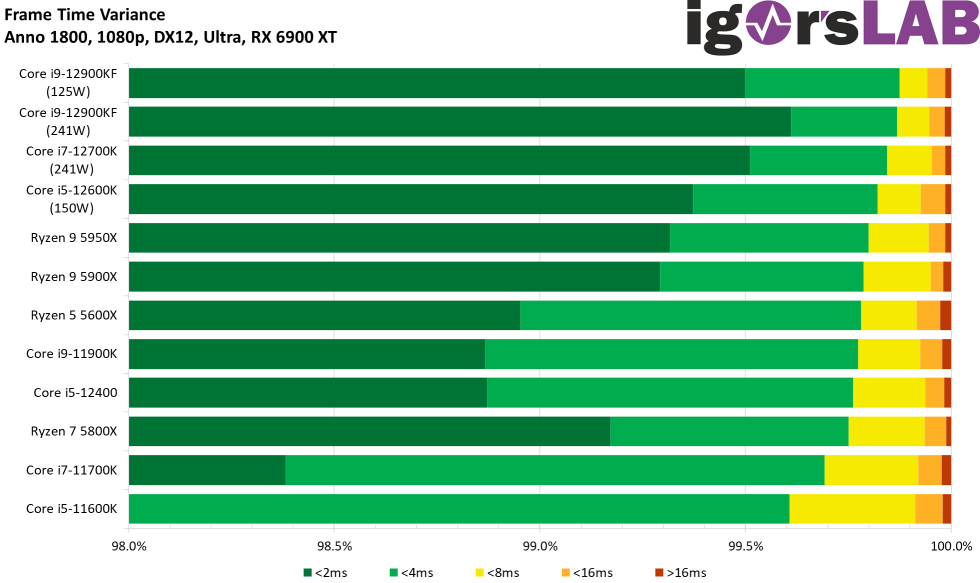
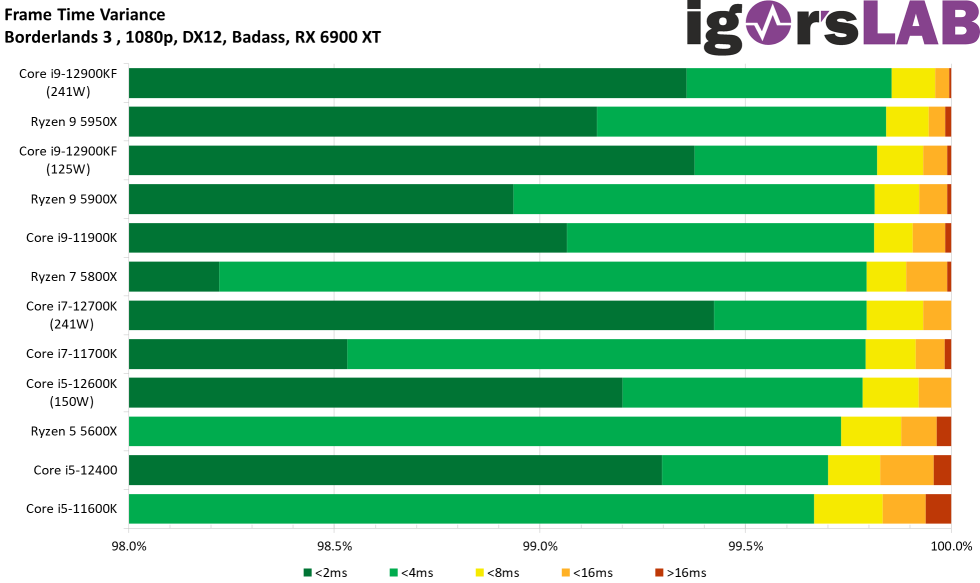
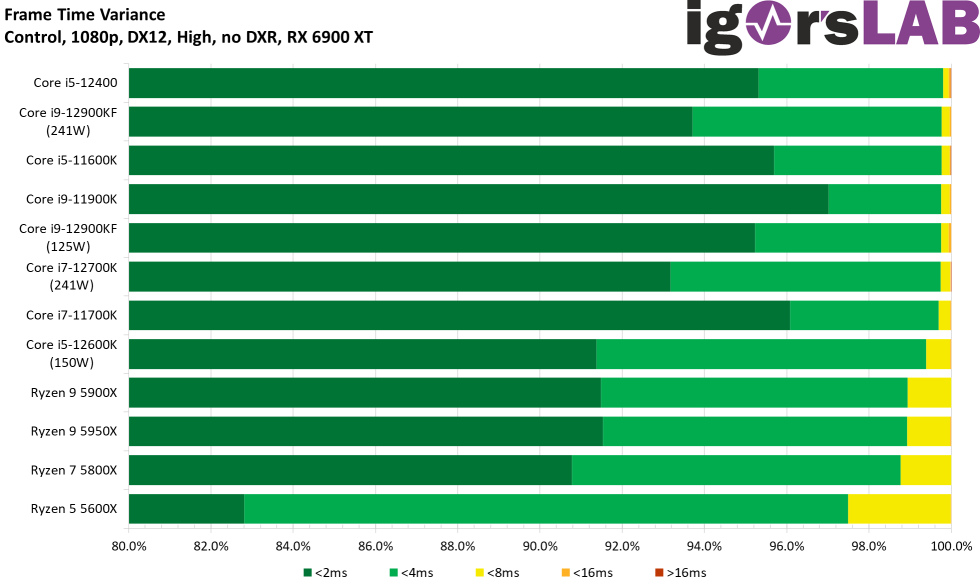
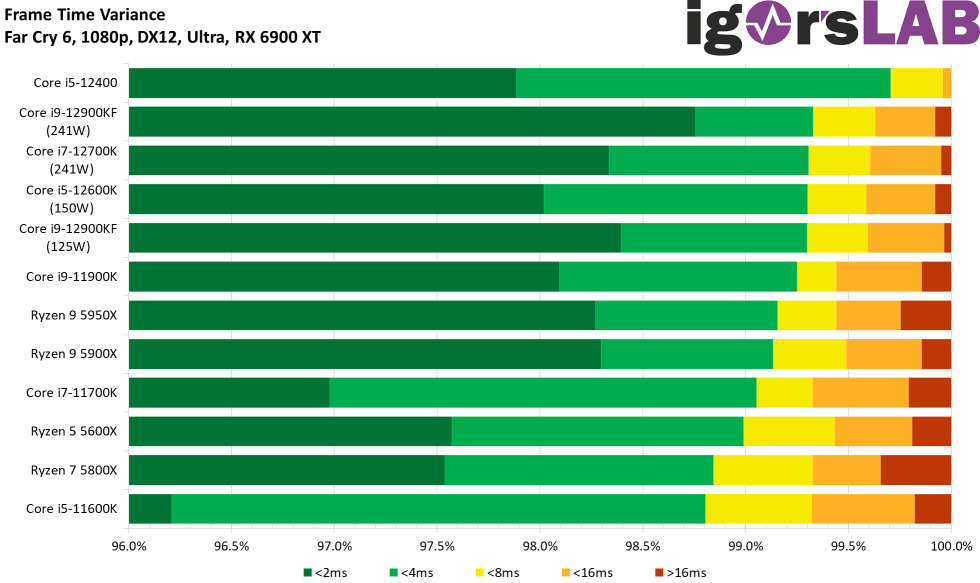
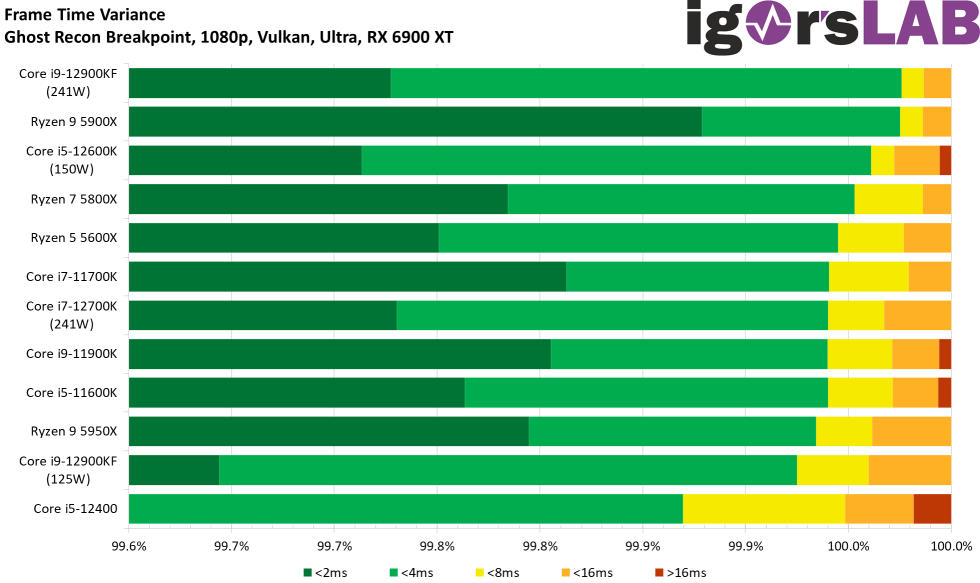
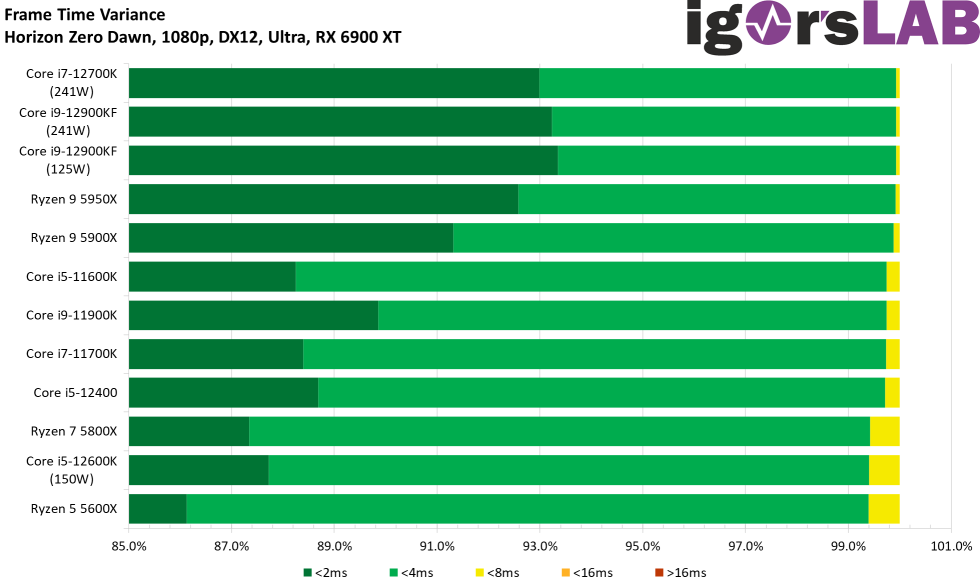
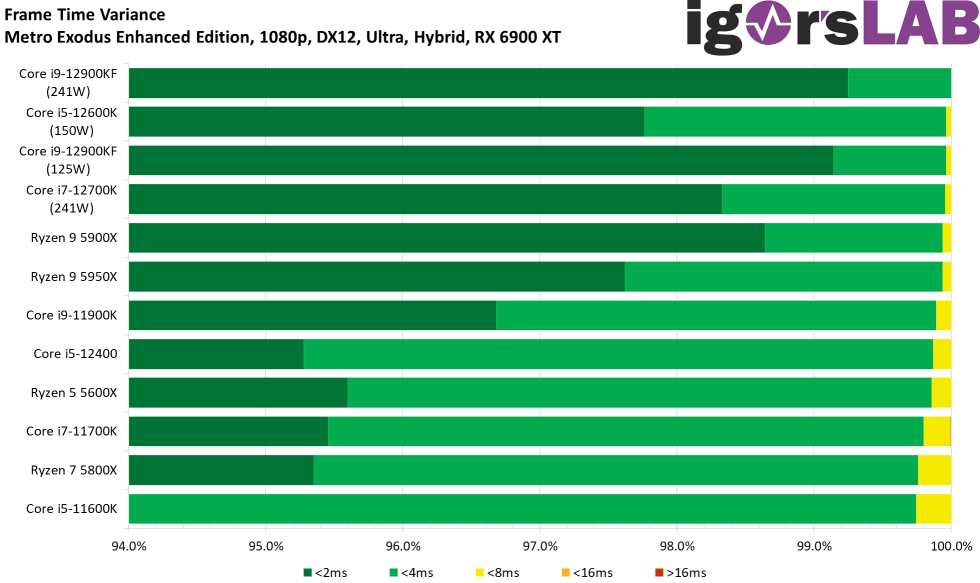
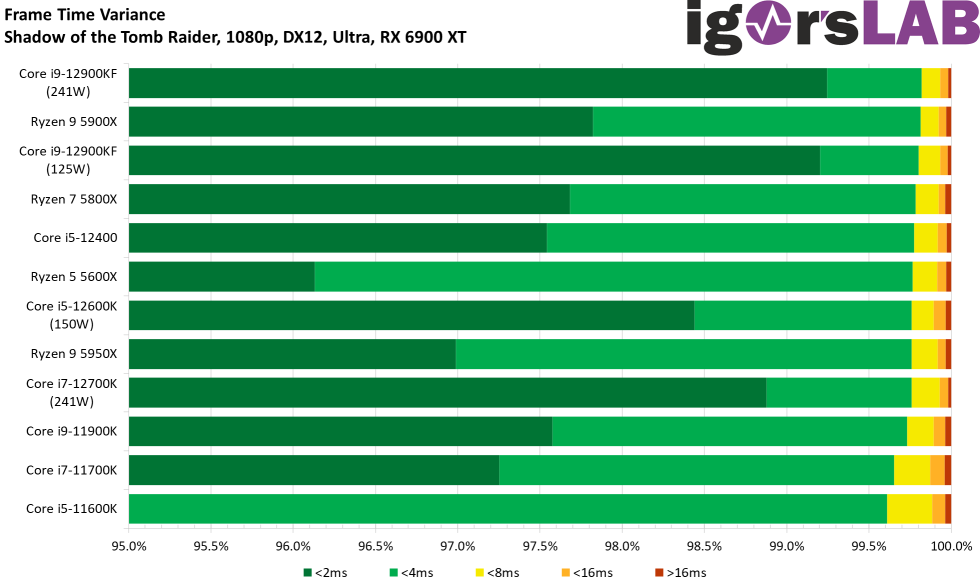
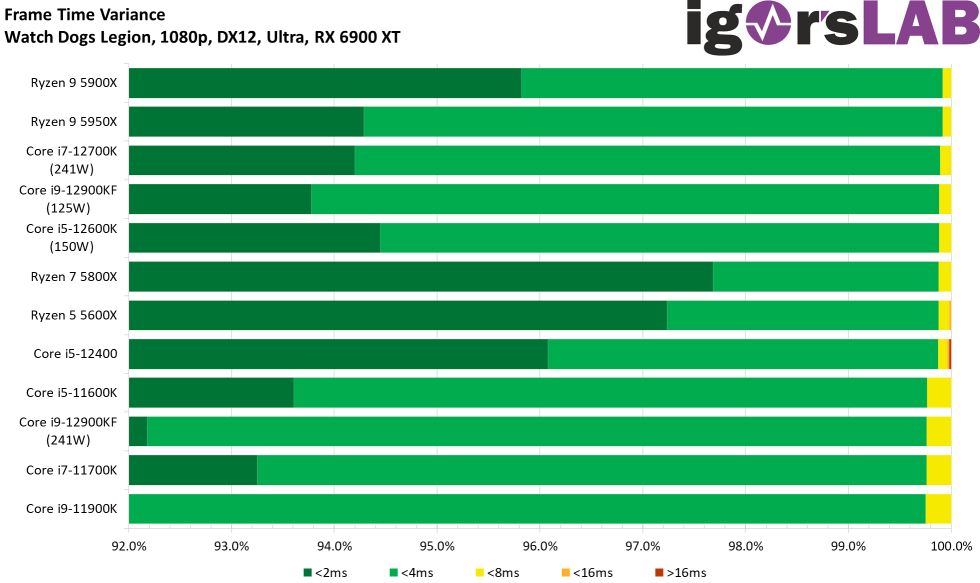
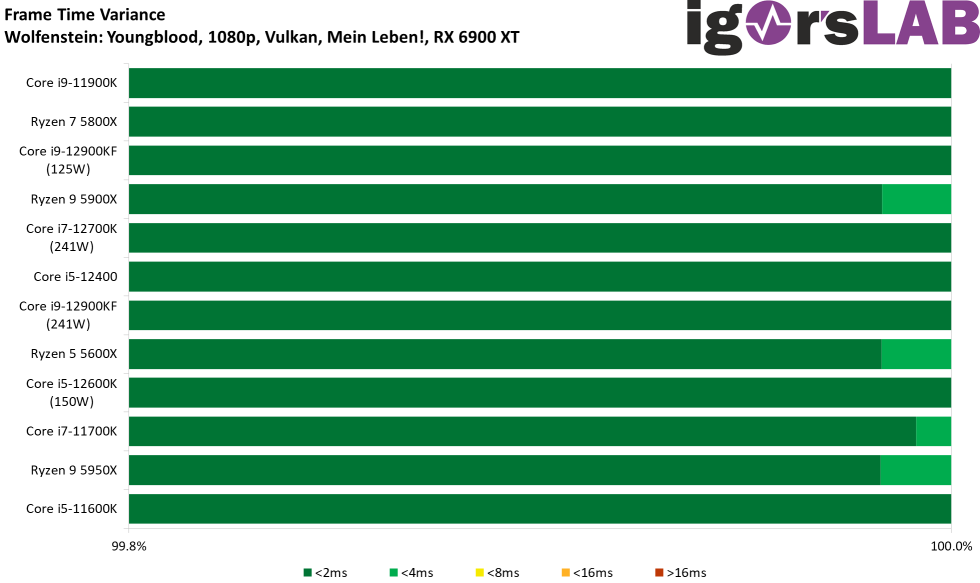
A cumulation of all games and values can be found later as usual in the summary and overview.

- 1 - Introduction, Test System and Methods
- 2 - 720p - Gaming Performance
- 3 - 720p - Power Draw and Efficiency in each Game
- 4 - 1080p - Gaming Performance
- 5 - 1080p - Power Draw and Efficiency in each Game
- 6 - 1440p - Gaming Performance
- 7 - 1440p - Power Draw and Efficiency in each Game
- 8 - Overall Gaming Performance and Comparison
- 9 - Summary of Power Consumption and Efficiency
- 10 - Conclusion and Final Words (for now)


39 Antworten
Kommentar
Lade neue Kommentare
Mitglied
Urgestein
Urgestein
Veteran
1
Urgestein
Urgestein
Urgestein
Veteran
Veteran
Mitglied
Veteran
Mitglied
1
Veteran
Veteran
Mitglied
Urgestein
Veteran
Alle Kommentare lesen unter igor´sLAB Community →