


Many consider Raptor Lake to be a simple refresh of Alder Lake in a slightly improved 7 nm process, but that is not quite right. Of course, Raptor Lake is not a new architecture and also benefits from a better yield, f.e. the memory controller with better clocks, but various changes have been implemented that can at least make the giant monolith a bit more efficient and faster. That is, the details are what really matter this time. I had already reported about Raptor Lake months ago, but a lot might have been lost in the media noise of the internet. But you can get really good information from the white papers. I have briefly rehashed this for you today. After all, the higher clock rate doesn’t come completely out of the blue, and better manufacturing alone wouldn’t achieve that either. So let’s dive into the theory again for a moment before we look at the result of these changes in the benchmarks.
Intel’s IMPV9.1 for Alder Lake S and Raptor Lake S
For those who don’t know, IMPV, or Intel Mobile Voltage Positioning, is a technology that dynamically adjusts the processor voltage (VCC) based on processor activity to reduce the power consumed. It allows a higher processor clock frequency for a given power consumption or a lower consumption for a given clock frequency, as the case may be. The new iteration IMPV9.1 introduced with Alder Lake S is not a real revolution compared to IMPV9 from Rocket Lake S, but it is an important iteration that improves many details. And Raptor Lake can even step it up a notch.
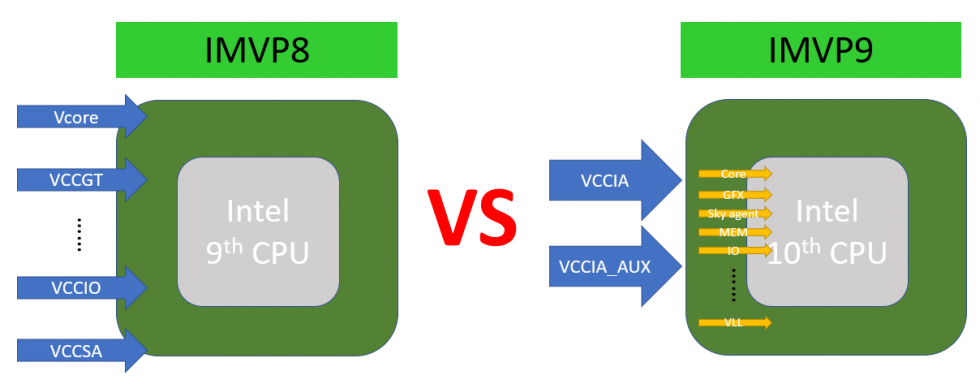
New is the support of two VID tables with 5 mV and 10 mV resolution and the support of Iout with values above 255 amps. In addition there is an analog AUX imon input on the 0x0Dh domain. There is also a change to the fast Psys counters and peak detector to support both Psys and Vsys measurements independent of the old Psys ADC input. IMPV9 was already present at the 10. This is a big step forward compared to IMPV8, which we still know from the CPUs of the 9th generation. Generation know. Even if lines are added for Raptor Lake S that have not yet been drawn in here, this graphic already gives a good overview:
The PL4 and the innovations
However, now it gets interesting, because in addition, Raptor Lake now changes the PS4 performance definition: Processor Pmax, Never Exceed and Limit. All this is calculated “a priori” and is therefore a real PROACTIVE limit (through differentiated advance planning and targeted interventions, the result itself is planned and achieved). PL1 and PL2 refer only to the average power and are therefore REACTIVE limit values, where only values can be reacted to retroactively. The mysterious PL4 as in Alder Lake referred to peak power events that could only be handled PROACTIVELY so far, and often never turned out quite optimal in the end.
A new, REACTIVE PL4, on the other hand, is the ideal solution, keeping SoC frequencies as high as possible, but with a safety net based on Fast PROCHOT#. This is a digital output pin that has been around since Intel’s Pentium 4 processors and indicates that the internal thermal control circuit has been activated. This happens when the processor has reached its maximum safe operating temperature. The SoC frequency is still determined by the PL4.
When PROCHOT# is enabled, the total power of the SoC is always BELOW PL4_Safe, i.e. it is lower than the value set for the PL4. PL4_Safe thus represents the level of peak power that the input power sources can deliver without fear of, for example, brownout or damage to the battery in the notebook sector, or in general overload of the supply and the interconnected components. Fast PROCHOT# is really fast. Vsys1 is monitored by the IMPV9.1 controller and PROCHOT# is activated within 2 μs (adjustable) after the threshold is exceeded. The CPU is then already throttled 1μs later. Fast PROCHOT# thus enables a higher PL4, resulting in better responsiveness down to low load conditions while maintaining system stability, but also produces harsher load changes.
However, one of the most important pieces of information is the interval of PL4. Here this state can last up to 10 ms, but never longer.
This is also extremely important for sizing the protection circuits in the power supply. The 10 ms is definitely a challenge and many a power supply will have to be redesigned in this respect. Companies such as be quiet! have been using an interval of 20 ms for years, so here you should rather be on the safe side if the current strength can also be delivered. We’ll see just how high the PL4 really is for Alder Lake S and also Raptor Lake S in a moment.
The Potential Peak Power (PPP)
The PPP is an expected worst-case power level calculated by the Power Control Unit (PCU) based on component characteristics and the current operating frequency (IA, GT, ring domains). This happens before each frequency transition (usually at 1-ms boundaries), or whenever AVX instructions enter the pipeline or when a core C state change is imminent. PPP assumes a scenario across domains that represents the most intensive known application.
So what does this mean in the context of the PL4? Quite simple: the PL4 is the limit value to which PPP is finally compared! If PPP is > PL4 at the frequency transition, a lower frequency is selected to prevent PPP from exceeding PL4. PPP is in the by the way a pure projection and is NOT based on the power telemetry of the current workload. The PPP projection is also not displayed via a software interface, but only used within the PCU.
The absolute peak power can thus only be reduced preventively via the PL4 settings.
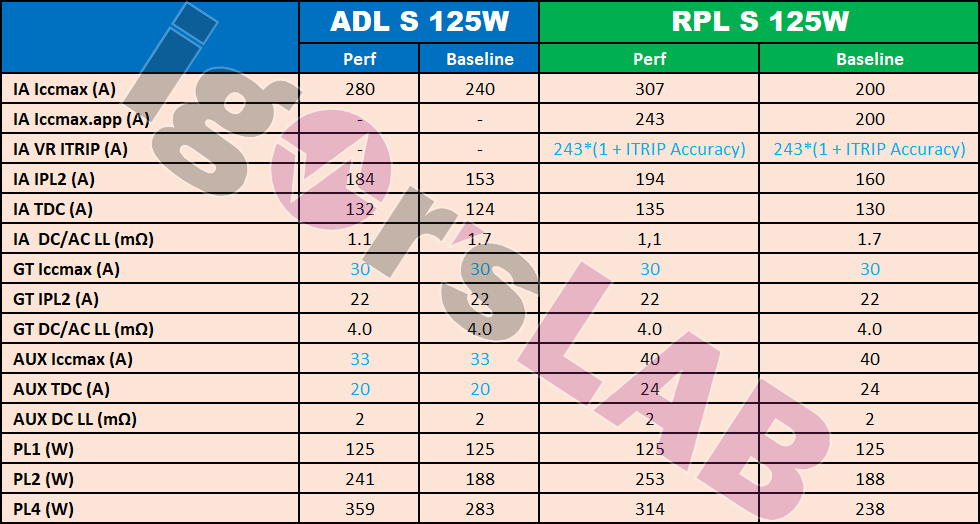
Now we come to the interesting part, which can only be properly classified if you have carefully read the short introduction to IMPV9.1 above. Let’s first look at the 125 watt class of the Core i9-13900K, where PL1 is known. PL2 was 188 watts at Alder Lake S (ADL S) and could increase to 241 watts in the performance scenario, depending on the situation resulting from the power telemetry. For Raptor Lake S (RPL S), the PL2 in Perf (Performance) now even increases up to 253 watts, but the baseline again remains at 188 watts. And what does the PL4 do as an interval with a maximum duration of 10 ms? The baseline is 238 watts for both CPU generations and can rise to 359 watts for ADL S! RPL S, on the other hand, is a bit more frugal with 314 watts. It can be seen that the PL2 is higher for RPL S and the PL4 is somewhat lower than for ADL S. This is interesting in any case.
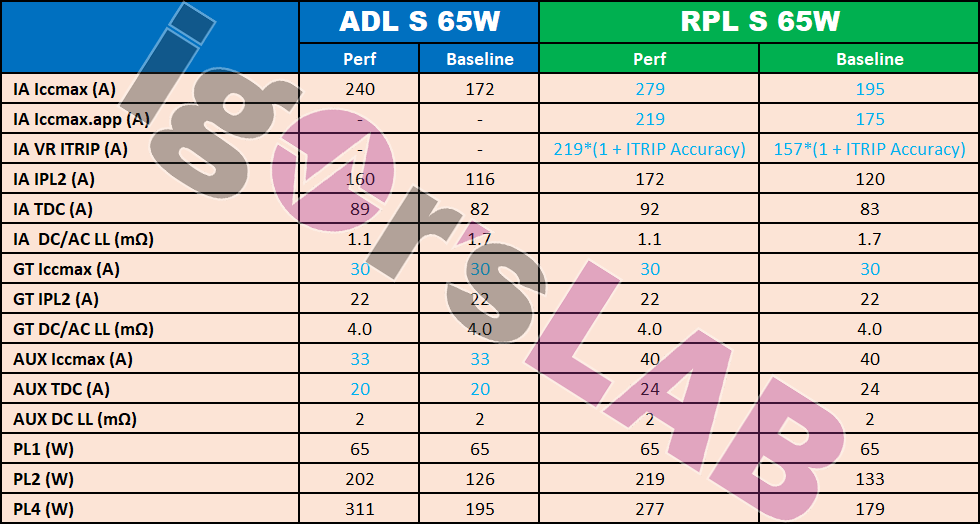
This case is repeated in the power class below, because the PL1 is the same for both, but the values for PL2 and PL4 differ more here. This is because the baseline is now also different. For PL1 and PL2, baseline and perf are generally higher for RPL S than for ADL S, whereas PL4 is generally lower. The extreme power peaks thus become much more moderate with RPL S, while the rest increases.

- 1 - Introduction, preface and CPU specs
- 2 - What's new with Raptor Lake?
- 3 - Test setup and methodology
- 4 - Gaming Performance HD Ready (1280 x 720 Pixels)
- 5 - Gaming Performance Full HD (1920 x 1080 Pixels)
- 6 - Gaming Performance WQHD (2560 x 1440 Pixels)
- 7 - Autodesk AutoCAD 2021
- 8 - Autodesk Inventor 2021 Pro
- 9 - Rendering, Simulation, Financial, Programming
- 10 - Science and Math
- 11 - Power consumption and efficiency
- 12 - Summary and conclusion


175 Antworten
Kommentar
Lade neue Kommentare
Veteran
1
Mitglied
Veteran
Mitglied
Veteran
Veteran
Veteran
Mitglied
Urgestein
Veteran
Mitglied
Urgestein
Mitglied
1
Urgestein
Mitglied
Urgestein
Veteran
Alle Kommentare lesen unter igor´sLAB Community →