


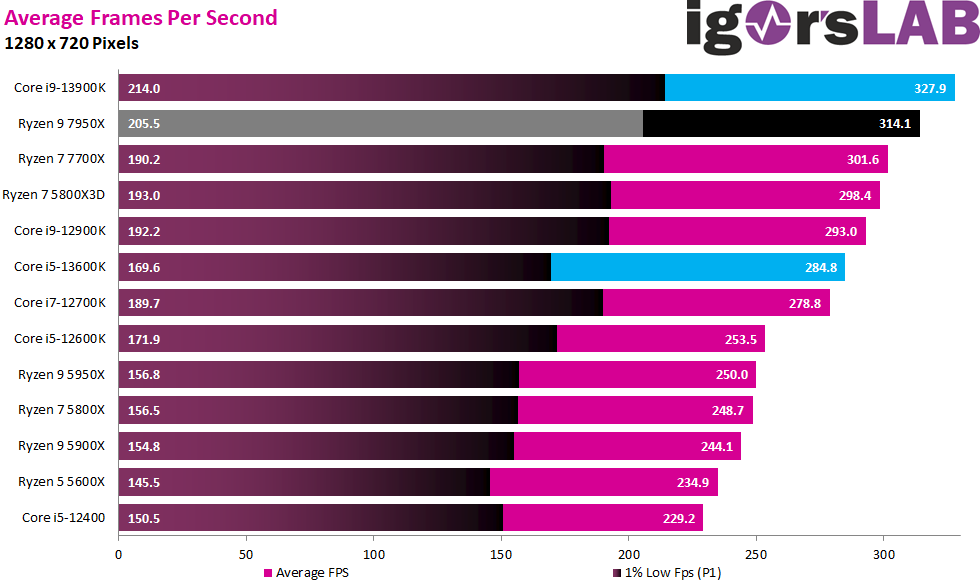
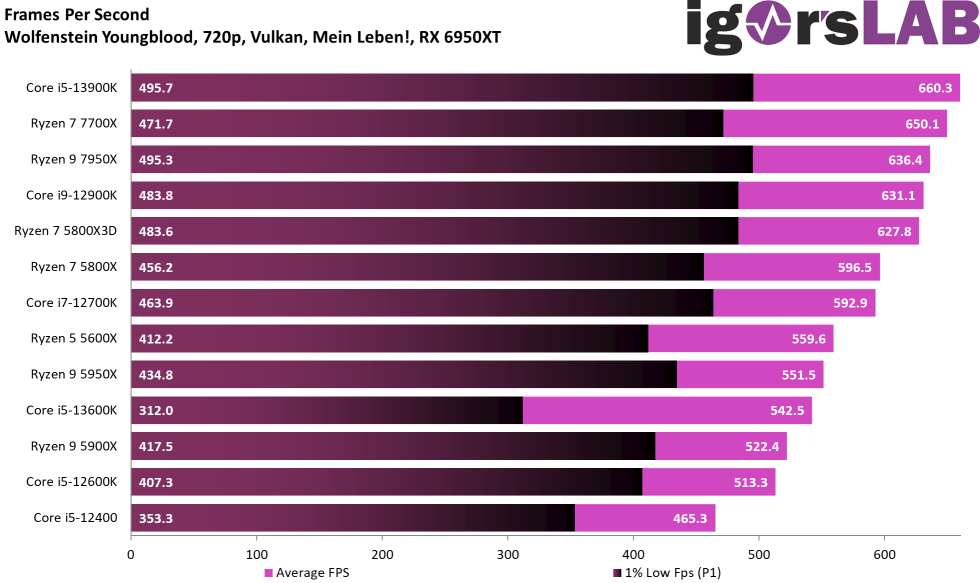
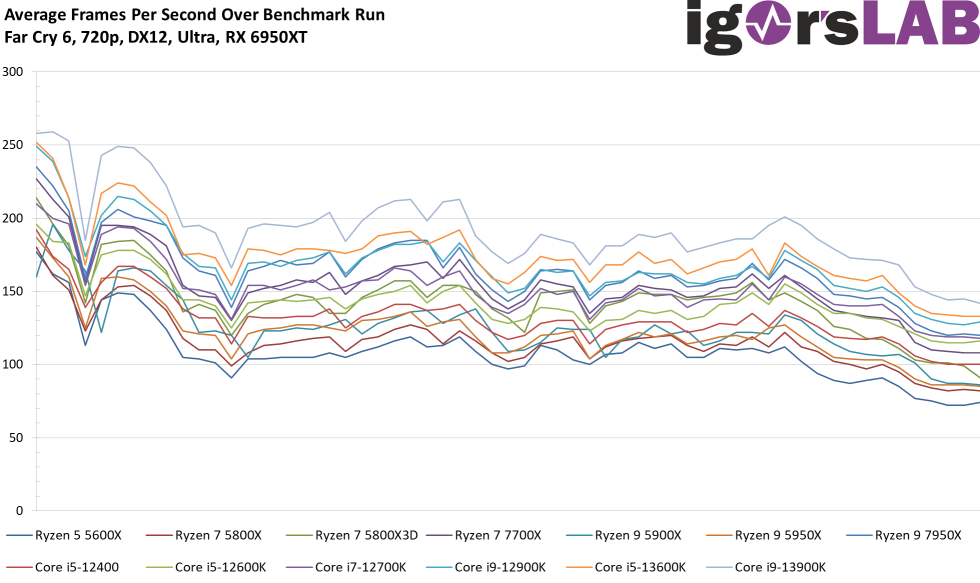
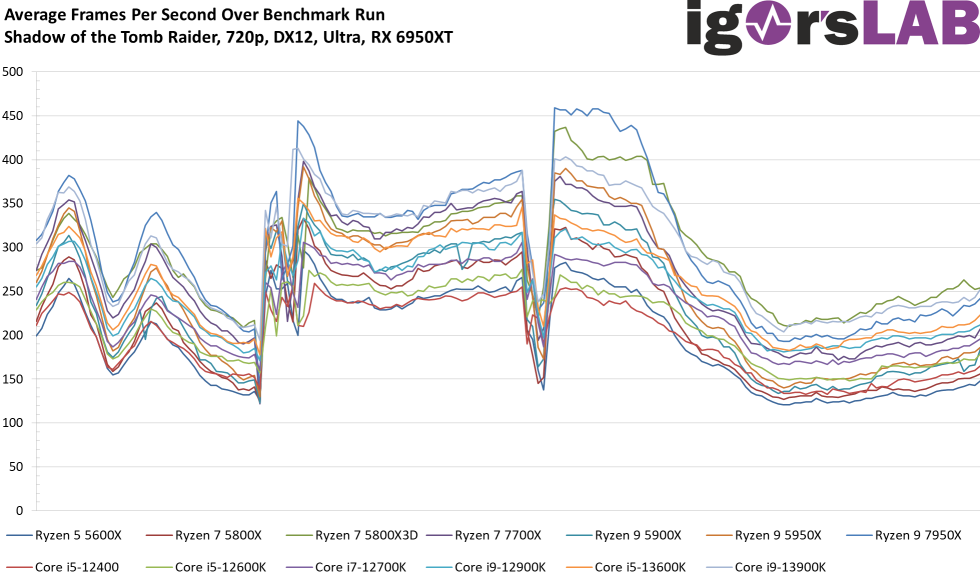
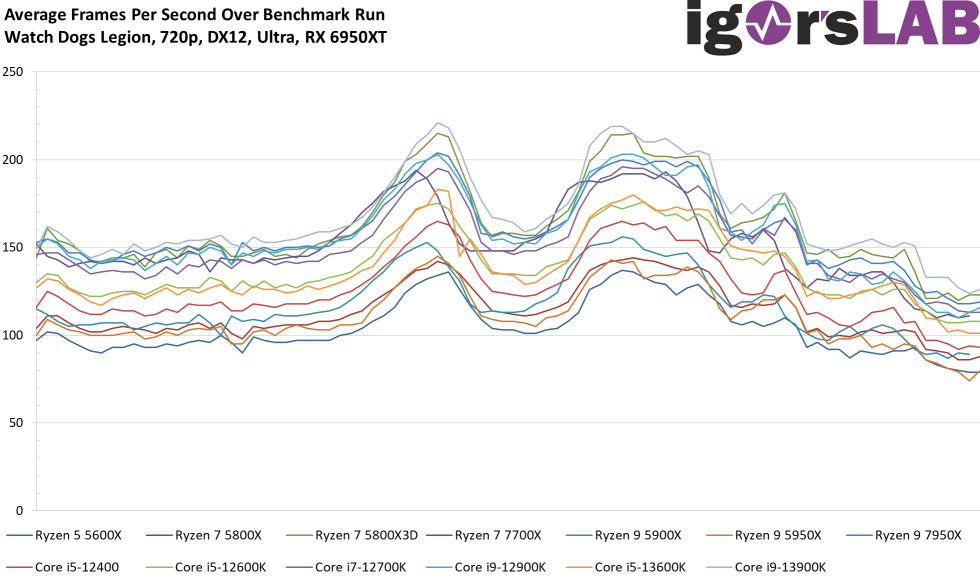
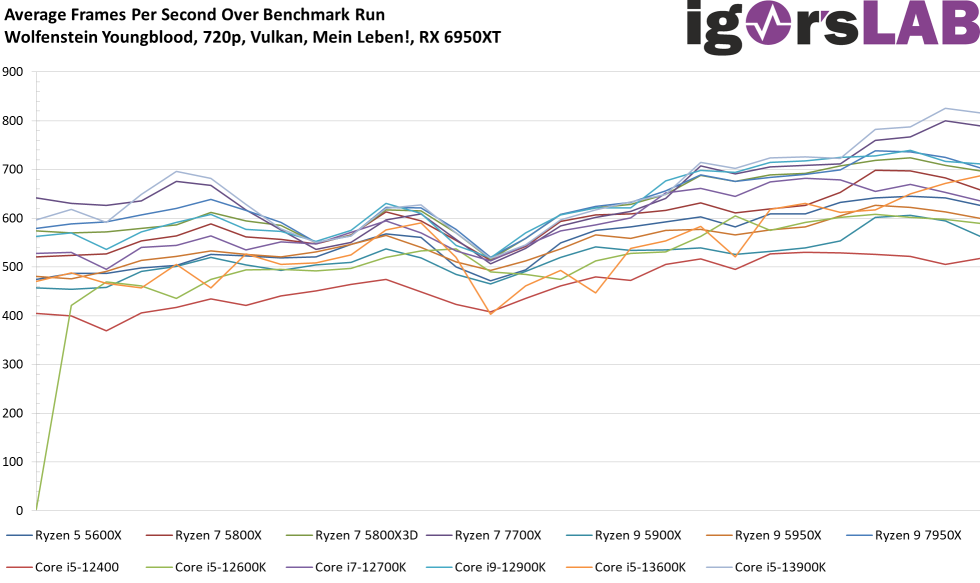
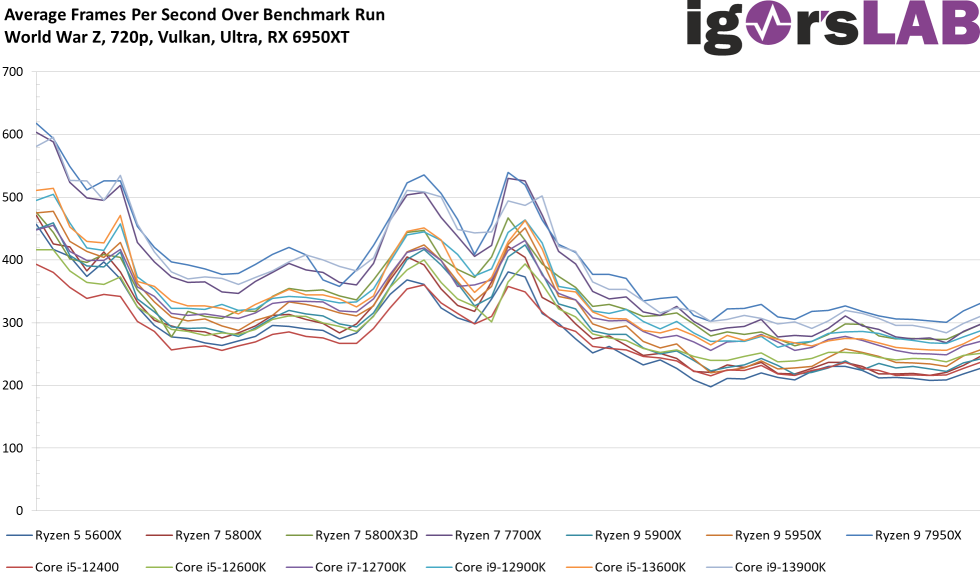
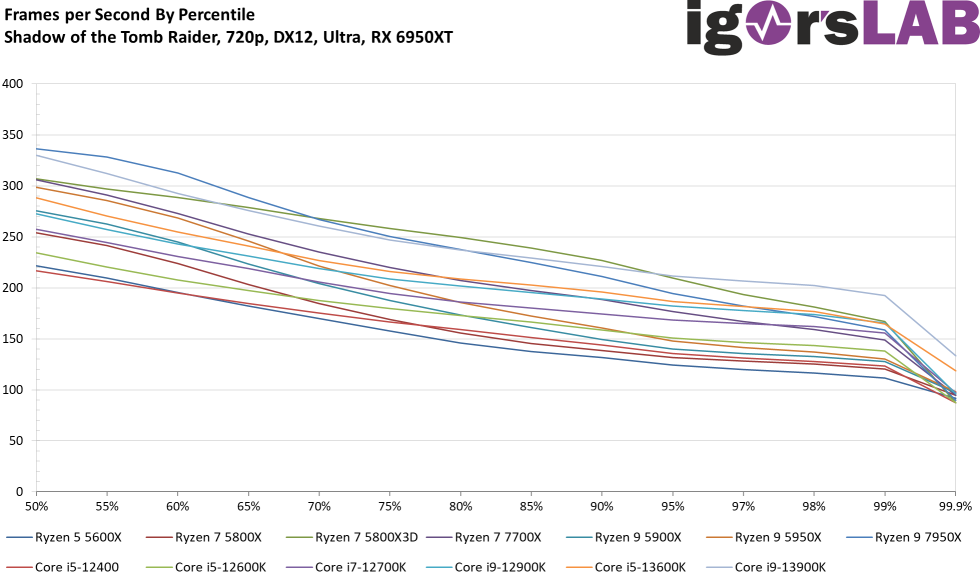
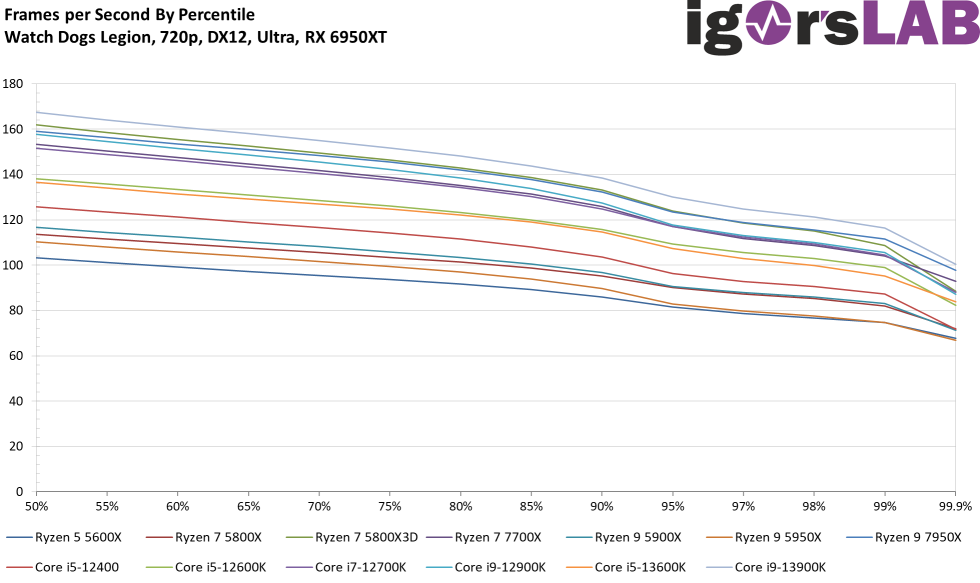
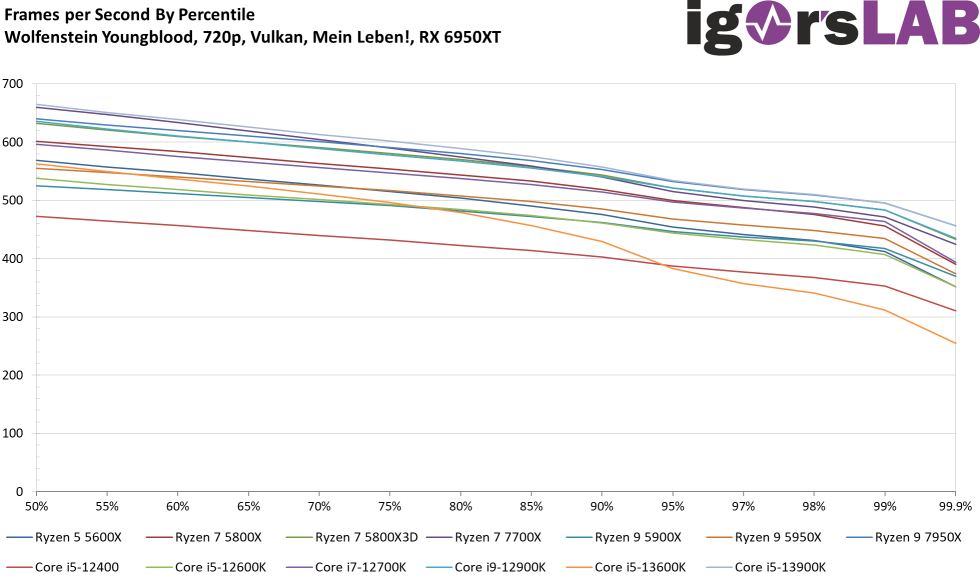
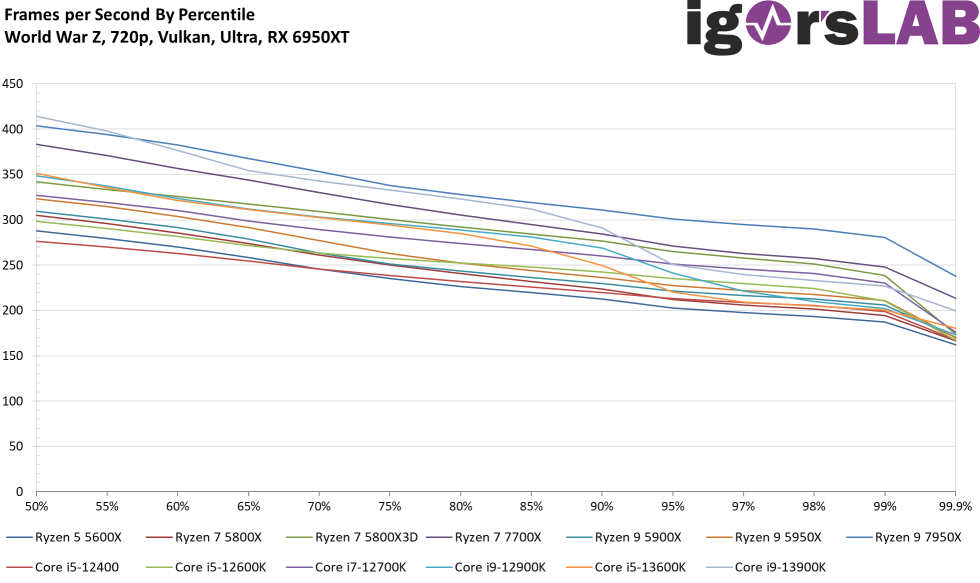
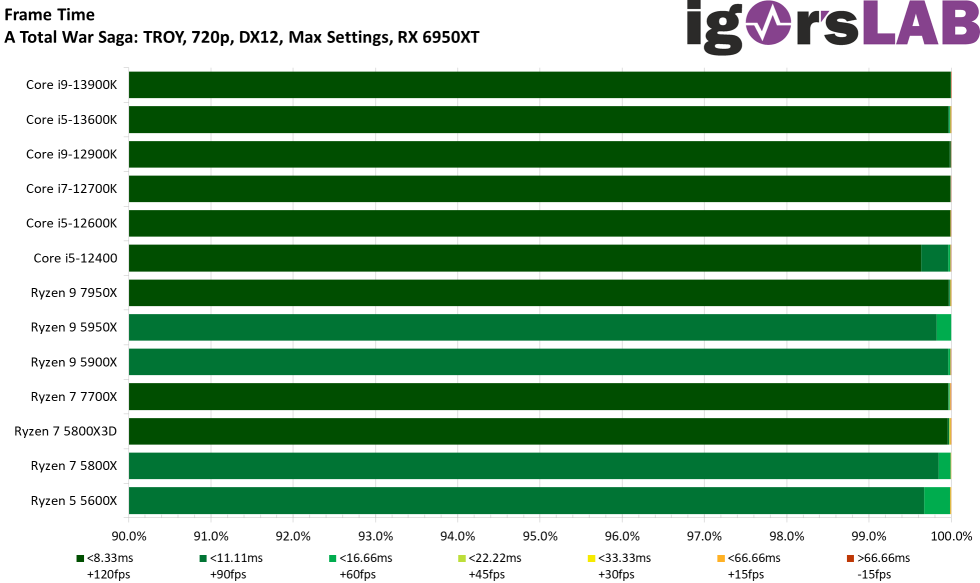
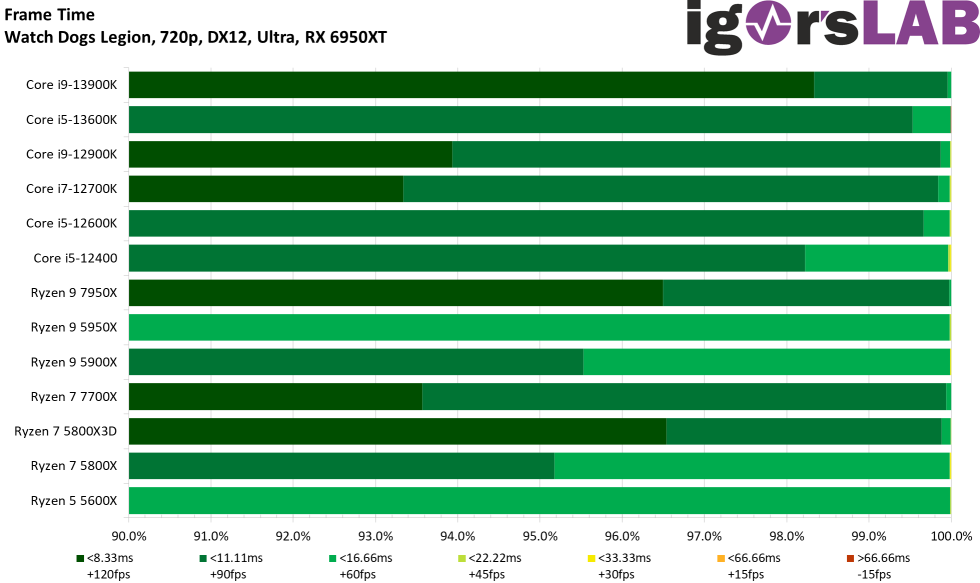
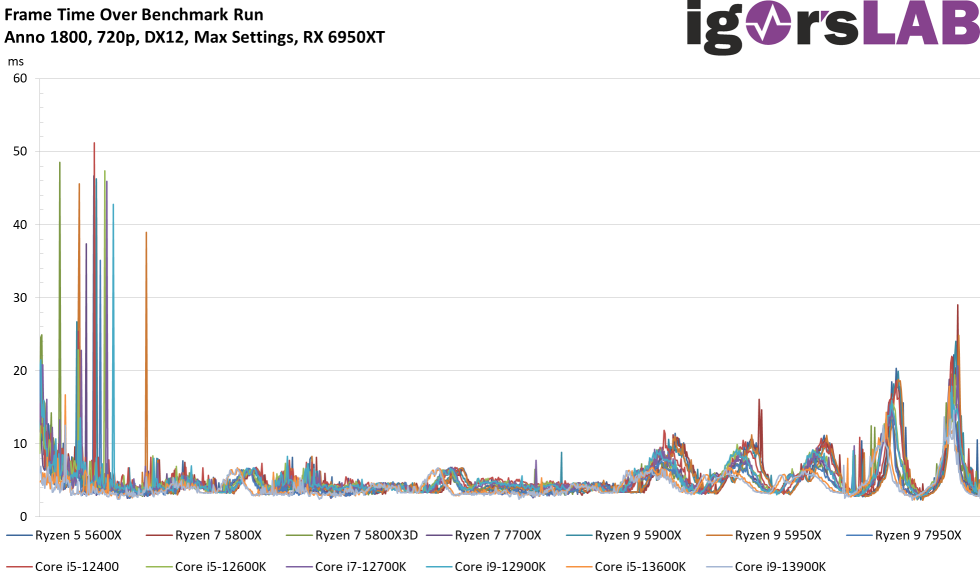
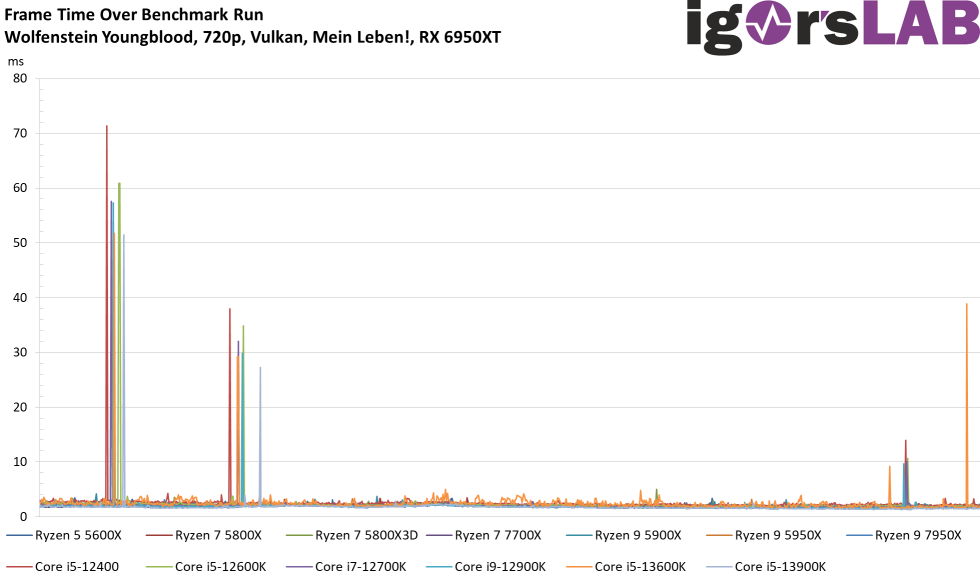
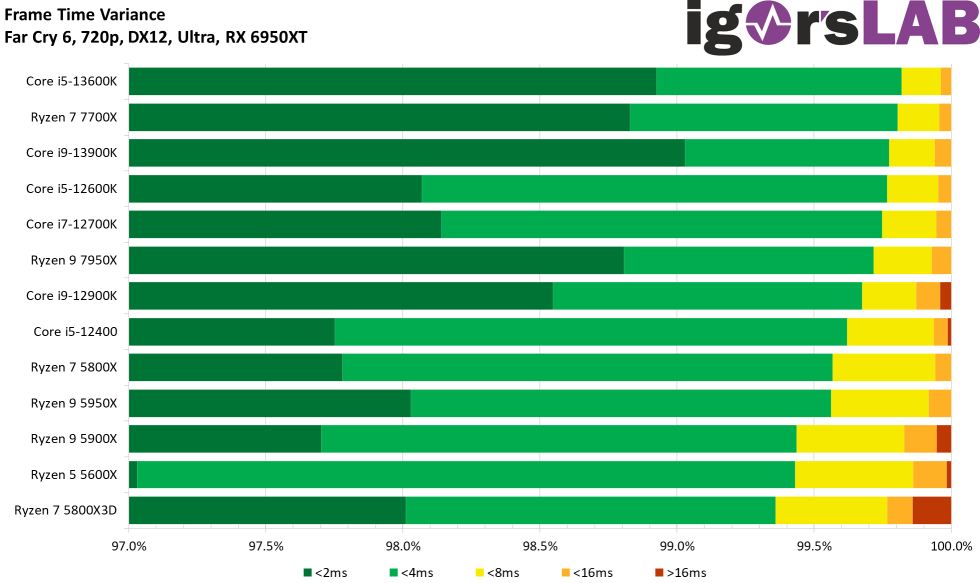
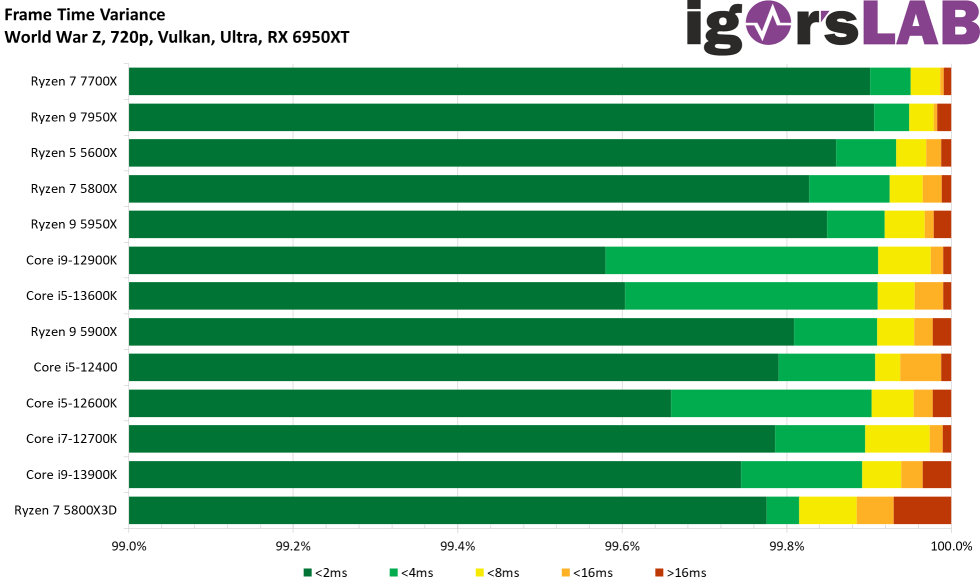
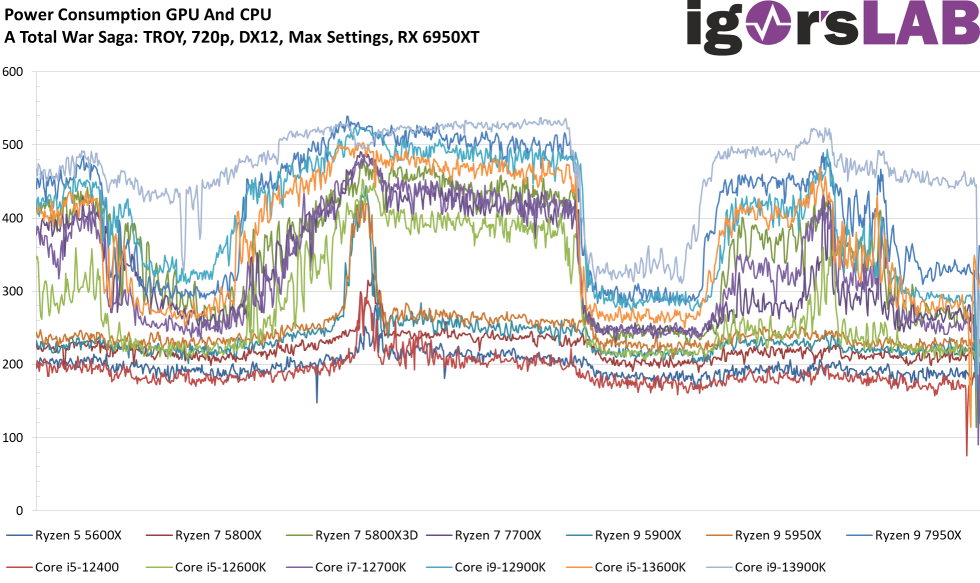
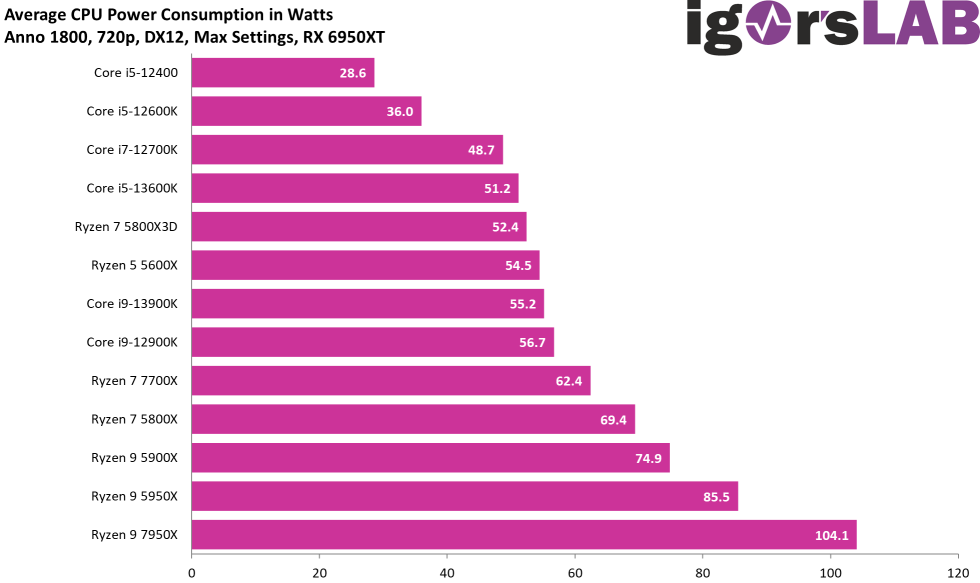
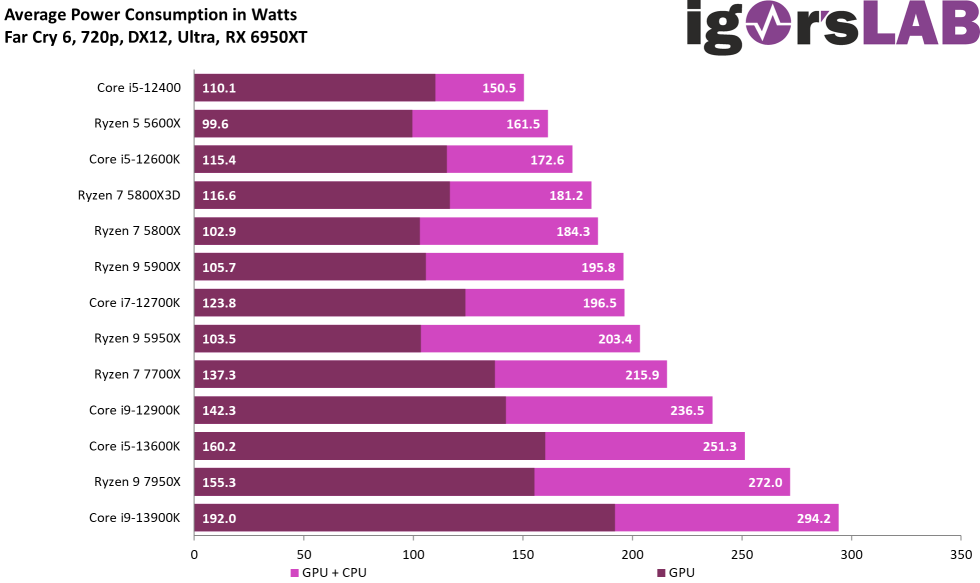
Gaming performance summary in 720p
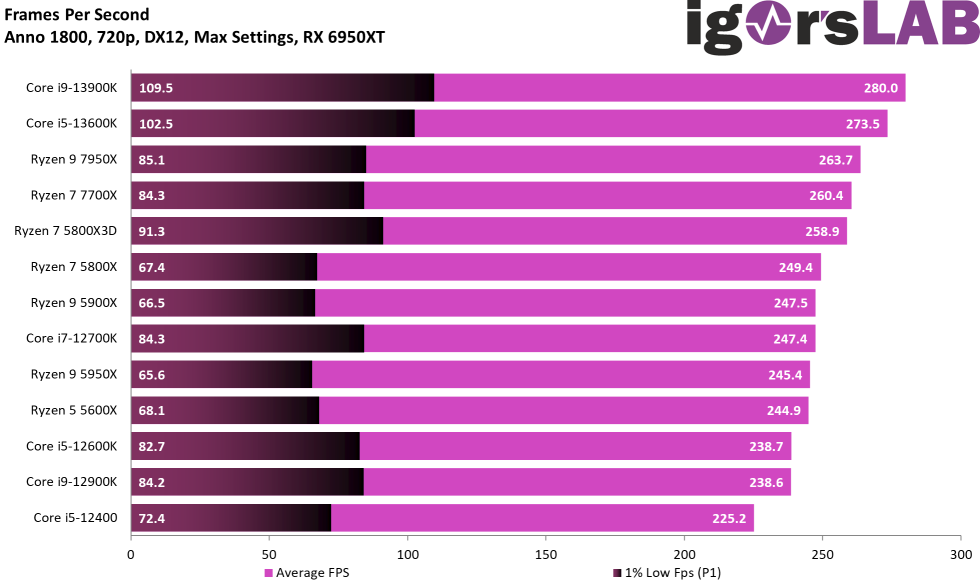
How fast are the new Intel CPUs when they have to bombard the graphics card with data under full load? The recently tested AMD Ryzen 7950X in the popular and equally hated 720p test serves as a comparison here. You will see the relevance at the latest on the next page at the higher resolutions, when the bars get closer to each other again. But let’s start with the lowest resolution. The AMD Ryzen 9 7950X is behind the new Core i9-13900K, and then the Ryzen 7 7700X follows, as well as the older Ryzen 7 5800X3D, which still appears quite dewy, and the huge cache still looks good, at least for gaming.
The smaller Core i5-13600K is exactly between the Core i9-12900K and the i7-12700K, even if the percentiles aren’t that high now. and are rather on the level of the Core i5-12600K. The summary of the power consumption and the efficiency of all games can be found later on a separate page, and I can already spoil that there are quite a few surprises.
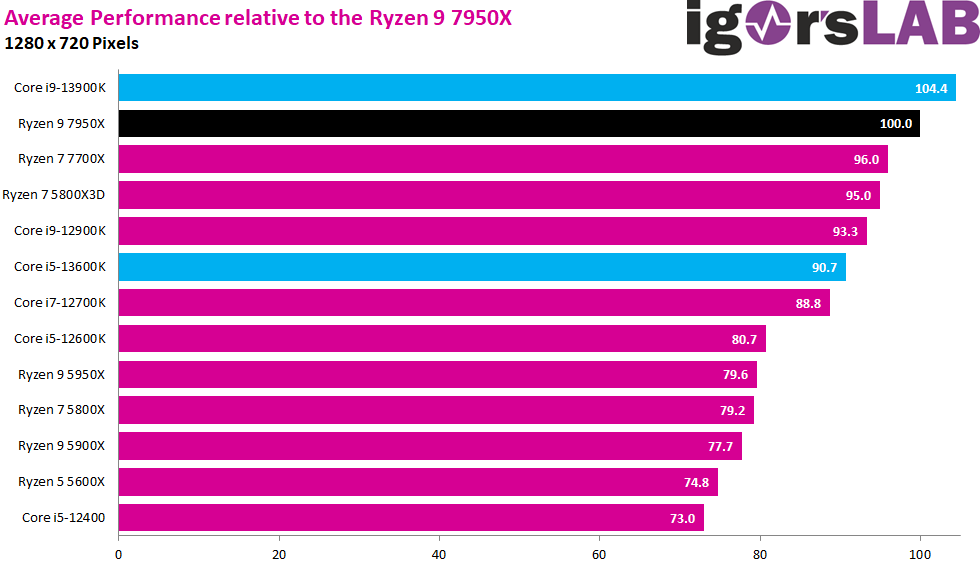
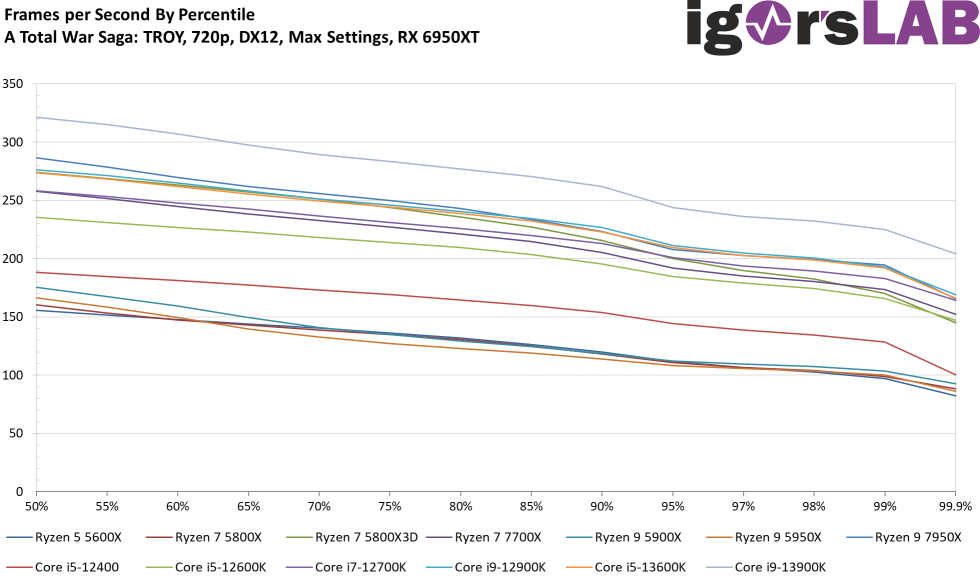
The new Core i9-13900K is 4.4 percentage points ahead of the Ryzen 9 7950X, 11.1 percentage points ahead of the Core i9-12900K, 8.2 percentage points ahead of the Ryzen 7 7700X and almost 14 percentage points ahead of the Core i5-13600K. The Core I5-13600K takes 10 percentage points from the old Core i5-12600K and is about 2 percentage points behind the Core i9-12900K and ahead of the Core i7-12700K Yes, you can leave that as well and it is at least enough here to regain the so-called performance crown.
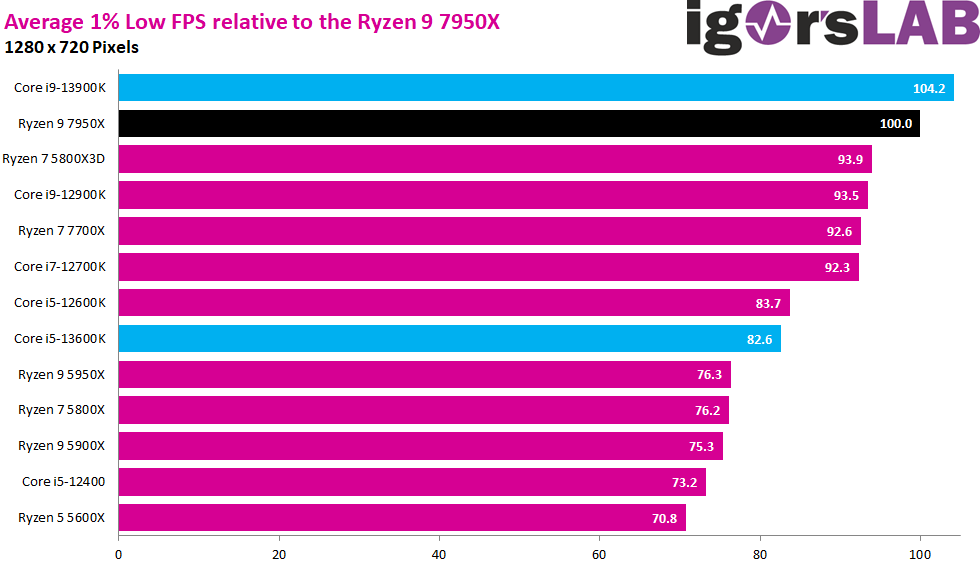
The output at the P1, i.e. the new Min FPS, is more interesting. Here, the Core i9-13900K is also ahead with 4.2 percentage points, but Intel’s Core i5-13600K has to make concessions and is even one percentage point behind its direct predecessor, the Core i5-12600K. I’ll show you what the smaller brother is (still) slightly lacking in later with a concrete example in WQHD.
Performance metrics

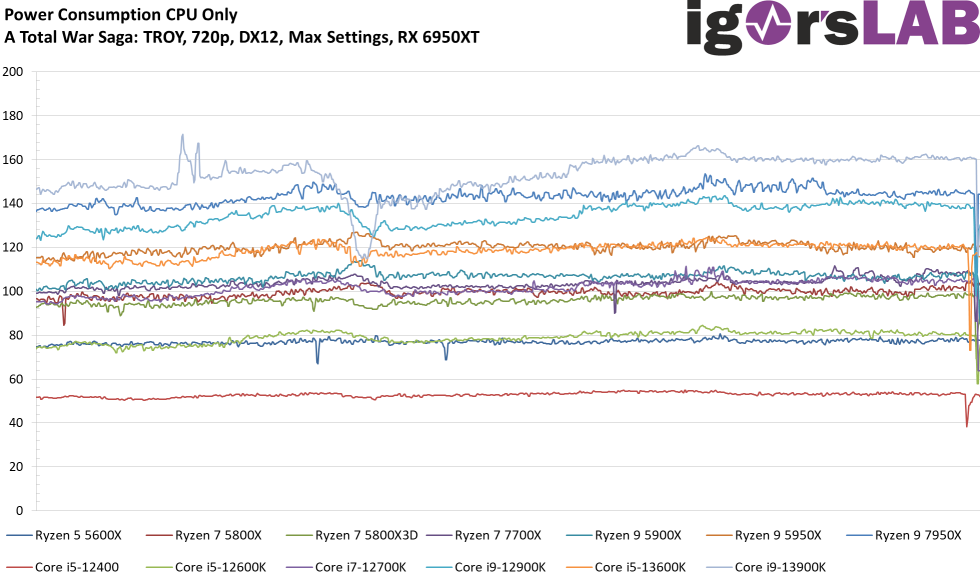
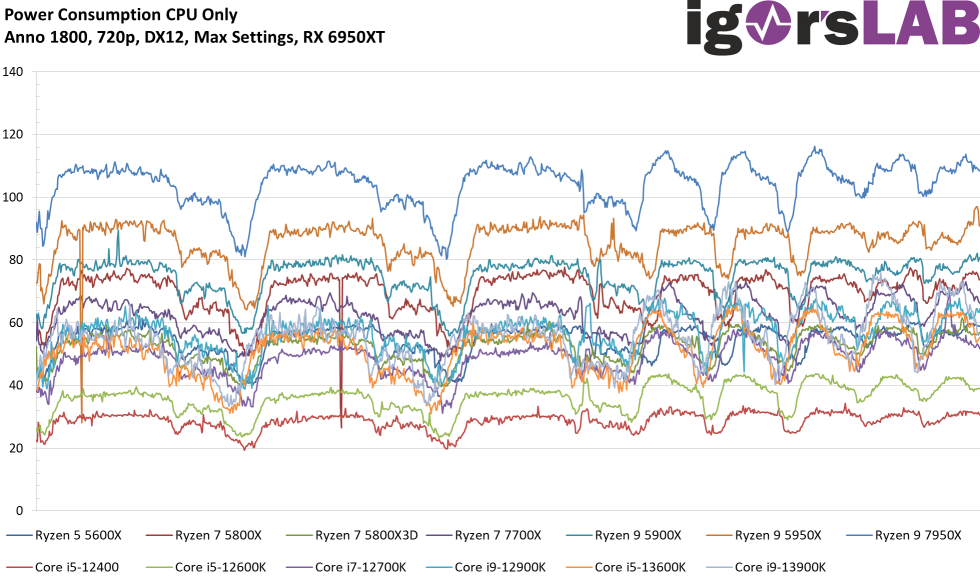
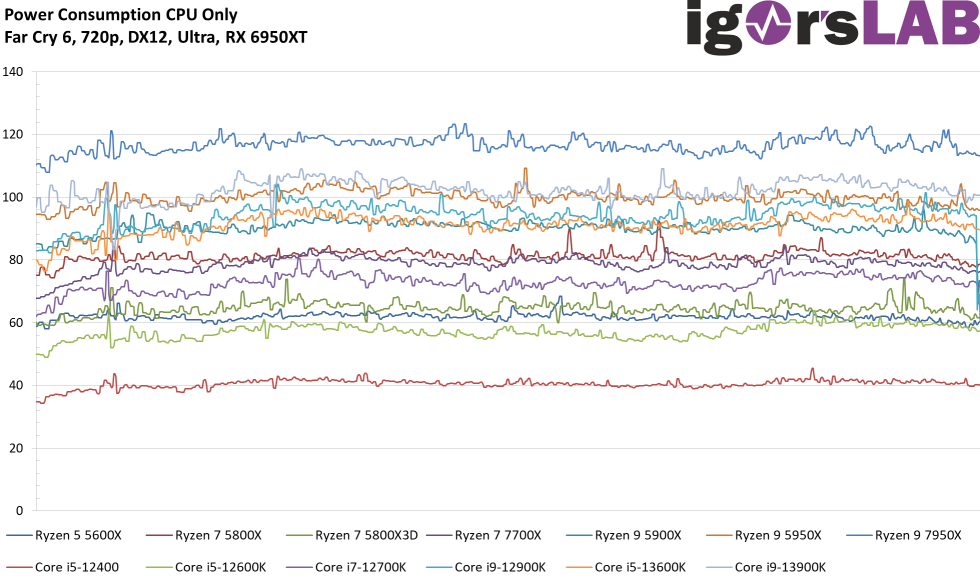
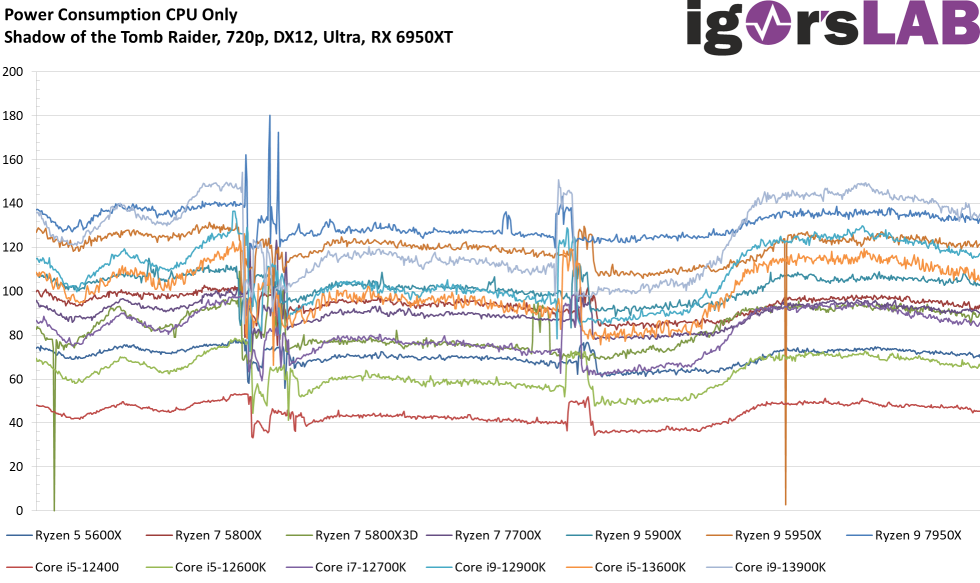
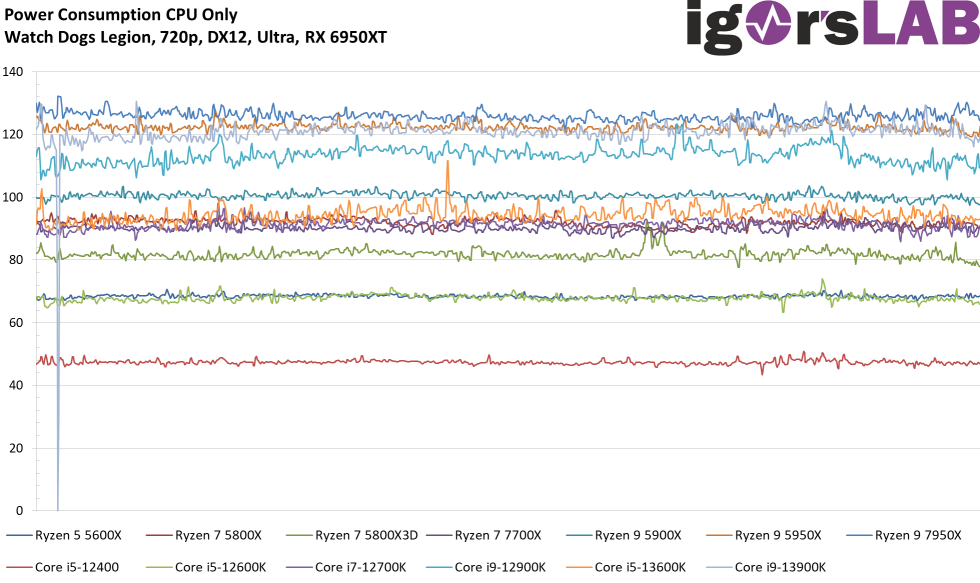
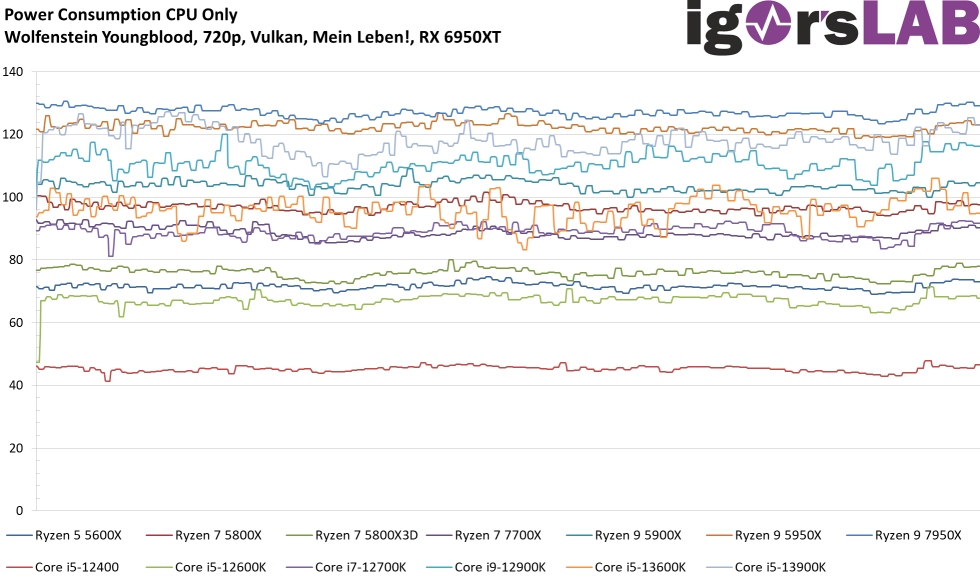
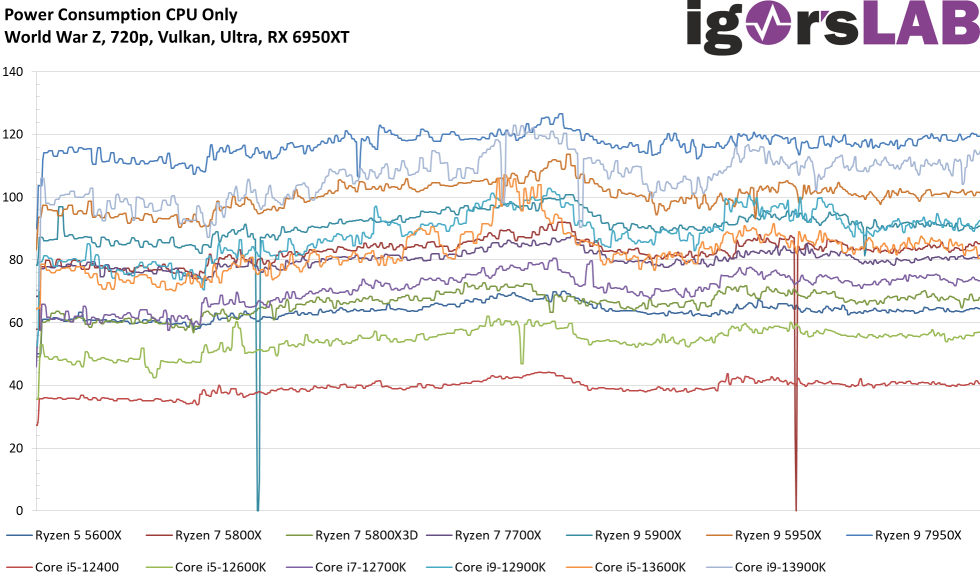
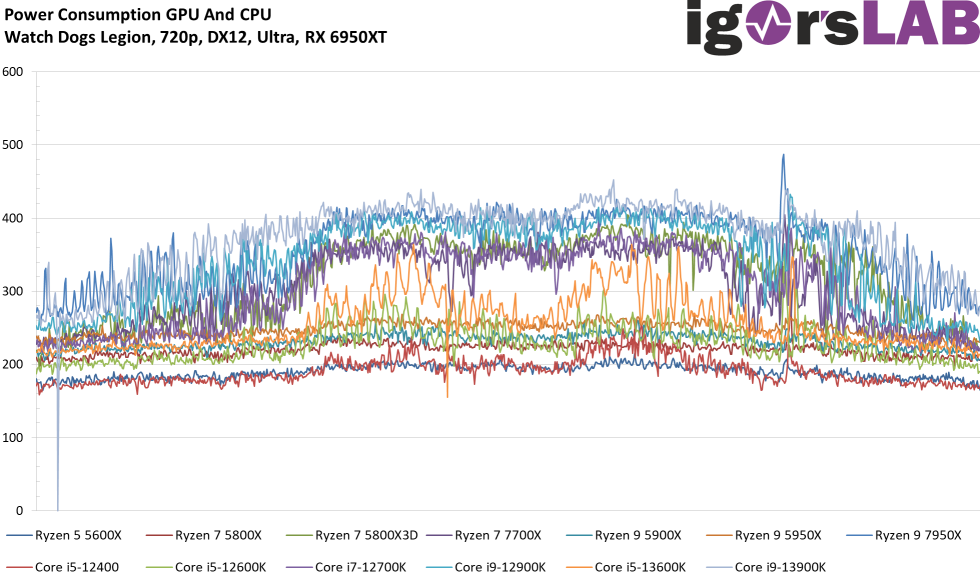
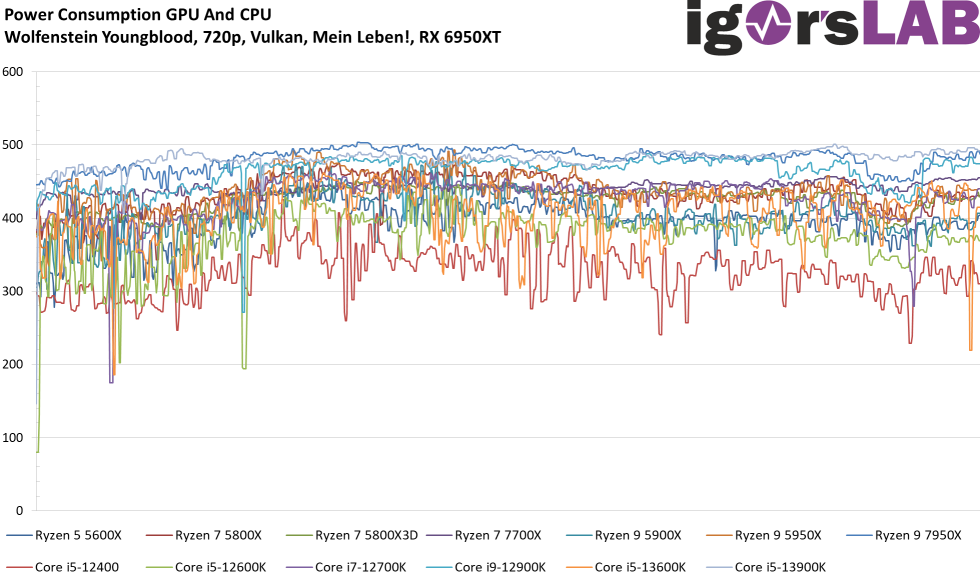
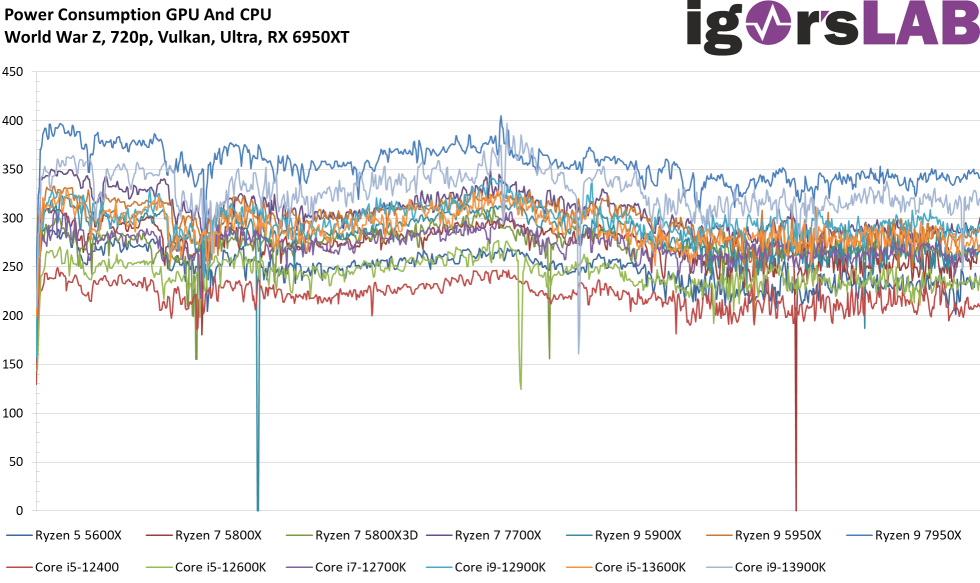
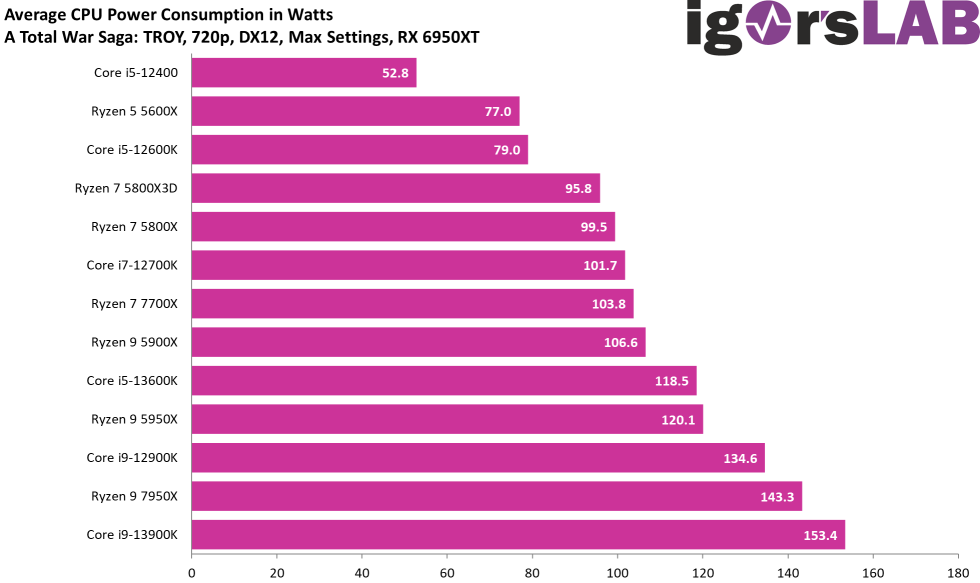
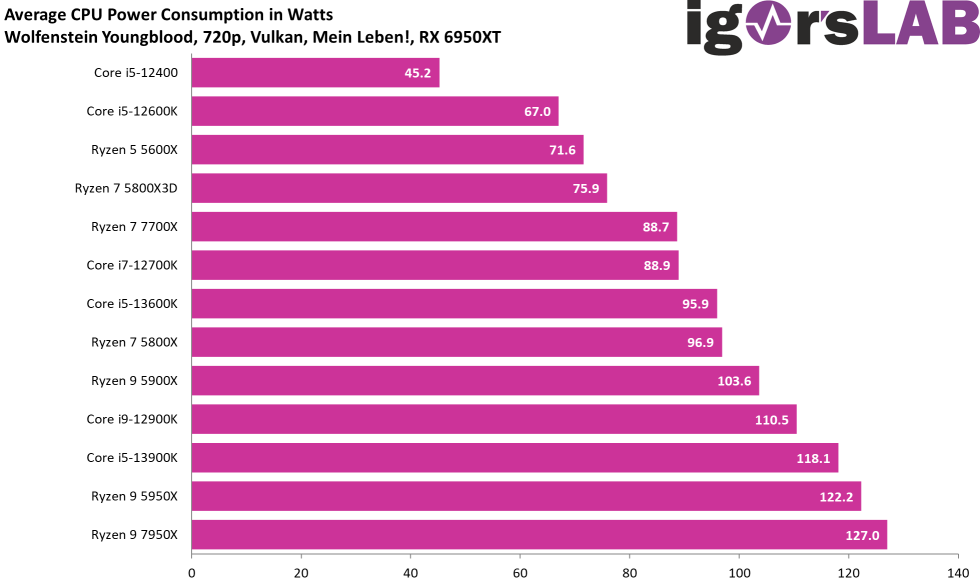
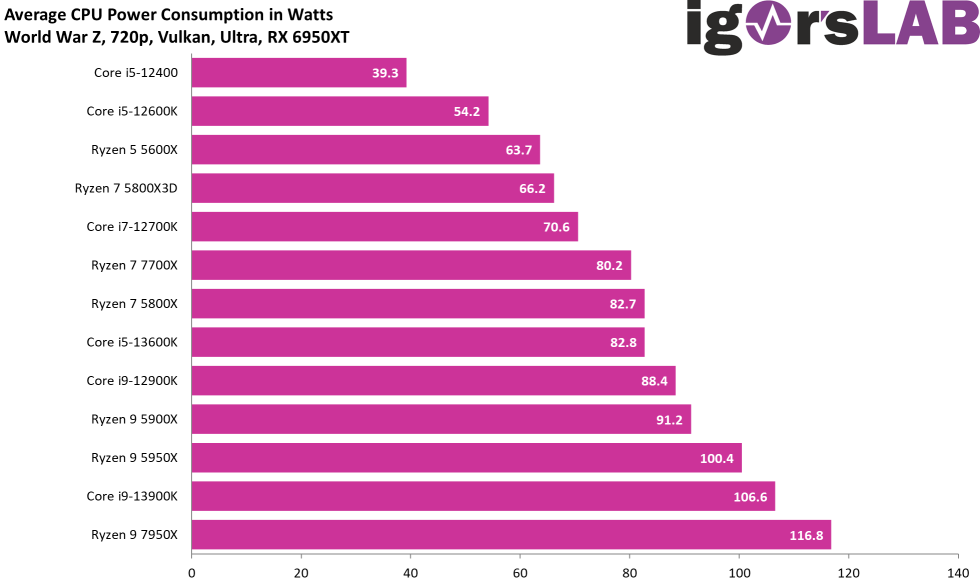
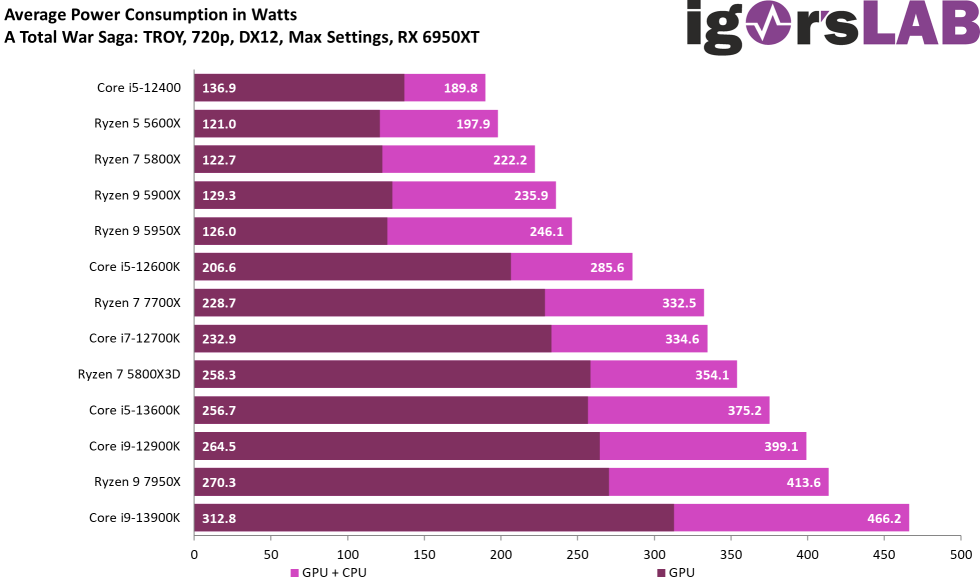
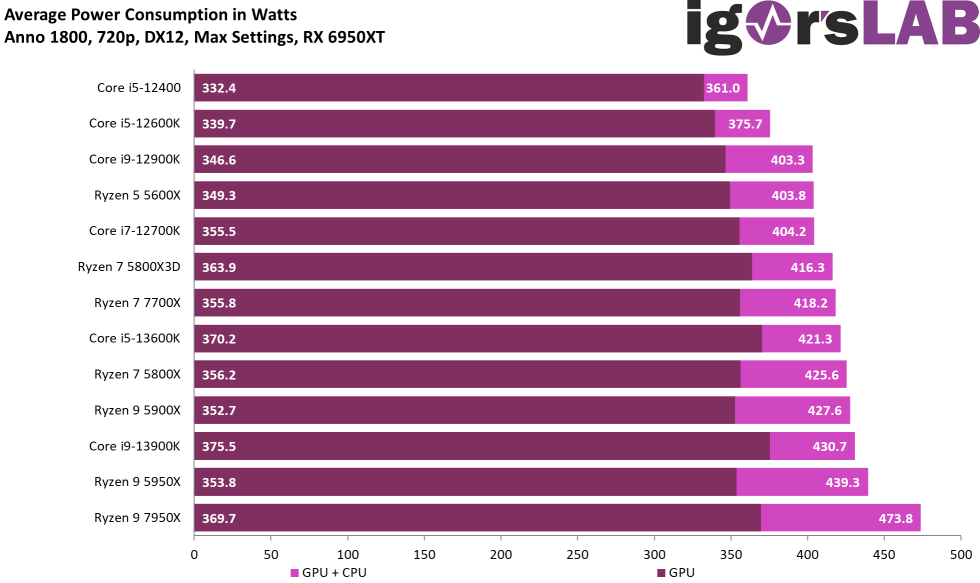
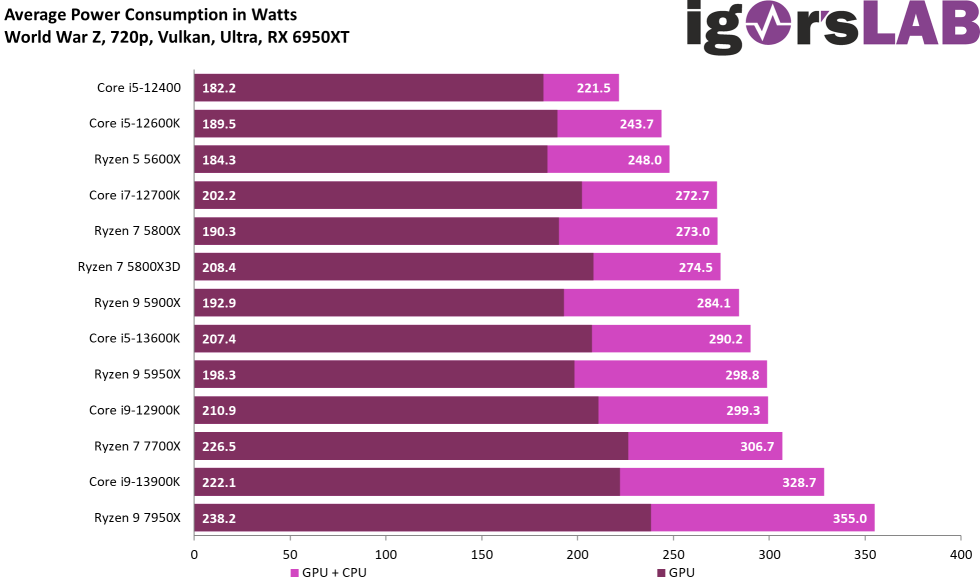
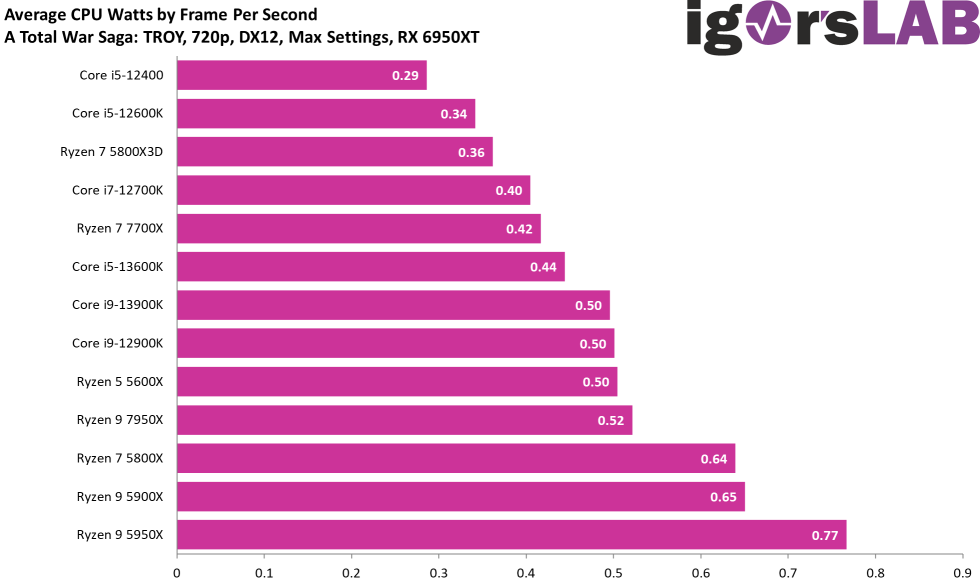
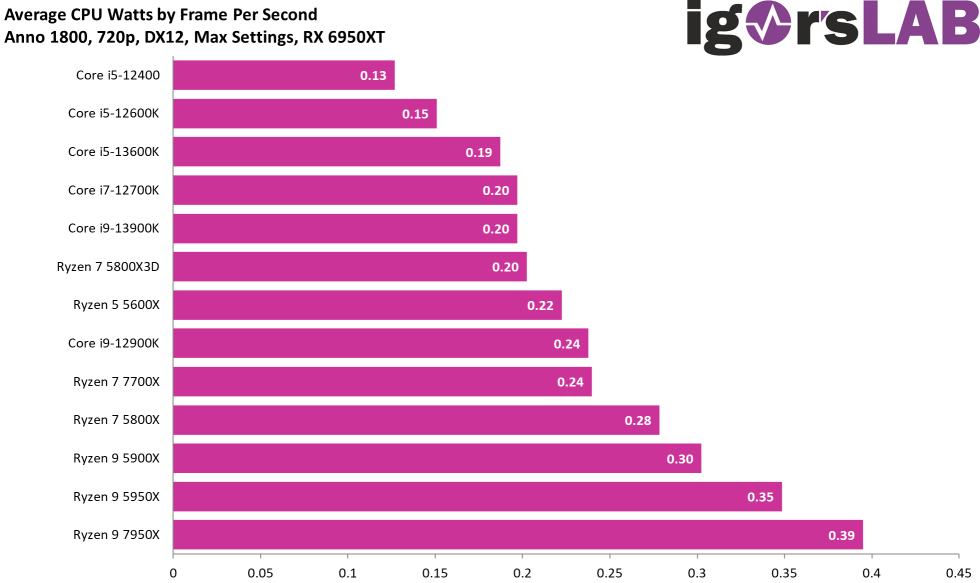
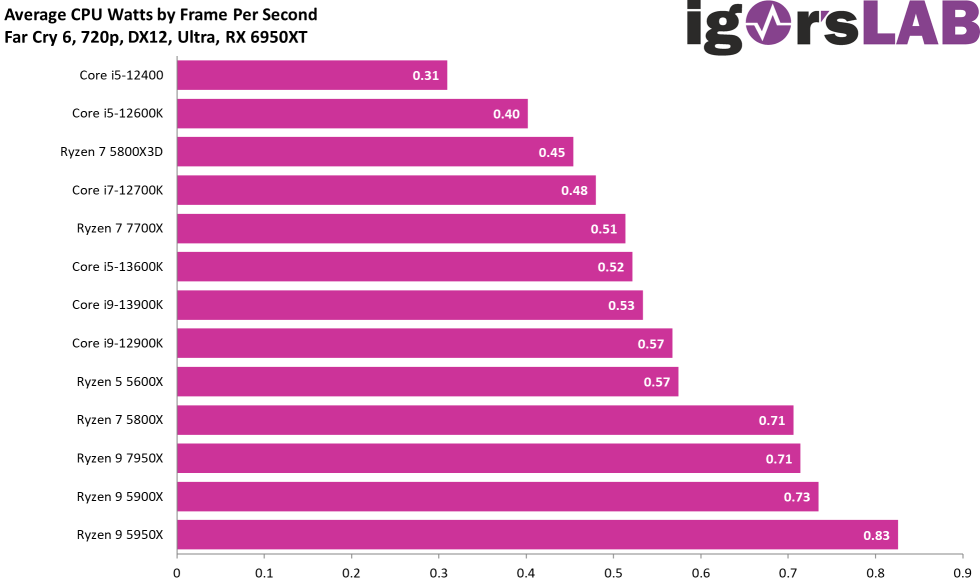
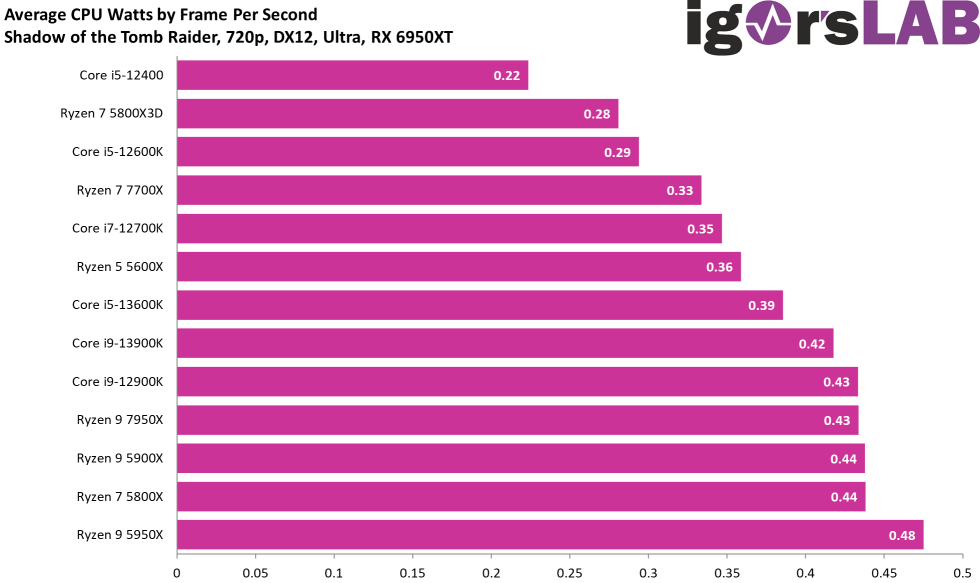
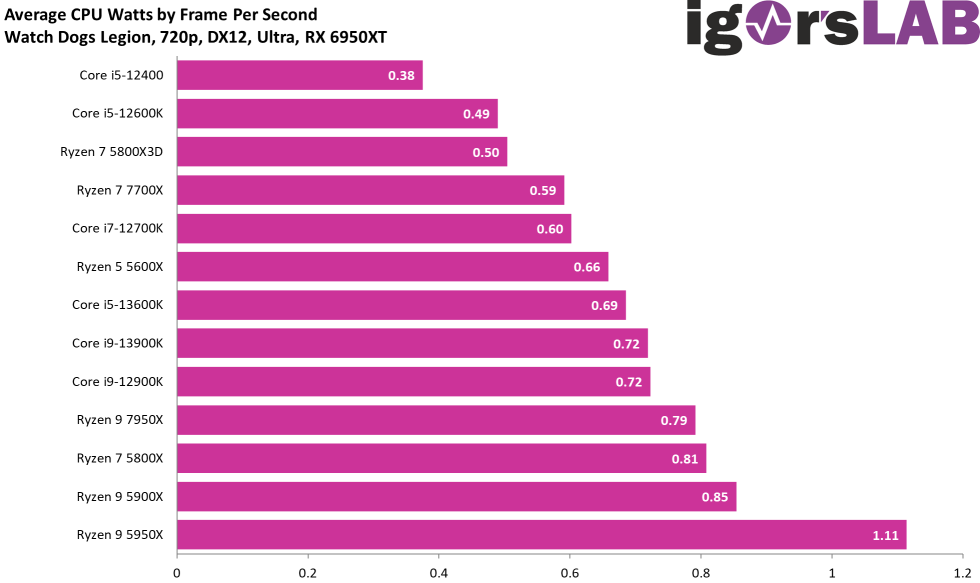
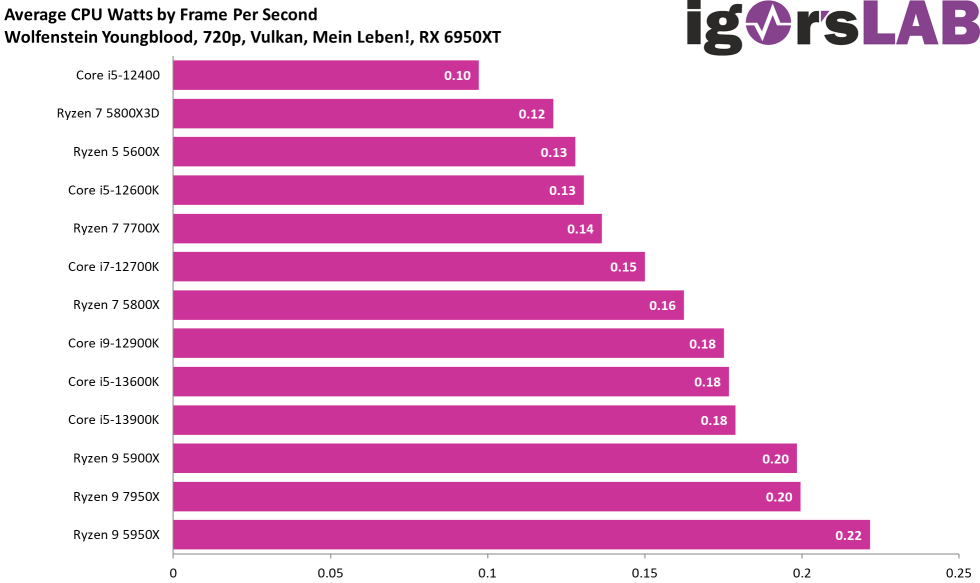
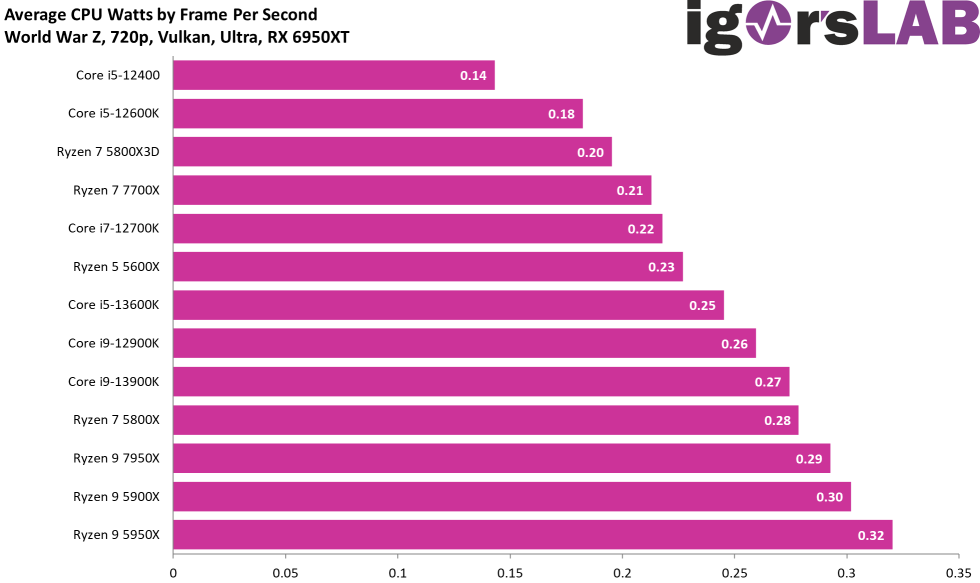
Power Draw and Single Efficiency

- 1 - Introduction, preface and CPU specs
- 2 - What's new with Raptor Lake?
- 3 - Test setup and methodology
- 4 - Gaming Performance HD Ready (1280 x 720 Pixels)
- 5 - Gaming Performance Full HD (1920 x 1080 Pixels)
- 6 - Gaming Performance WQHD (2560 x 1440 Pixels)
- 7 - Autodesk AutoCAD 2021
- 8 - Autodesk Inventor 2021 Pro
- 9 - Rendering, Simulation, Financial, Programming
- 10 - Science and Math
- 11 - Power consumption and efficiency
- 12 - Summary and conclusion


175 Antworten
Kommentar
Lade neue Kommentare
Veteran
1
Mitglied
Veteran
Mitglied
Veteran
Veteran
Veteran
Mitglied
Urgestein
Veteran
Mitglied
Urgestein
Mitglied
1
Urgestein
Mitglied
Urgestein
Veteran
Alle Kommentare lesen unter igor´sLAB Community →