The mother of data preparation – the interpreter
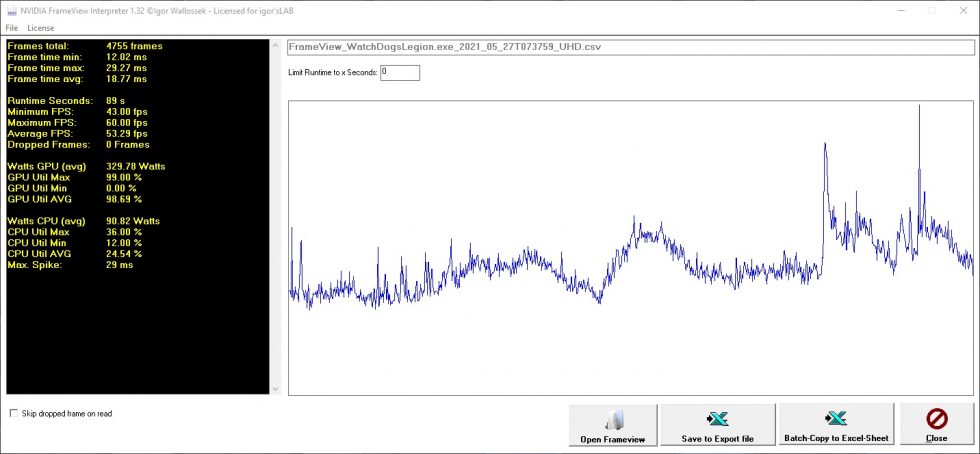
The advantage of a very lean acquisition tool like NVIDIA’s FrameView is, however, also a disadvantage at first, because you can’t do anything or very little with the exported and real-time logged data in Excel. This is mainly because while the benchmark runtime is the same for all graphics cards in games, the number of frames rendered is not. The faster a card works, the more values are written to the log file.
If you later want to compare this graphically on a common time line in Excel, you have the problem of data sets of different lengths. Excel is also a very sluggish program, making very slow progress with the vast amounts of data supplied. Exactly for this I have my own interpreter, which can not only read in the log files of various acquisition programs (or even games), but also at the same time does all the arithmetic work for a later graphical output in the Excel charts. Because it’s much, much faster here. And you already have a first overview to check the plausibility of the measurement and to repeat it if necessary in case of doubt.
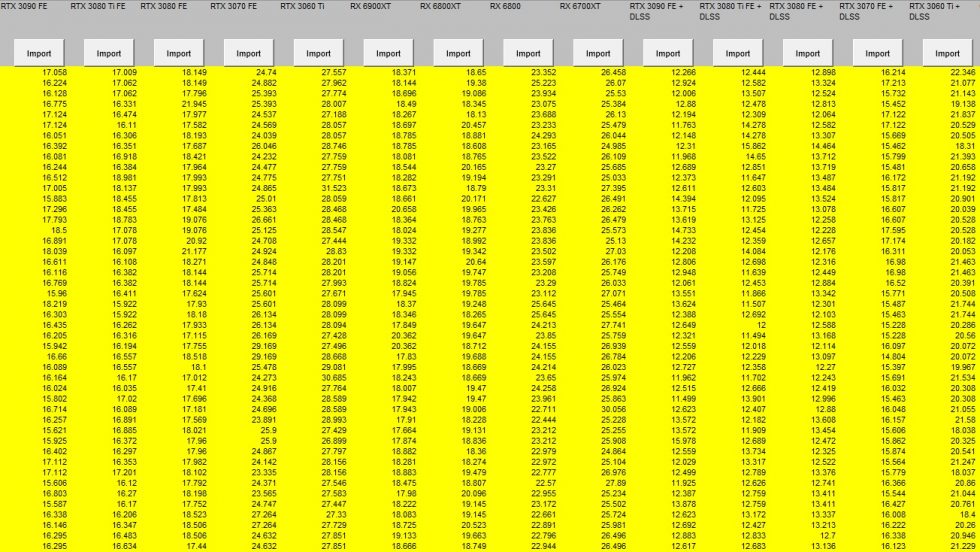
However, we made a big cut two years ago and now also pass the filtered, original frame times to Excel in addition to the extra or interpolated data for the graphics, because we have added some individual outputs there and can thus simply get more accurate. For this purpose, the Excel template used was also extended with optimized macros. If any of my US colleagues are reading along here: an update would really be worthwhile. I automatically create another transfer file in the interpreter that contains a specially customized data set that I can then, graphics card by graphics card in the template simply read and import:
There you will find the relevant raw data for each graphics card in the folder together with the already prepared data for the graphical display, which I would like to show you. For all curve diagrams I use, so that the time line is correct again, 1000 single values, which I have calculated in the interpreter with a smart filter from e.g. up to 60,000 single data. By the way, overlapping data fields have been merged as if it were a compressed graphical output. In this way, no maximum or minimum values are lost.
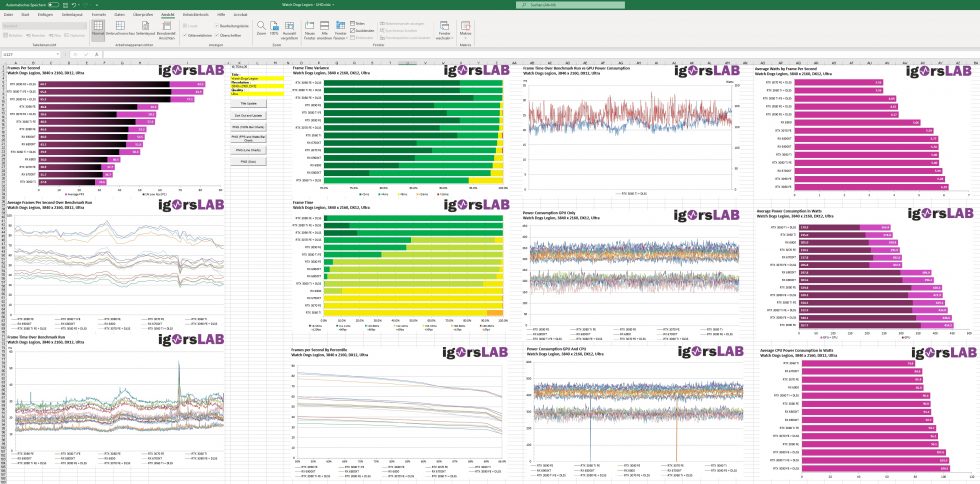
Despite all the preparatory work, there is still about 1.3 MB of source code for the individual macros in the latest Excel template, which also shows that VBA is very inefficient and that it is better to outsource second-critical routines. The current chart graphics, which you already know from my tests, are then on a result page, from where I can automatically export them as PNG files in my required file format and the specified image size. Of course I don’t want to withhold that from you either:
And exactly these graphics and their contents I will now explain to you in more detail on the next pages.
- 1 - Low-Level-Benchmarking with FrameView
- 2 - Power Consumption in real time with NVIDIA PCAT
- 3 - igorsLAB Interpreter and Template
- 4 - FPS and Percentile, Bar Graph and Curves
- 5 - Frame Time and Variances as Bar Graph and Curve
- 6 - Power Consumption and Effiziency in Games (GPU and CPU)
- 7 - Scope Measuring, Transients, PSU Recommendation












18 Antworten
Kommentar
Lade neue Kommentare
Urgestein
Urgestein
Urgestein
1
Urgestein
Urgestein
Urgestein
Urgestein
Urgestein
1
Urgestein
Urgestein
Urgestein
Urgestein
Urgestein
Mitglied
Neuling
Neuling
Alle Kommentare lesen unter igor´sLAB Community →