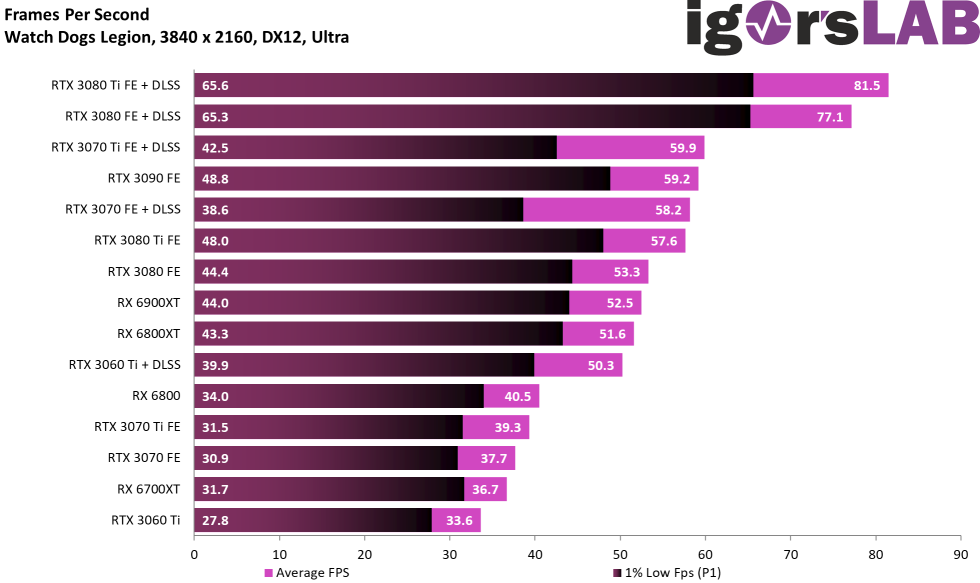
FPS and percentiles as combined bar chart
First, I run the benchmark run as already described and log frame time, PCAT data and system data like CPU clock, utilization and package power with NVIDIA FrameView, so I write the full log file. After the PNG export from the template, we are of course first interested in the FPS as an average value. However, what we used to call Min-FPS a long time ago hardly reflects reality realistically (especially for longer runs). That’s where the percentiles come in.
But since there are always inconsistencies and questions here, I’ll explain to you what it’s all about, because in principle it’s really nothing different, only in the right way. What I see here in the combined bar chart as P1 (i.e., quasi the 1. Percentile or 1% Low) represents the worst 1% of all measured data. These specifications are also very good for showing larger frame drops, various FPS dips or permanent micro stutters, but that’s all they show for now.
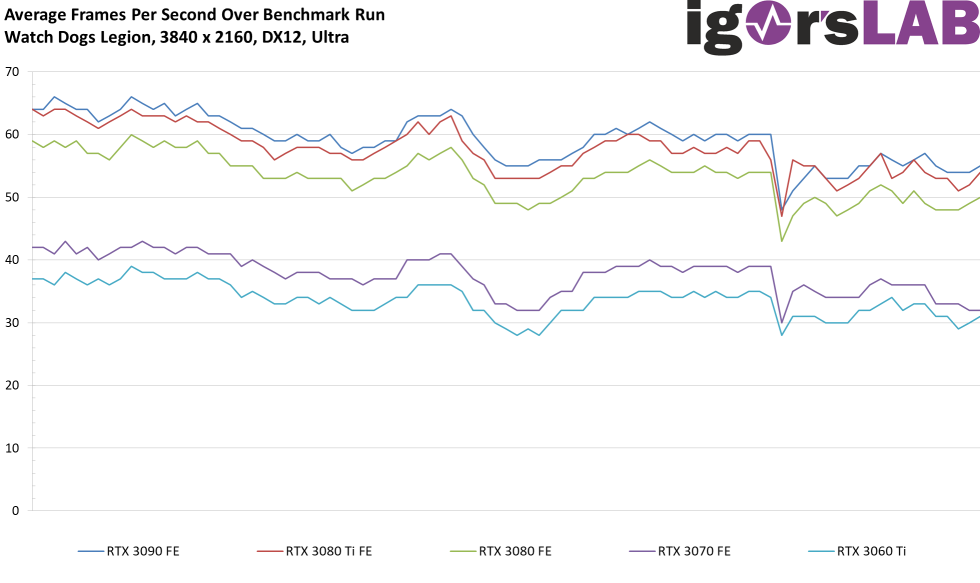
FPS as a progression curve
If a benchmark runs like here for example 108 seconds, then the FPS prepared in the interpreter for each card can first be beautifully superimposed. Such a comparison also makes deeper sense, because it shows not only the places where, for example, all cards collapse equally, but also the areas where one card runs better and more smoothly than another. This can then with the worse card (which is perhaps not even much slower on average) at this point e.g. also a driver bug or lack of memory indicate. For example, in the example below without DLSS, we can see how much smoother the fastest card (RTX 3090) can complete the benchmark compared to the second fastest card (RTX 3080 Ti).
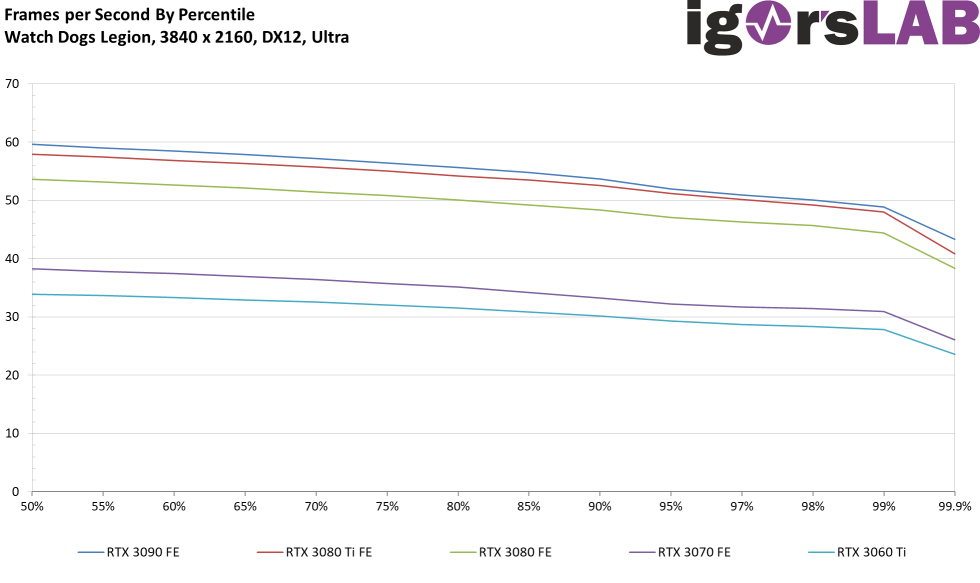
FPS and percentiles as a curve
The following curve is always underestimated, because you can see very nicely how many FPS on average in percent. I’ll evaluate this in detail later for the frame time, but here we’re dealing with the seconds intervals for now. For example, with the RTX 3090 we see that 50% of all FPS are at 60, which is also close to the average FPS, 85% of FPS are at least still at 55, and 99% of all FPS values are then still above just under 49. That is why some colleagues still write about the 99th anniversary. Percentile, although unfortunately it is mathematically incorrect.
- 1 - Low-Level-Benchmarking with FrameView
- 2 - Power Consumption in real time with NVIDIA PCAT
- 3 - igorsLAB Interpreter and Template
- 4 - FPS and Percentile, Bar Graph and Curves
- 5 - Frame Time and Variances as Bar Graph and Curve
- 6 - Power Consumption and Effiziency in Games (GPU and CPU)
- 7 - Scope Measuring, Transients, PSU Recommendation













18 Antworten
Kommentar
Lade neue Kommentare
Urgestein
Urgestein
Urgestein
1
Urgestein
Urgestein
Urgestein
Urgestein
Urgestein
1
Urgestein
Urgestein
Urgestein
Urgestein
Urgestein
Mitglied
Neuling
Neuling
Alle Kommentare lesen unter igor´sLAB Community →