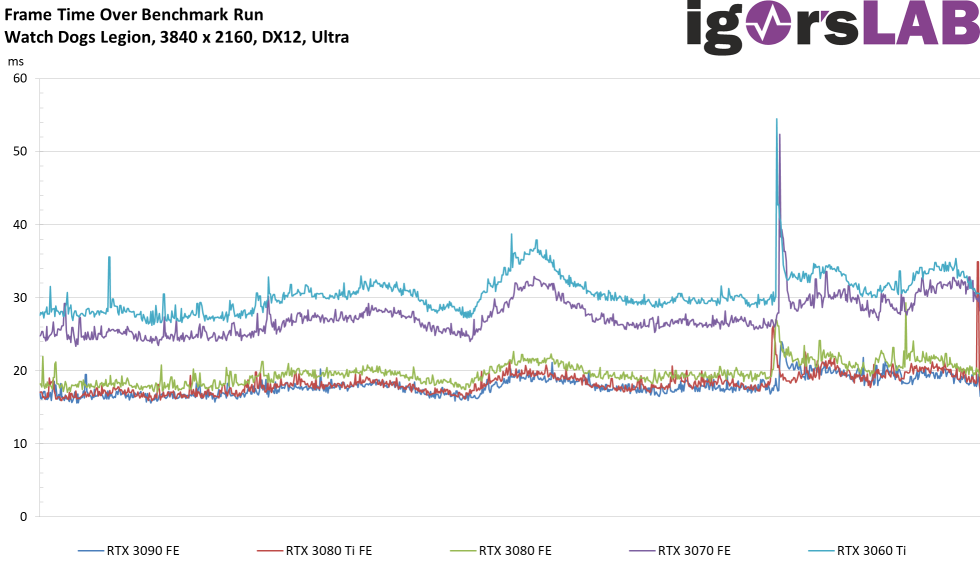
Frame time of all cards as a curve
More interesting are the frame time progressions. Neatly interpolated, these data also lie neatly on a common time axis, so that one can also compare the maps better with each other. However, these curves with the many fluctuations also have the disadvantage that they can no longer be assigned to the individual cards in each case. All the overlaps make such a statement not insignificantly difficult. The slowest cards also have the highest rendering time in ms per rendered frame and the proportionally highest dips.
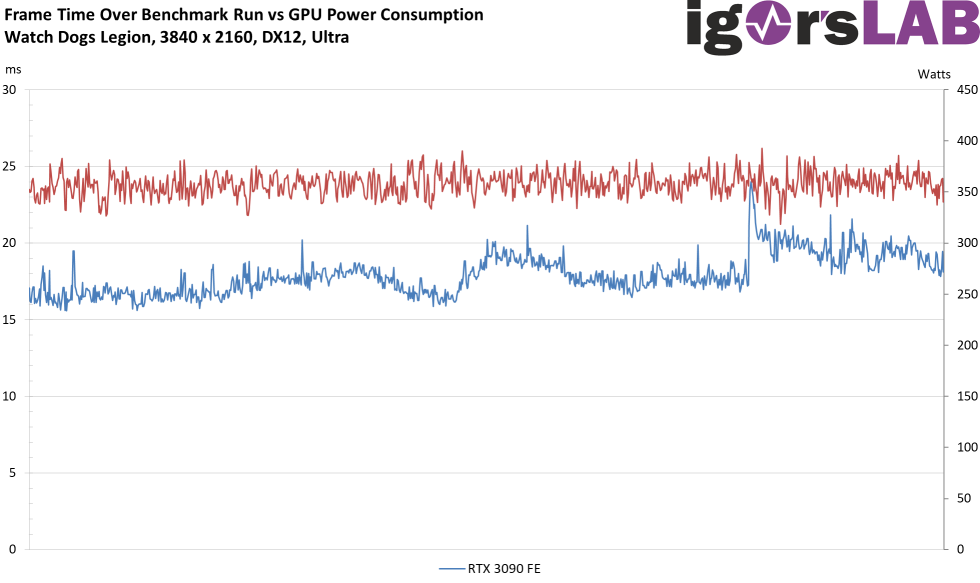
Frame time of a map as a curve (solo graphic)
Fittingly, PCAT’s power consumption values are also scaled to match the common timeline (although I don’t want to get ahead of the power consumption chapter). In this case, by the way, we see the measured values for the respective graphics card on all rails and not just estimates. AMD doesn’t have to speculate with unclear values like ASIC, this is the total power consumption, i.e. the board power of every single card in exactly this time window. Blue is the frame time curve, red represents the power consumption.
If you want it even more precise, you can even map the frame time together with the respective power consumption on a common time axis for each individual card, since I also produce precise and uniform time stamps on the measuring station with the oscillographs, so that it could be merged later in the interpreter. Only this is already over the top and would be pure measuring luxury. NVIDIA solves this with PCAT a bit more granularly than my measurement setup with the oscilloscope, but saves the much more complex merging of huge datasets via the Ethernet timestamp. That’s easily enough for visuals and a fairly accurate average (I’ll get into that later).
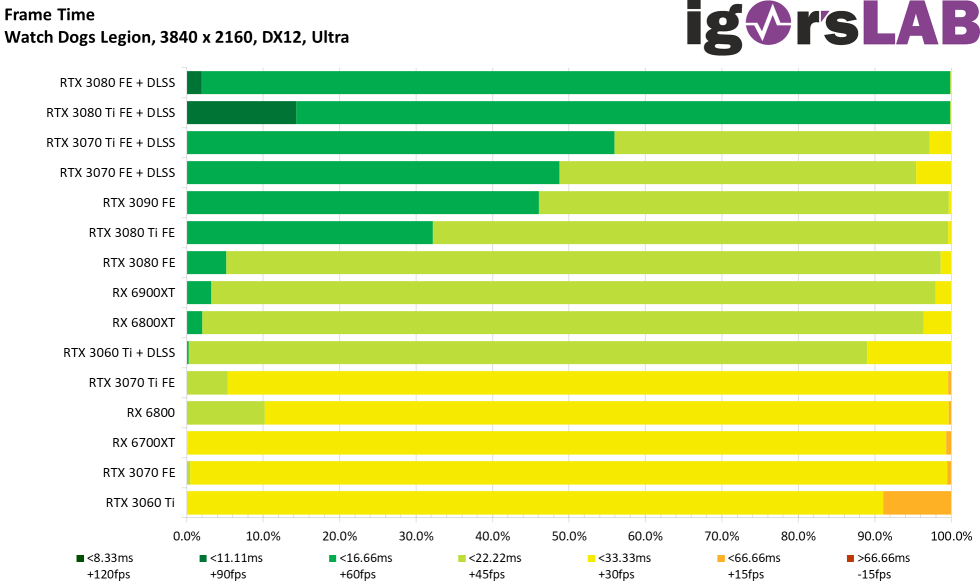
Frame time of all cards as bar chart
Here I now proceed differently than with the percentiles, because I cumulate the respective amount of frames per certain interval (see legend). Depending on how fast the image was rendered, the proportion of the respective time window then increases. Leaving DLSS aside, we see that the RTX 3090 without this help has the highest percentage of frames with < 16.66 ms, which would represent more than 60 FPS on average, even though very different render times can accumulate here in the second of a measurement.
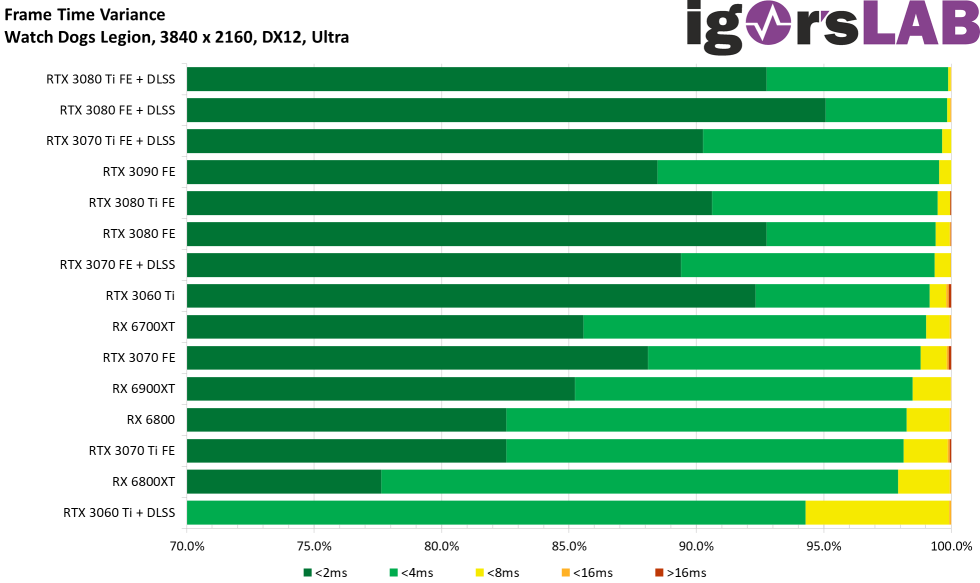
Variances – Incorruptible indicator for smooth scrolling
By variance we mean the differences in time between two consecutive frames. These are absolute values of the difference between the two render times, because it does not matter to the viewer whether the following frame was rendered particularly quickly or the previous one particularly slowly. You can see micro jerks in both cases. All variances below 4 ms are actually not visible to the viewer, this only becomes an issue at around 8 ms and above. From 16 ms onwards, you can already see such pronounced jerks that you can no longer call the scrolling smooth.
- 1 - Low-Level-Benchmarking with FrameView
- 2 - Power Consumption in real time with NVIDIA PCAT
- 3 - igorsLAB Interpreter and Template
- 4 - FPS and Percentile, Bar Graph and Curves
- 5 - Frame Time and Variances as Bar Graph and Curve
- 6 - Power Consumption and Effiziency in Games (GPU and CPU)
- 7 - Scope Measuring, Transients, PSU Recommendation












18 Antworten
Kommentar
Lade neue Kommentare
Urgestein
Urgestein
Urgestein
1
Urgestein
Urgestein
Urgestein
Urgestein
Urgestein
1
Urgestein
Urgestein
Urgestein
Urgestein
Urgestein
Mitglied
Neuling
Neuling
Alle Kommentare lesen unter igor´sLAB Community →