


Since I am asked again and again which programs I use for the collection and analysis of my benchmark data and I also attach great importance to transparency, I have now sat down again and completely rewritten an article that I wrote in 2016, so already 5 years ago for Tom’s Hardware. Because not only has much changed for the better in terms of accuracy, but many new features have also been added. However, I use these newer versions together with Tom’s Guide France exclusively, because Tom’s Hardware USA was not interested in a further cooperation with me and still relies on the old templates and a software that was also faulty at that time. That’s just a side note, because time is running out and licenses too.
The all-encompassing collection of all relevant data during a benchmark is the basic prerequisite for an objective article that is also correct in terms of content. That’s why today I will not only show what I determine and how and later evaluate it graphically for the reader, but also explain the most important terms such as percentiles or variances, because many things are asked again and again and I will also make it easier to link this article here in the relevant reviews again and again. Because on the one hand there are always new readers and on the other hand one becomes forgetful with the time.
Low-level data capture for DirectX11, DirectX12, and Vulkan with NVIDIA FrameView
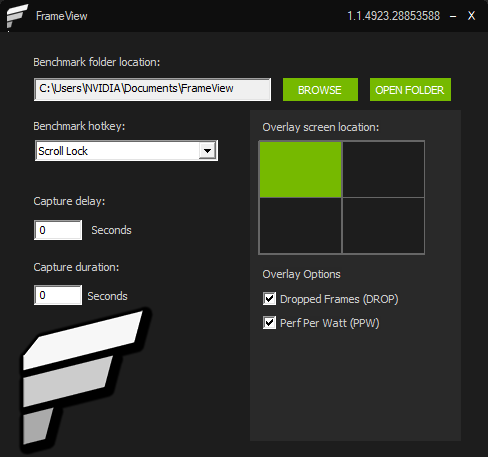 For the actual benchmarking, I use NVIDIA FrameView, a PresentMon-based low-level capture tool for the current frame times in the game, which can also grab system data and log everything more or less in real-time and synchronously. In contrast to CapFrameX, FrameView can not only write the log data, but also supplements it with system data analogous to HWInfo and the power consumption measurement from PCAT (see next paragraph). The simle to use tool is freeware and can be downloaded from NVIDIA.
The rather rudimentary FrameView does not offer a graphical evaluation like CapFrameX, but I still evaluate the log files myself, which are much more informative for me. The normal user, on the other hand, can certainly do more with CapFrameX, since he cannot or does not have to further evaluate the determined data himself and is already offered various metrics as graphical output. If, on the other hand, you want to work with a uniform time line for all cards, no matter how many frames were actually rendered within a benchmark run, this does not really lead anywhere for a graphical comparison, e.g. in Excel.
The problem is that all performance monitoring applications in turn consume system resources, which affects the recorded results. That’s why I intentionally use only FrameView or a highly optimized version of PresentMon, because these programs may seem to have fewer functions (which I don’t need anyway), but they are much leaner and thus require measurably fewer resources.
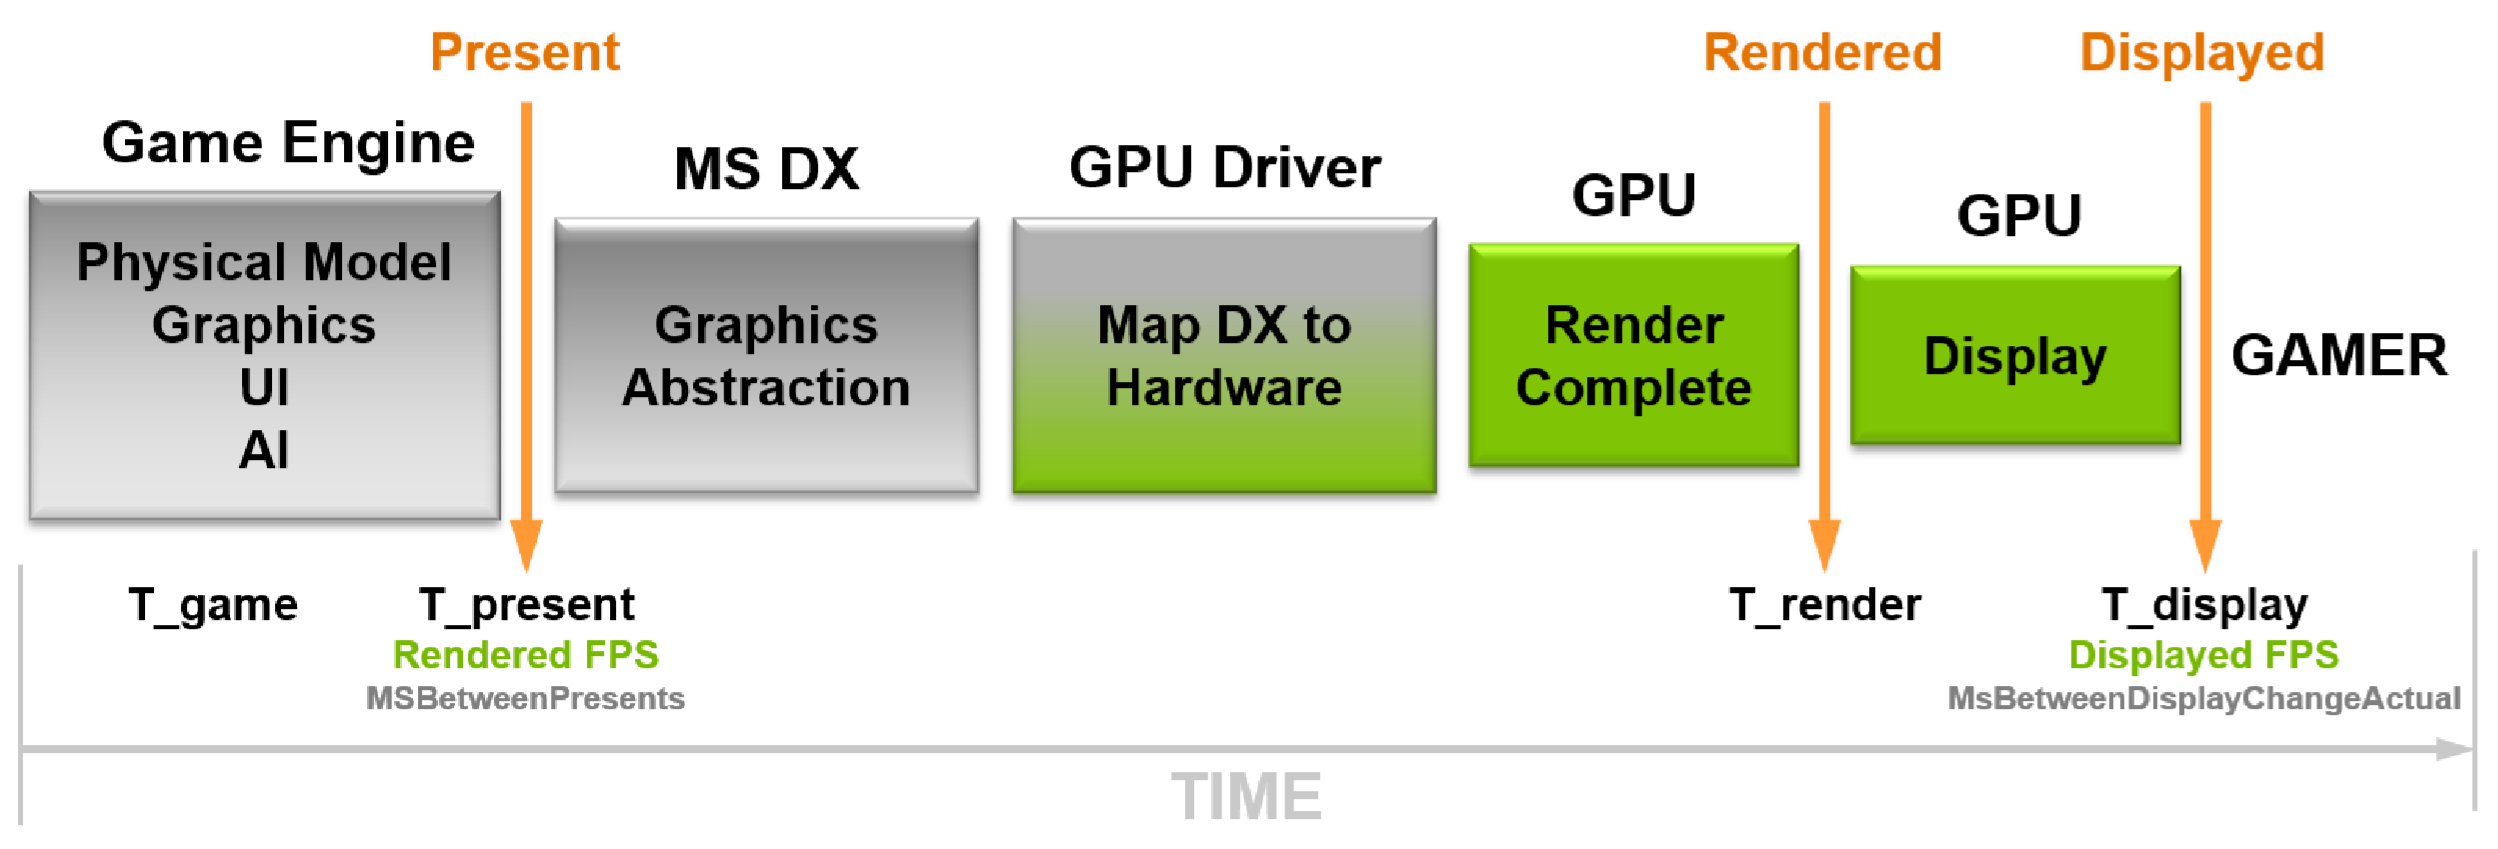 What FrameView later outputs to the log file contains all the useful information you need to create your own metrics. Rendered Frame Rate, for example, relies on the timestamp at the beginning of the graphics pipeline. This metric represents the smoothness of the animation delivered to the GPU. For the frame time evaluations, however, I use the displayed frame rate, where the timestamp at the end of the graphics pipeline is evaluated and tells me what the user actually gets displayed on the screen and when. I don’t need the optical overlay for the actual evaluation, but it’s still a handy indicator already in the game whether everything is really running smoothly.
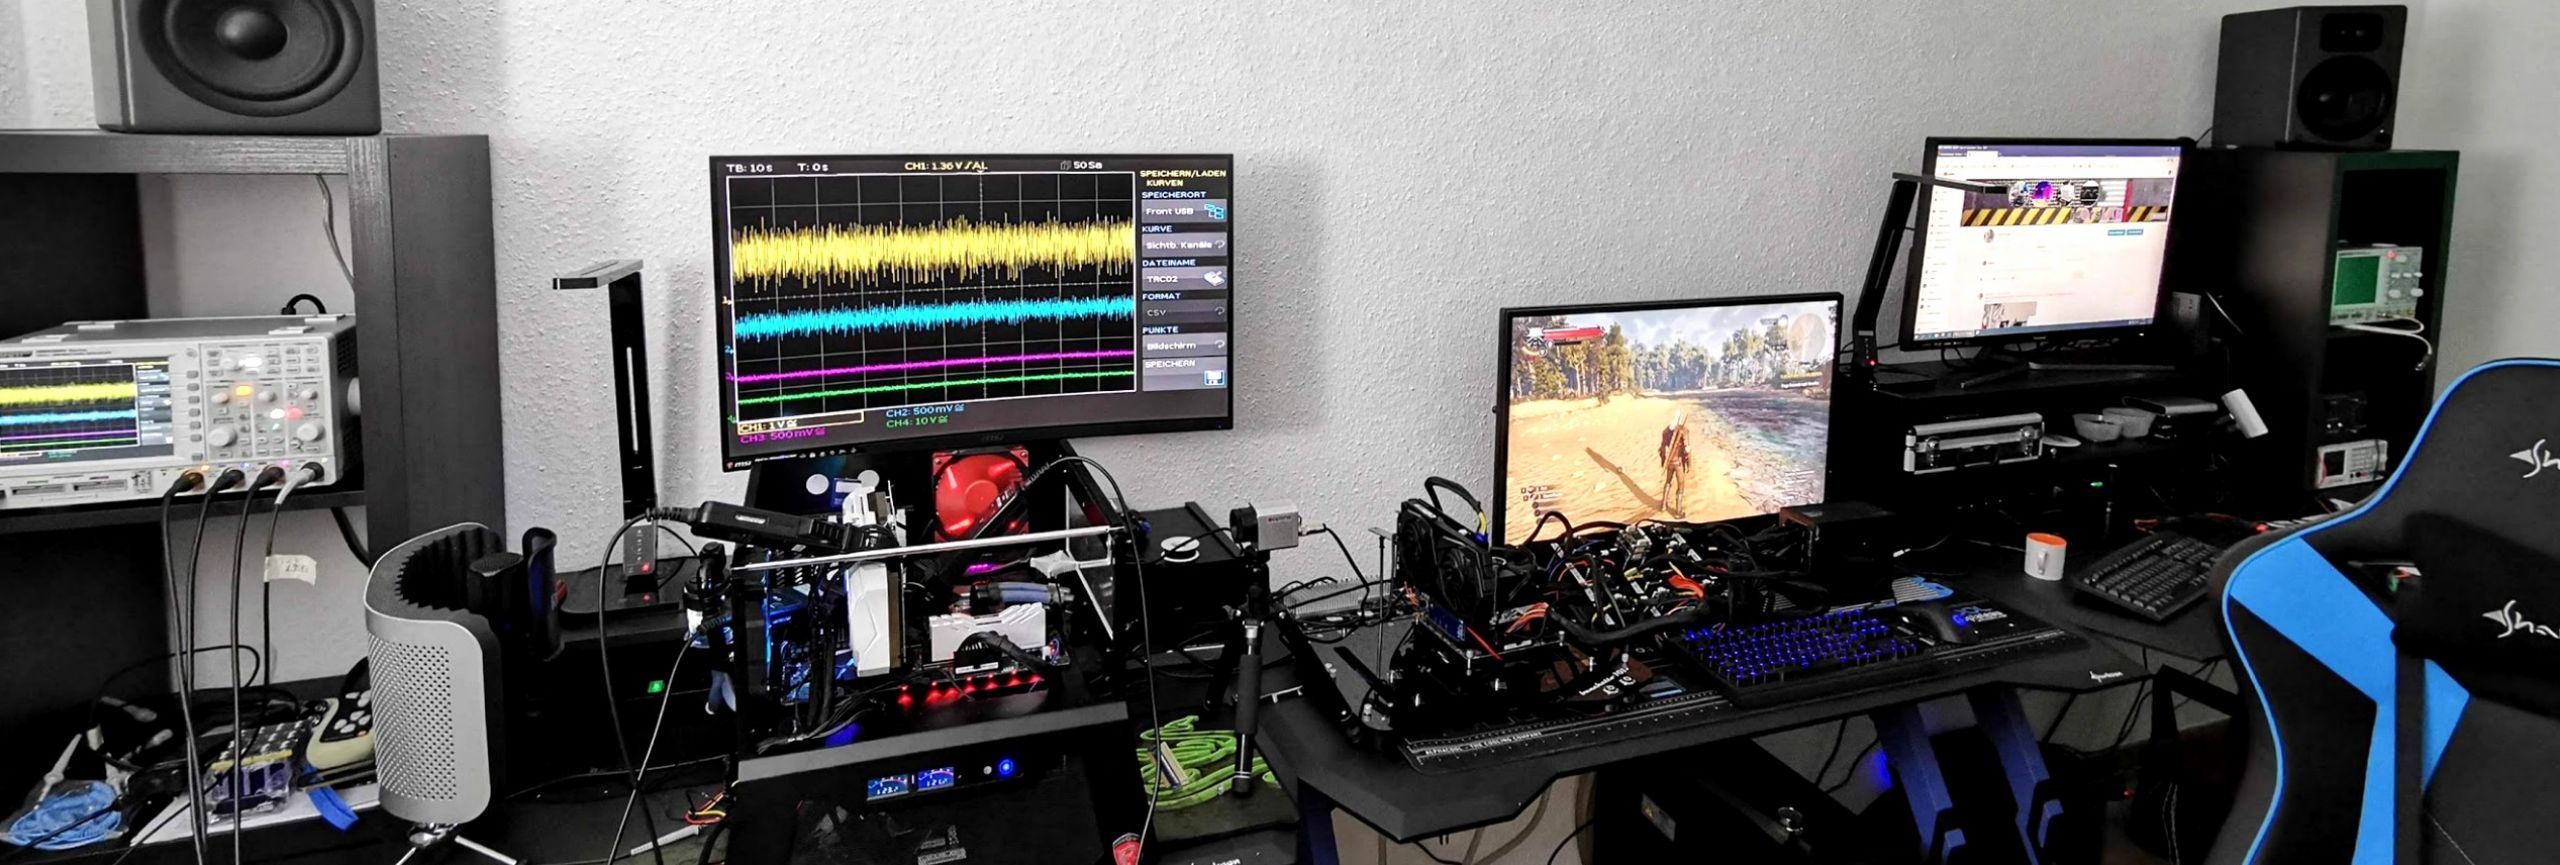
The benchmark system is no secret either, even existing twice for convenience and plausibility. Only the premises are different and I can even work in parallel if necessary, because both systems were also tested for congruent results.
| Test System and Equipment |
|
|---|---|
| Hardware: |
AMD Ryzen 9 5900X @4.7 GHz MSI MEG X570 Godlike / X570 Ace 2x 16 GB DDR4 3800, CL16 Be Quiet! Dar Power Pro 1200W |
| Cooling: |
Alphacool Ice Block XPX Pro Alphacool Ice Wolf (modified) Alphacool Subzero |
| Case: |
Raijintek Paean |
| Monitor: | BenQ PD3220U |
| Power Consumption: |
Oscilloscope-based system: Non-contact direct current measurement on PCIe slot (riser card) Non-contact direct current measurement at the external PCIe power supply Direct voltage measurement at the respective connectors and at the power supply unit 2x Rohde & Schwarz HMO 3054, 500 MHz multichannel oscilloscope with memory function 4x Rohde & Schwarz HZO50, current clamp adapter (1 mA to 30 A, 100 KHz, DC) 4x Rohde & Schwarz HZ355, probe (10:1, 500 MHz) 1x Rohde & Schwarz HMC 8012, HiRes digital multimeter with memory function MCU-based shunt measuring (own build, Powenetics software) NVIDIA PCAT and Fr |
| Thermal Imager: |
1x Optris PI640 + 2x Xi400 Thermal Imagers Pix Connect Software Type K Class 1 thermal sensors (up to 4 channels) |
| Acoustics: |
NTI Audio M2211 (with calibration file) Steinberg UR12 (with phantom power for the microphones) Creative X7, Smaart v.7 Own anechoic chamber, 3.5 x 1.8 x 2.2 m (LxTxH) Axial measurements, perpendicular to the centre of the sound source(s), measuring distance 50 cm Noise emission in dBA (slow) as RTA measurement Frequency spectrum as graphic |
| OS: | Windows 10 Pro (all updates, current certified drivers) |

- 1 - Low-Level-Benchmarking with FrameView
- 2 - Power Consumption in real time with NVIDIA PCAT
- 3 - igorsLAB Interpreter and Template
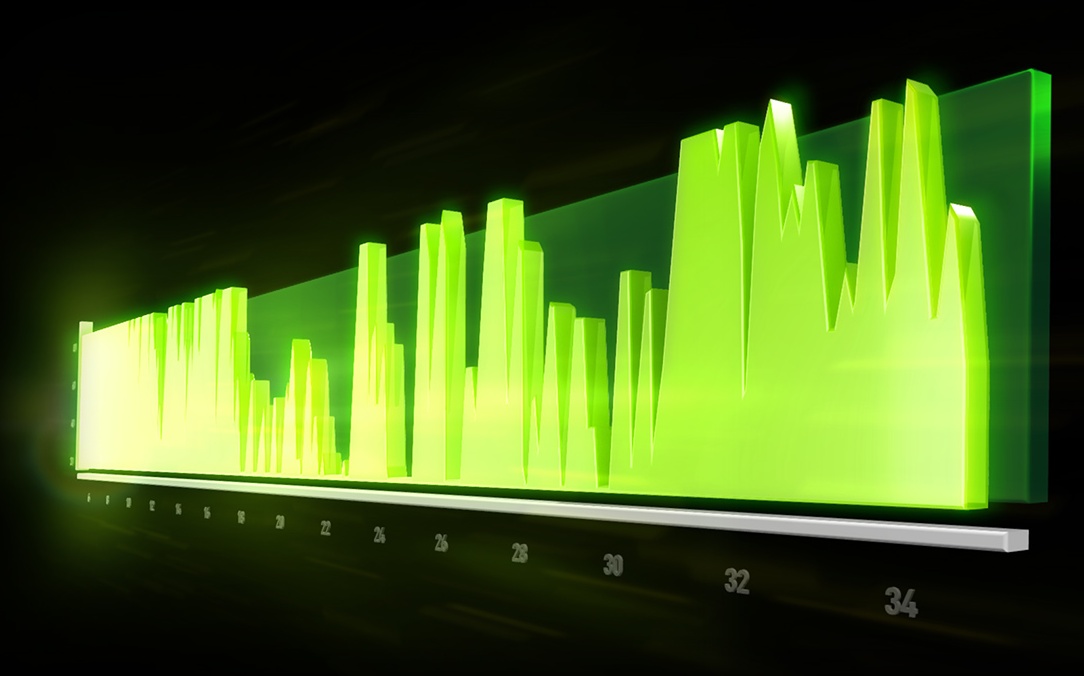
- 4 - FPS and Percentile, Bar Graph and Curves
- 5 - Frame Time and Variances as Bar Graph and Curve
- 6 - Power Consumption and Effiziency in Games (GPU and CPU)
- 7 - Scope Measuring, Transients, PSU Recommendation


18 Antworten
Kommentar
Lade neue Kommentare
Urgestein
Urgestein
Urgestein
1
Urgestein
Urgestein
Urgestein
Urgestein
Urgestein
1
Urgestein
Urgestein
Urgestein
Urgestein
Urgestein
Mitglied
Neuling
Neuling
Alle Kommentare lesen unter igor´sLAB Community →