


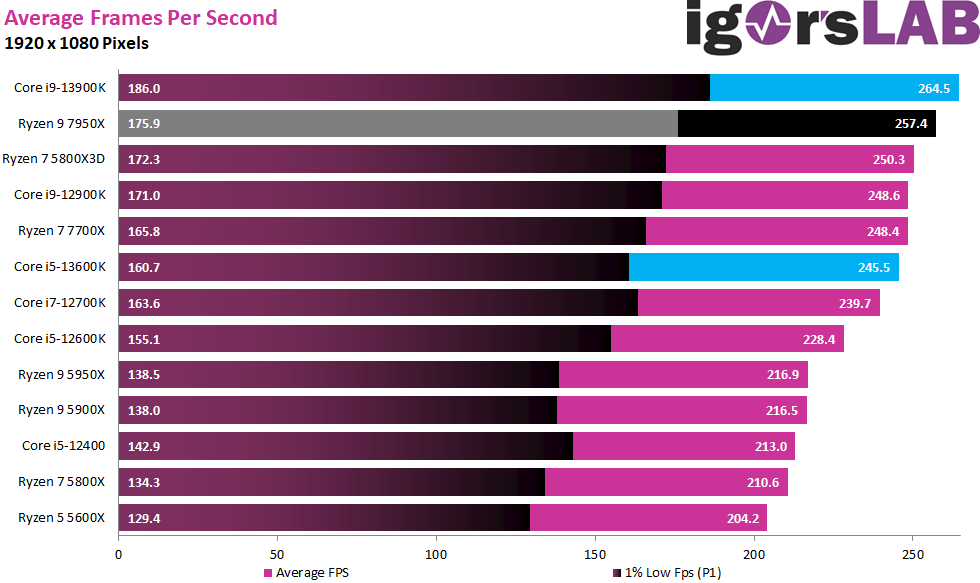
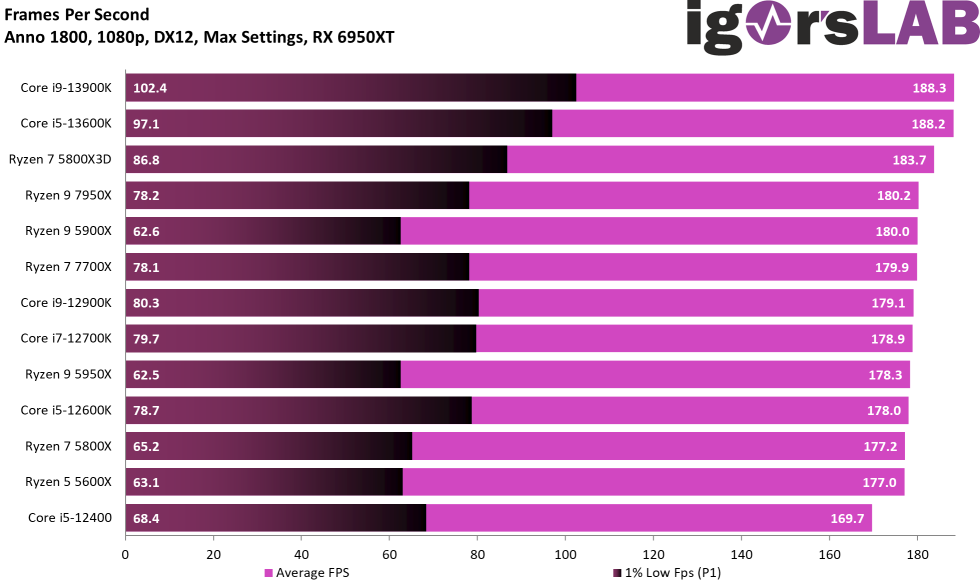
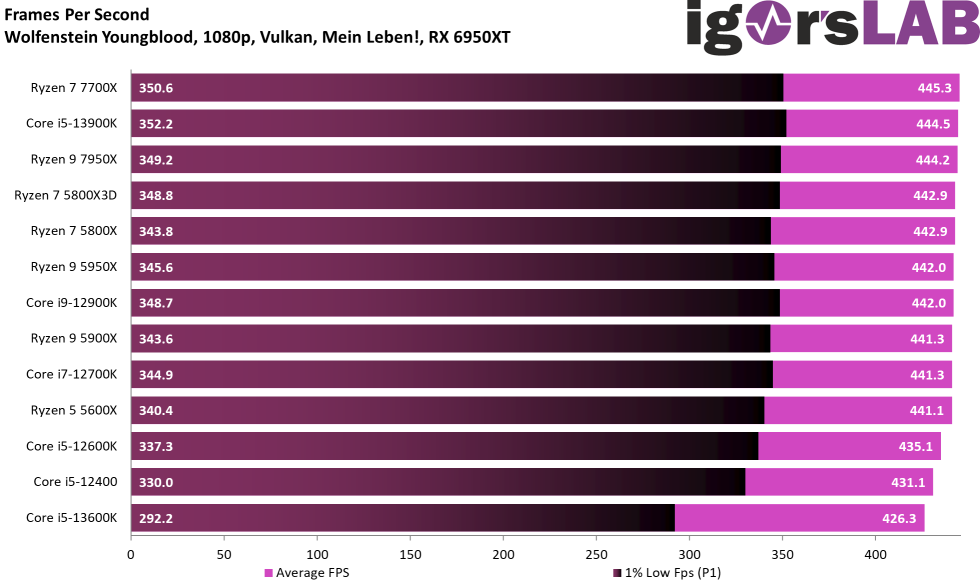
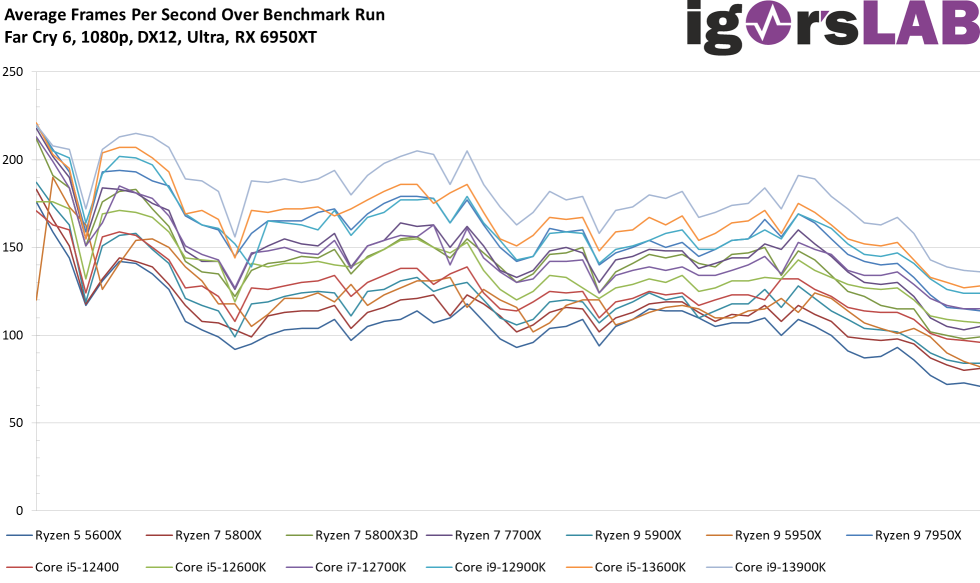
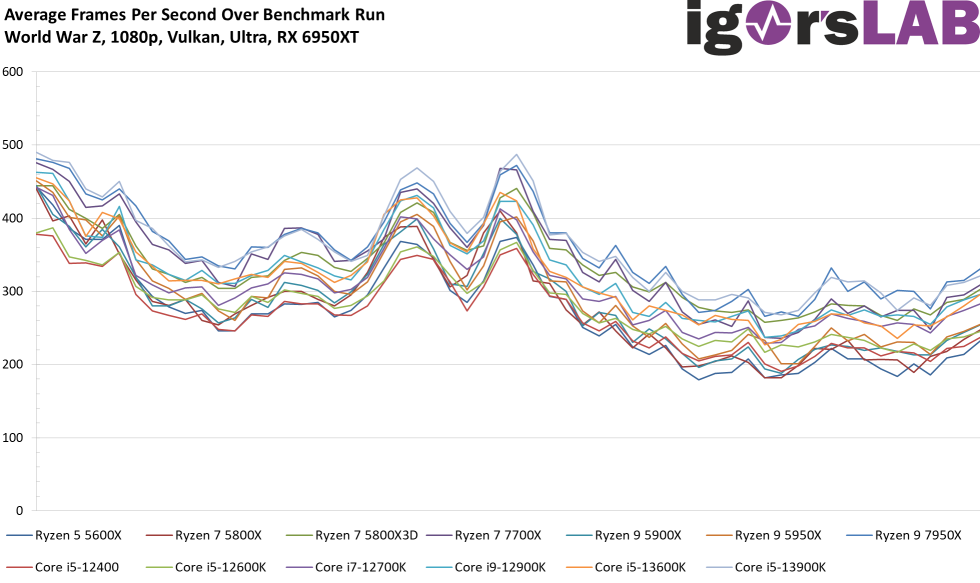
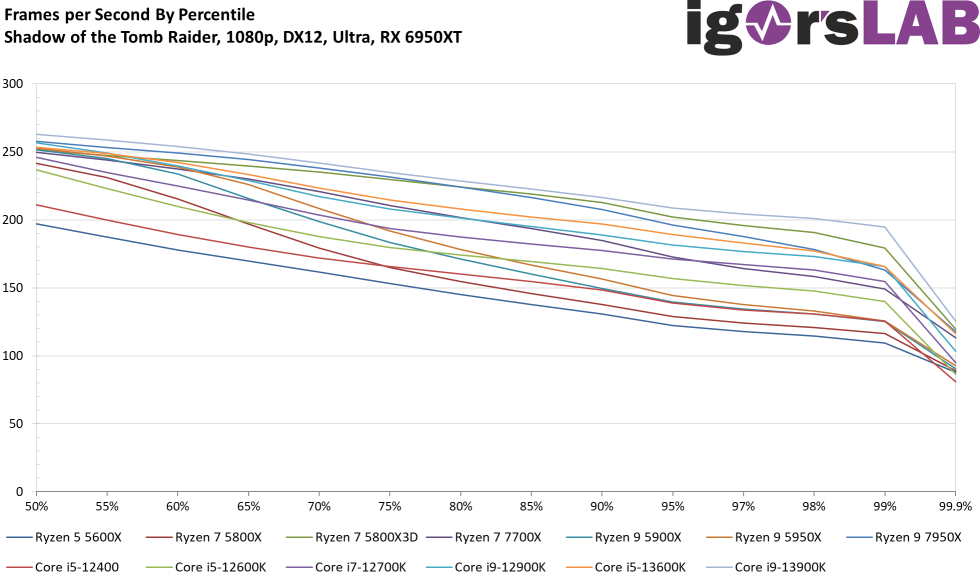
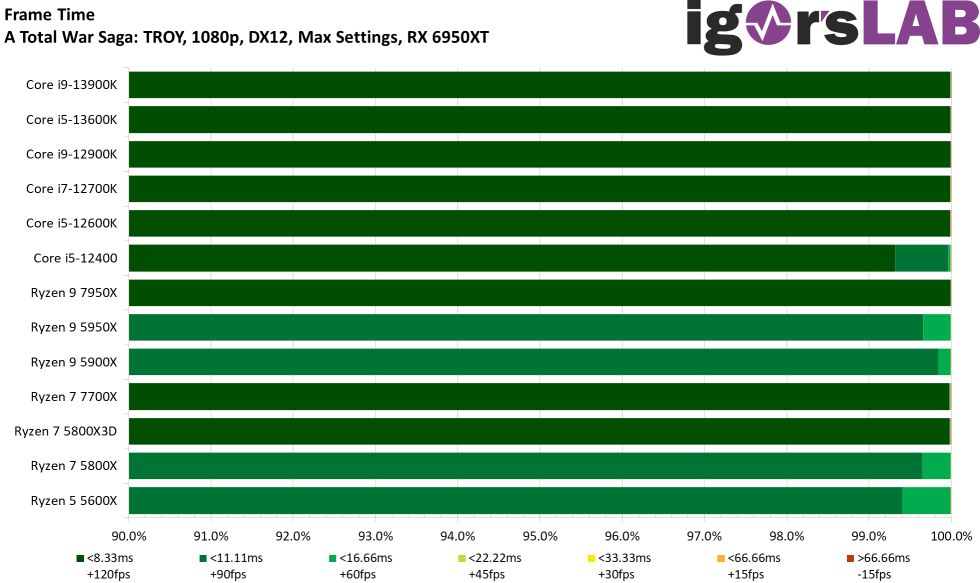
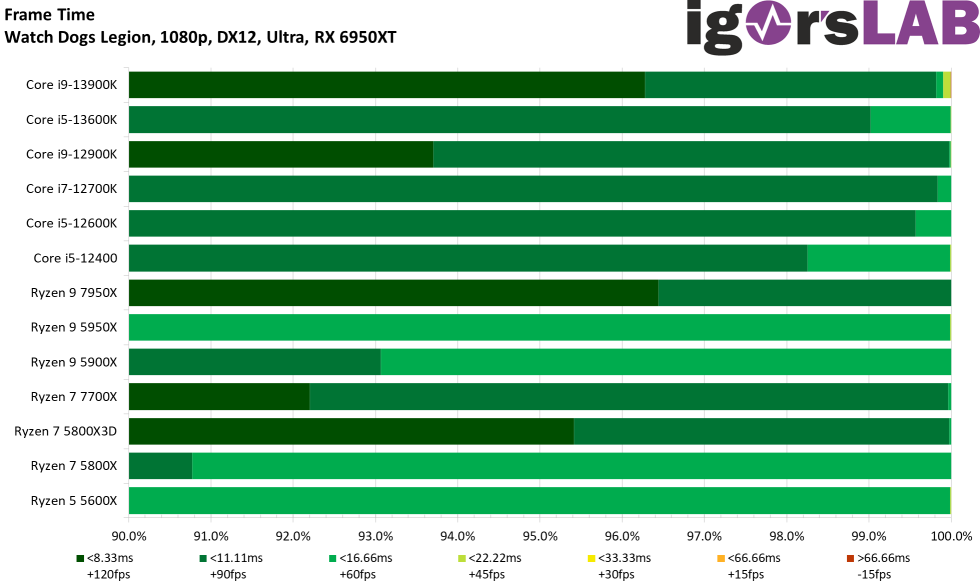
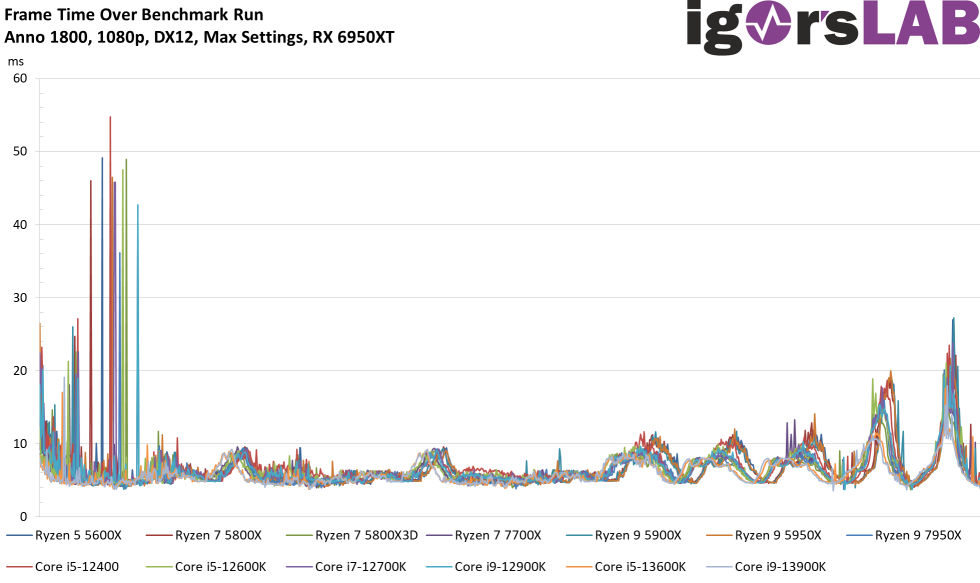
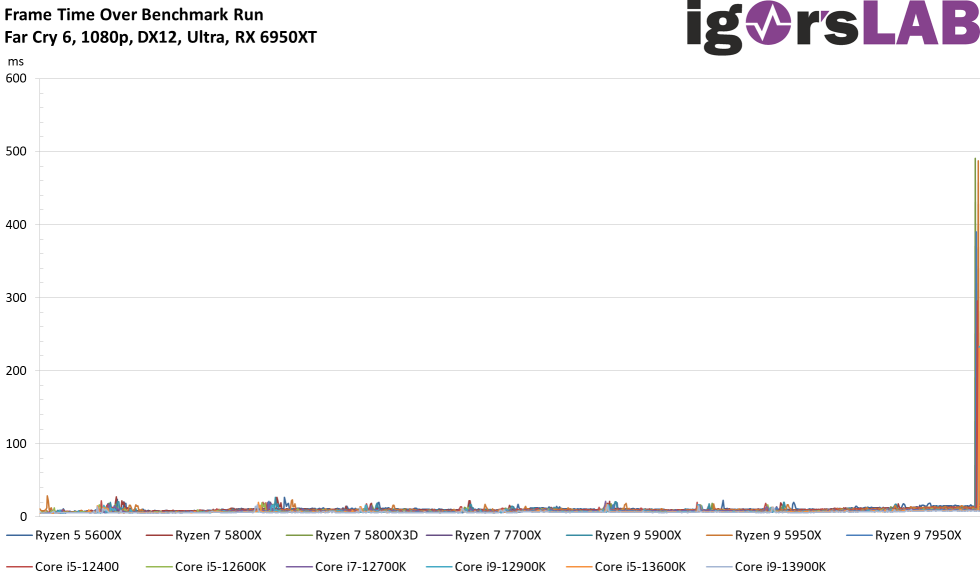
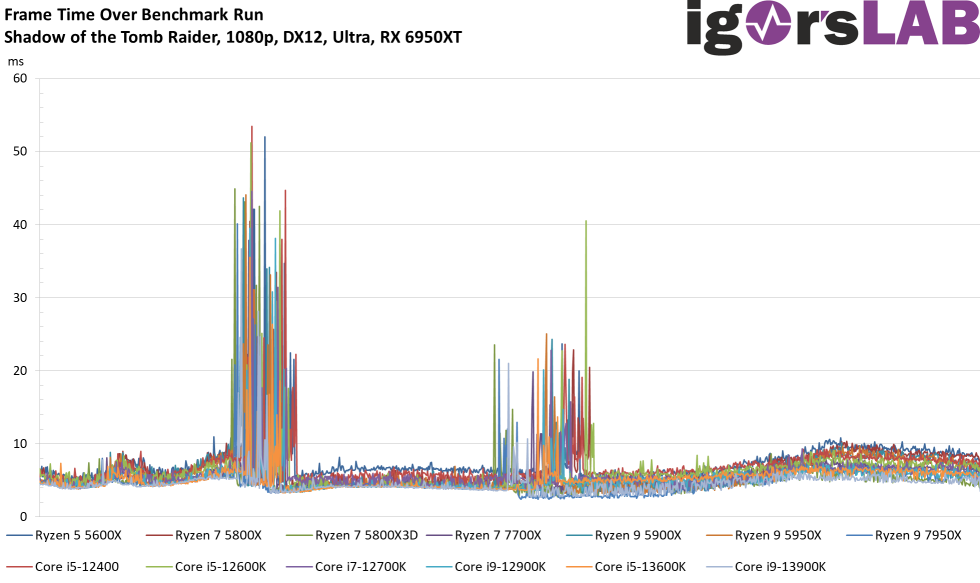
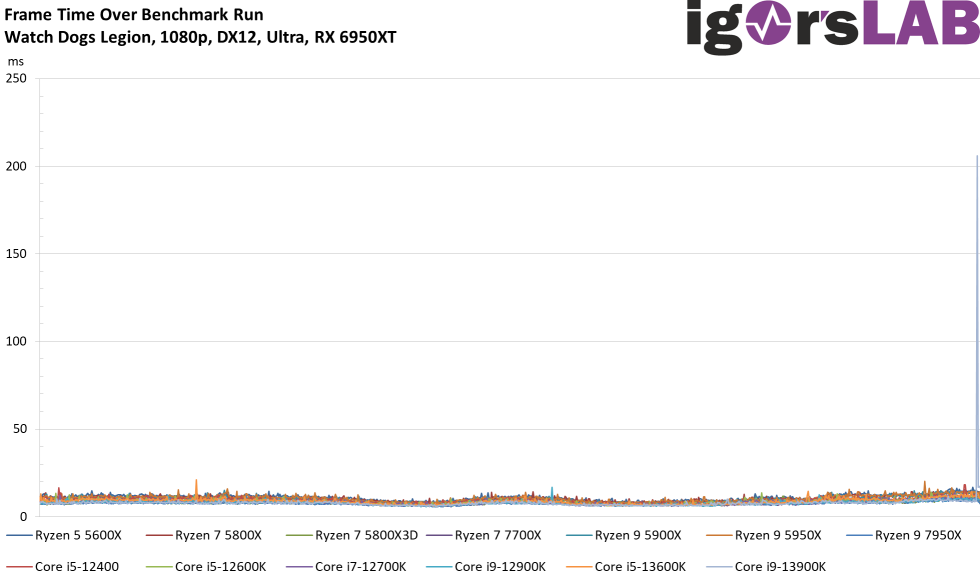
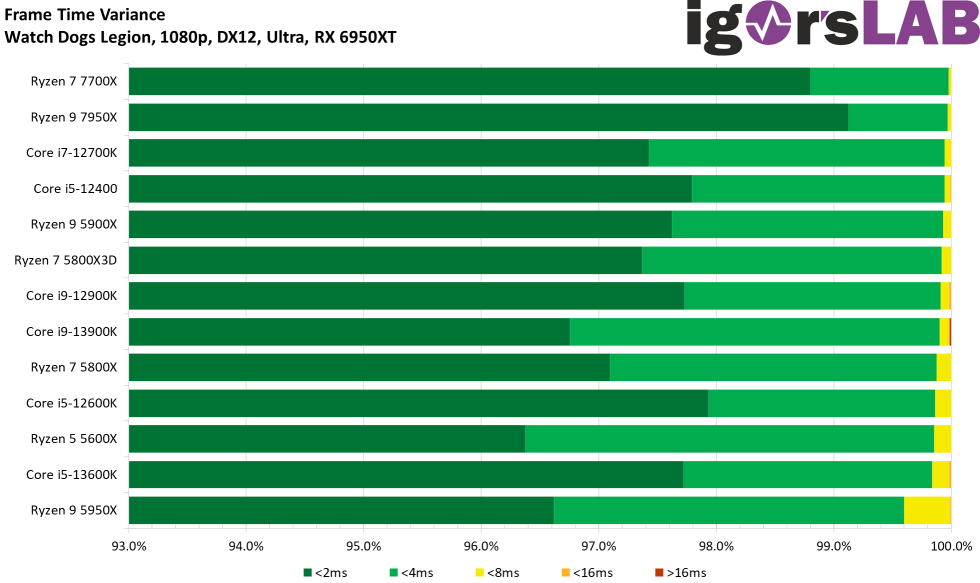
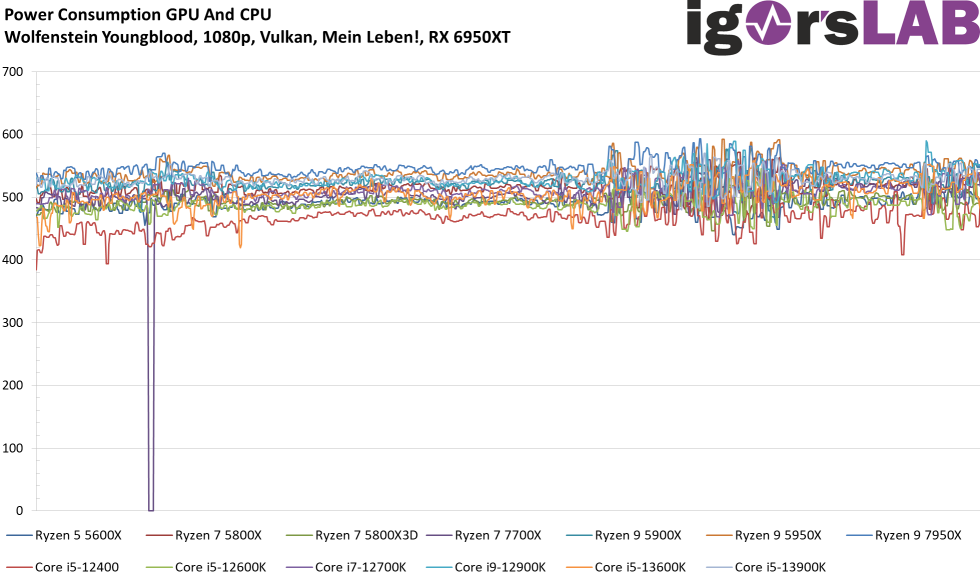
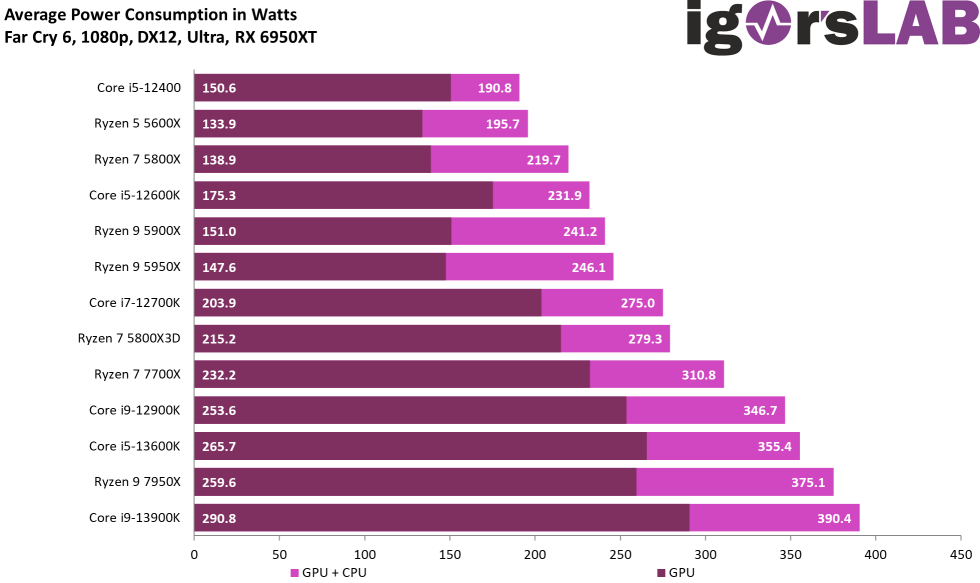
Summary of gaming performance in 1080p
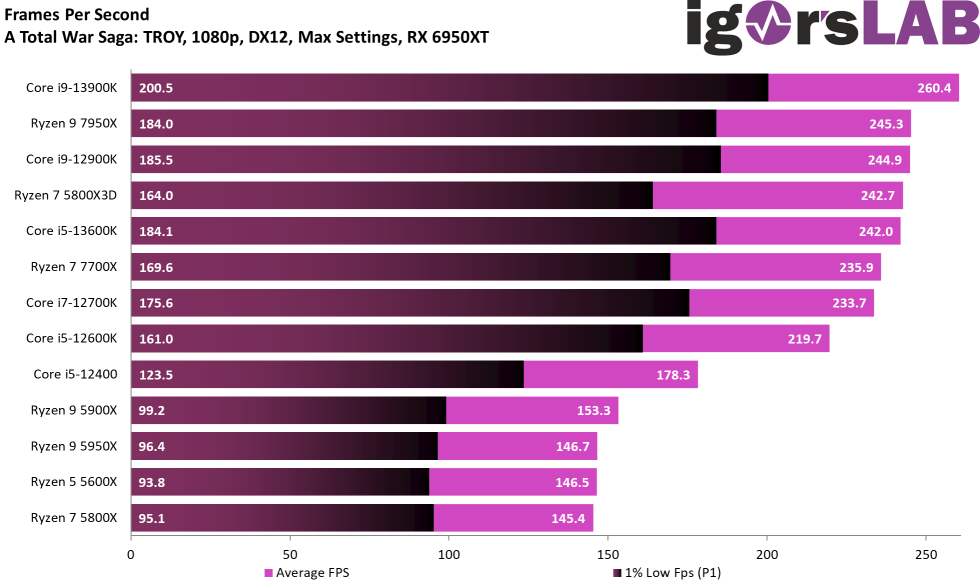
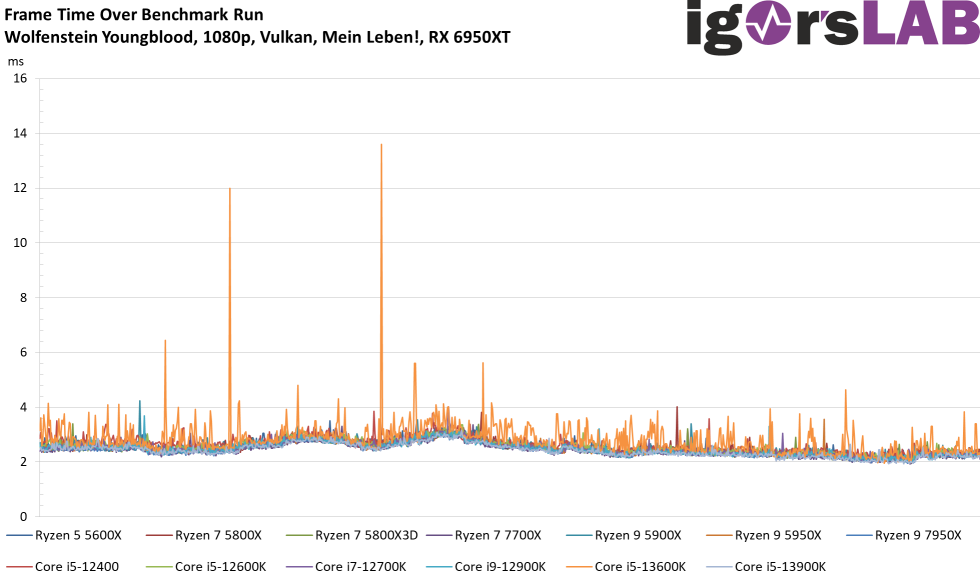
We now see that the bars converge more among each other in Full HD because the GPU comes more into play. The fact that AMD recommended a Radeon RX 6950XT was something I could understand for quite some time in the 720p benchmark. I had already shown in the Ryzen 7 5800X3D review that NVIDIA’s overhead has a negative impact on the bars. In Full HD, on the other hand, the situation is balanced and the first real GPU limitations appear. Since NVIDIA was already able to eliminate the DirectX12 overhead in the launch driver for the GeForce RTX 4090 Ti, I will still wait for the launch of the new RDNA3 cards and then also adjust the test setup with the new cards. Until then, we will live with whatever seems most appropriate at the moment.
And how do the new CPUs perform in Full HD? The Intel Core i9-13900K is ahead of the AMD Ryzen 9 7950X as well as the Ryzen 7 5800X3D X and then only the Core i9-12900K follows, which in turn displaces the Ryzen 7 7700X by a razor-thin margin. However, the Core i5-13600K follows the Ryzen 7 7700X quite closely and is still ahead of the Core i7-12700K. It already wrote that the summary for the power consumption and efficiency across all games will follow later on a separate page.
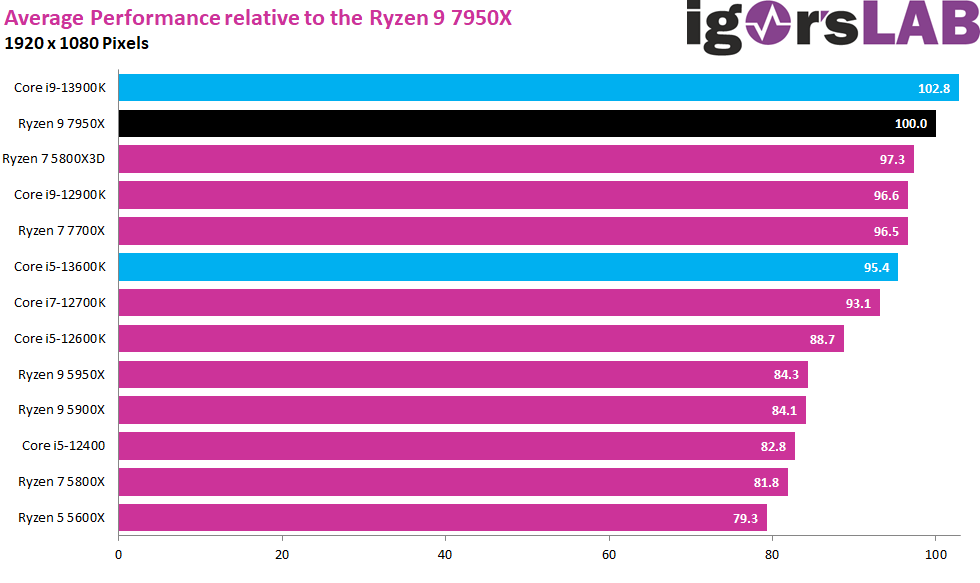
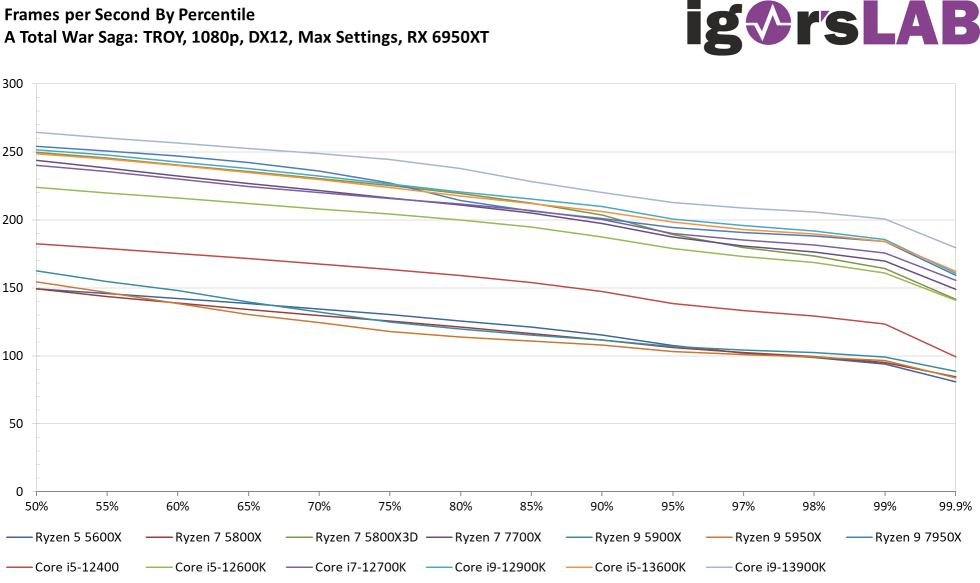
The Ryzen 9 7950X is again just under 3 percentage points behind the new Core i9-13900K, which is a good 6 percentage points ahead of the Ryzen 7 7700X and 7 percentage points ahead of the Core i5-13600K. This beats the Core i7-12700K by 2.3 percentage points and the Core i5 12600K by just under 7 percentage points. Yes, the fronts are still clear here as well, but Intel’s 13th generation is not yet ready. The third generation is still ahead, although I will of course test the Ryzen 5 7600X and Ryzen 9 7900X, which were unfortunately delivered a bit too late. How they will position themselves against the Core i5-13600K or Core i7-13700K remains to be seen.
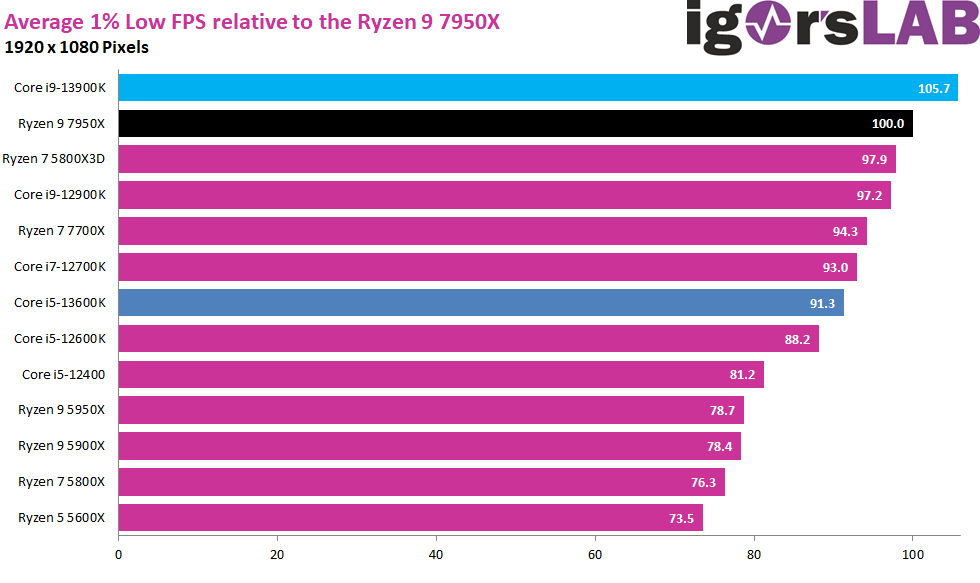
More interesting is again the output at the P1, i.e. the new Min FPS. The Intel Core i9-13900K is also in the lead here, with a very clear 5.7 percentage points. The Core i5 13600K can recover slightly and now clearly beats the Core i5-12600K by a good 3 percentage points.
Performance metrics


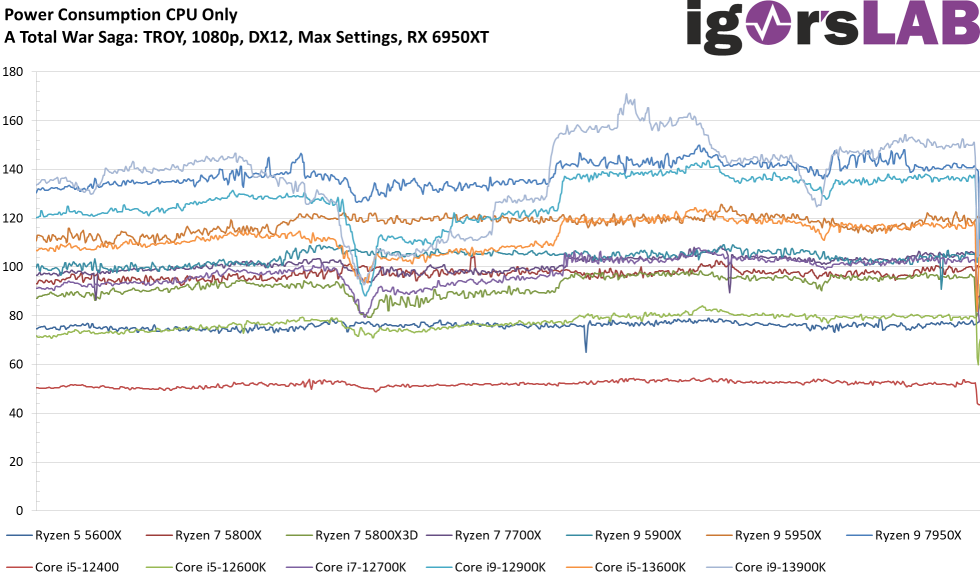
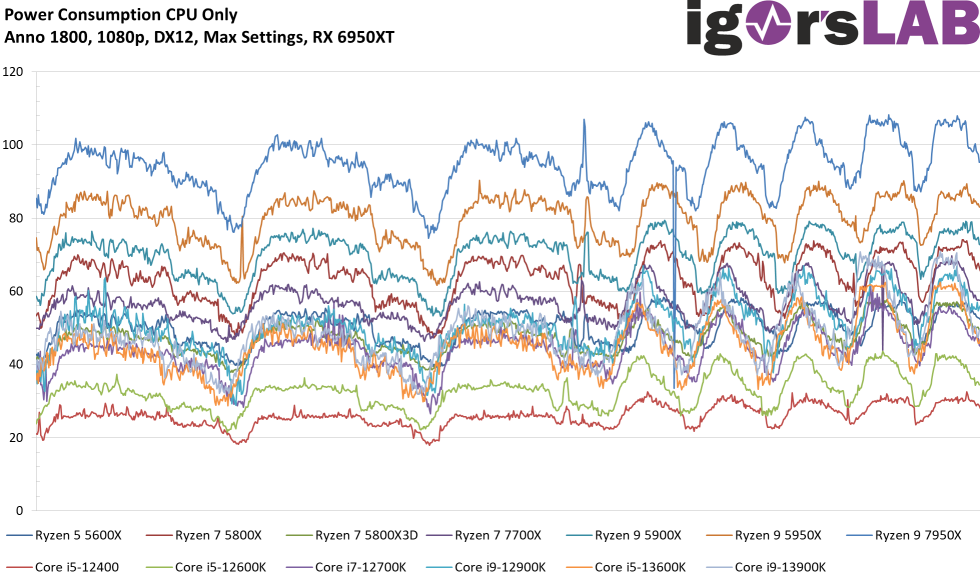
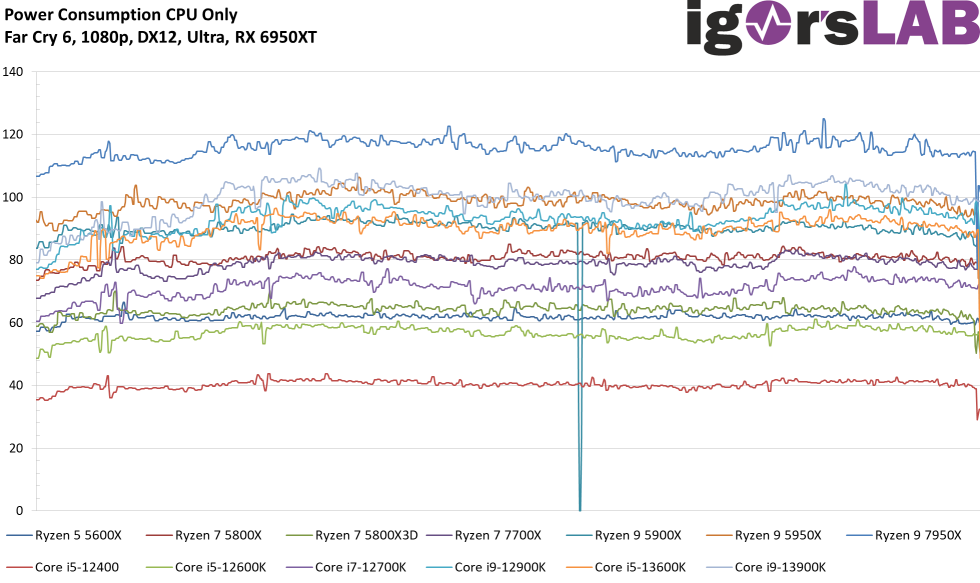
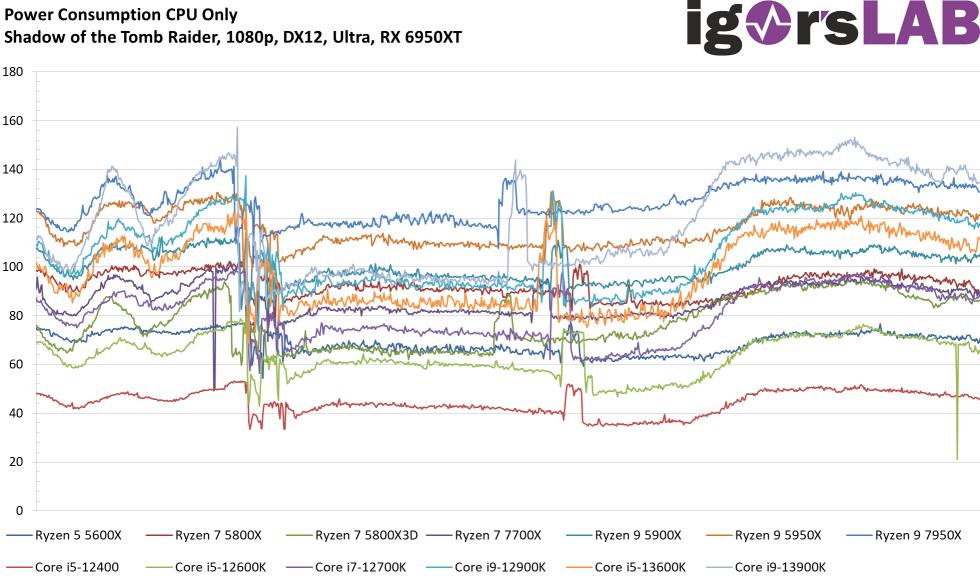
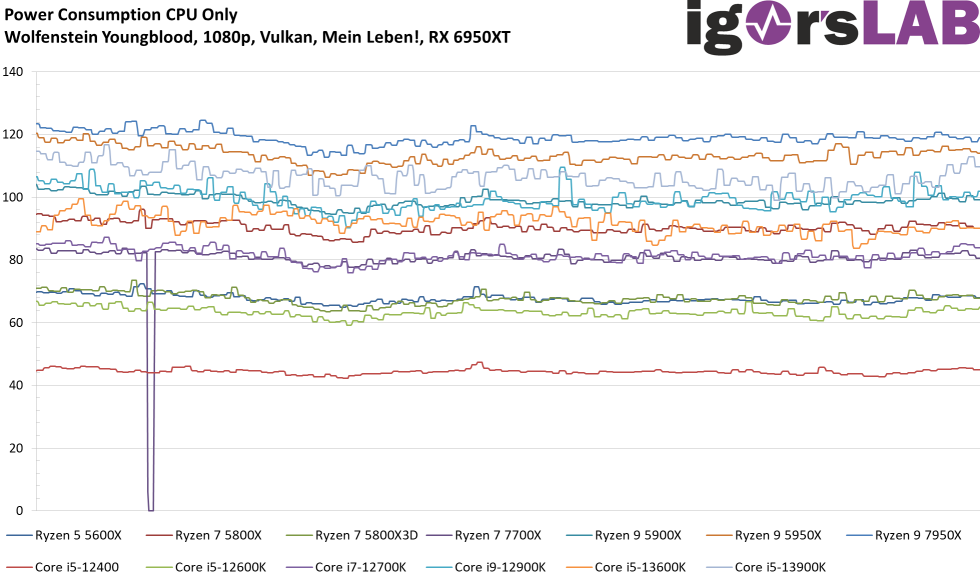
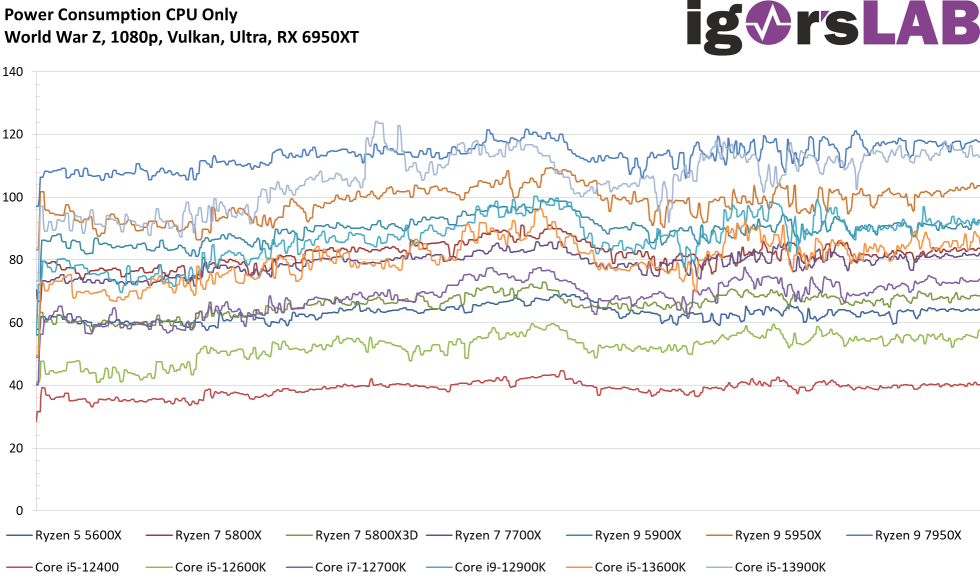
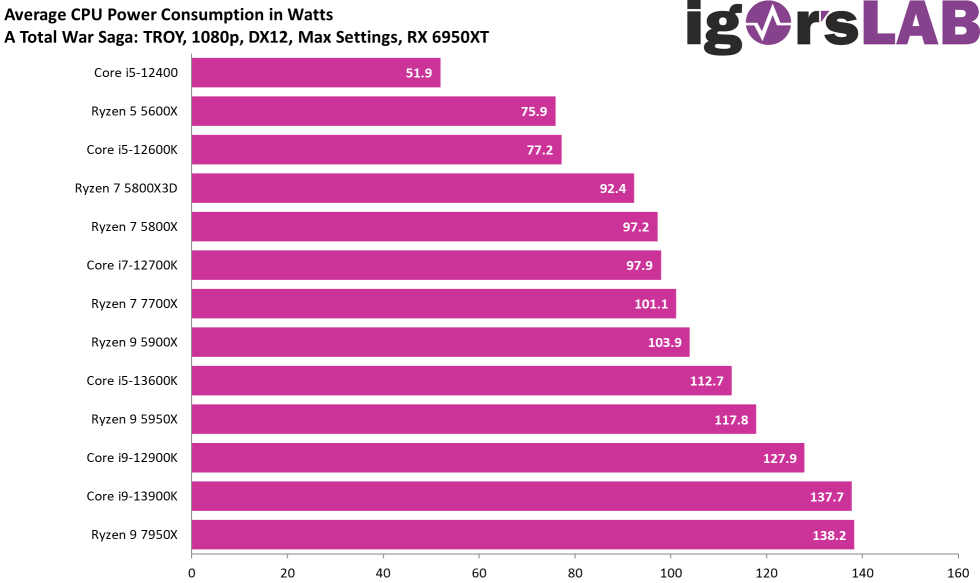
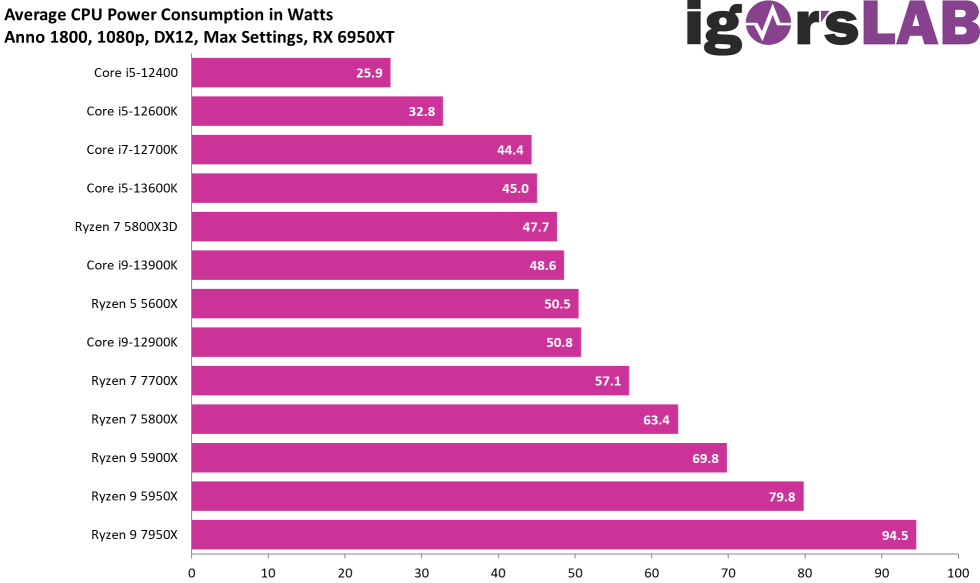
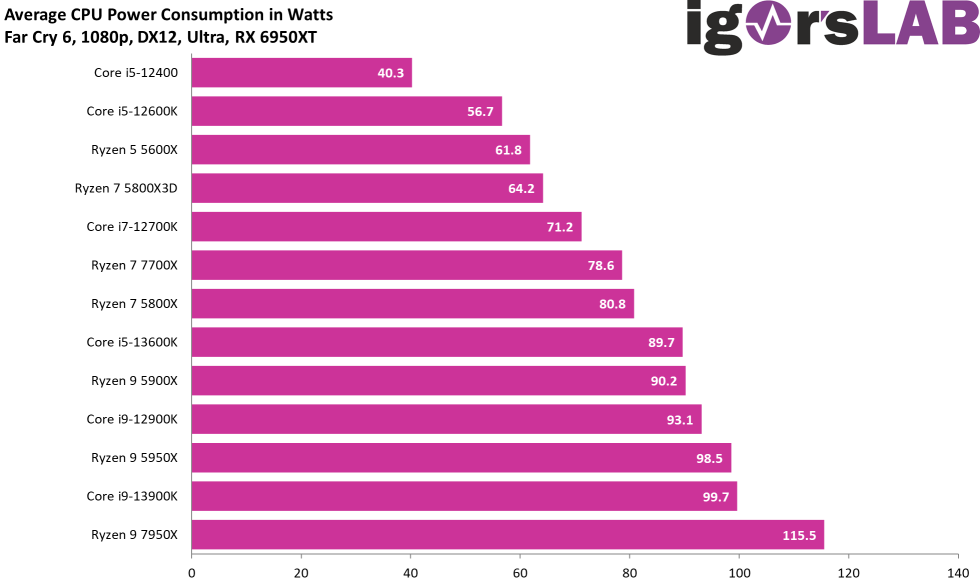
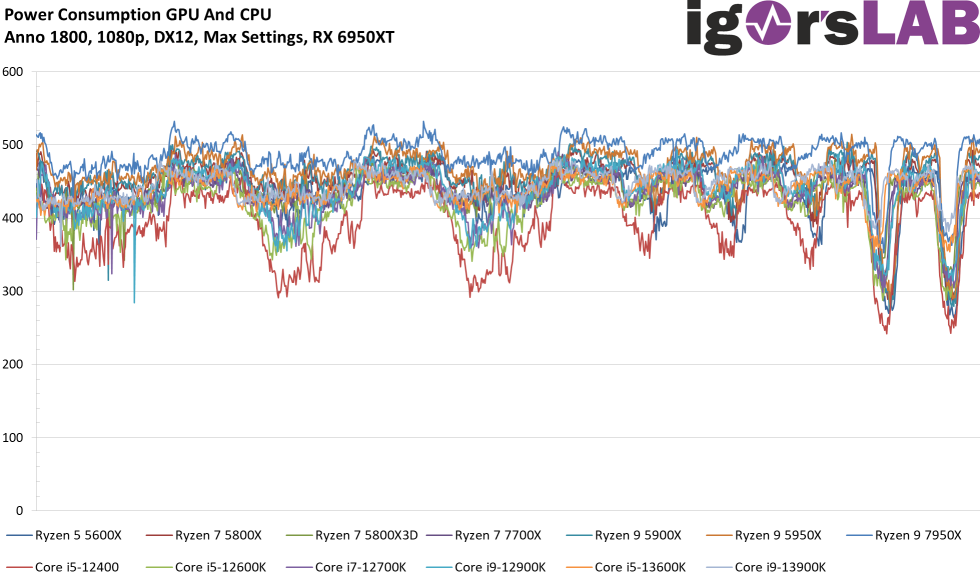
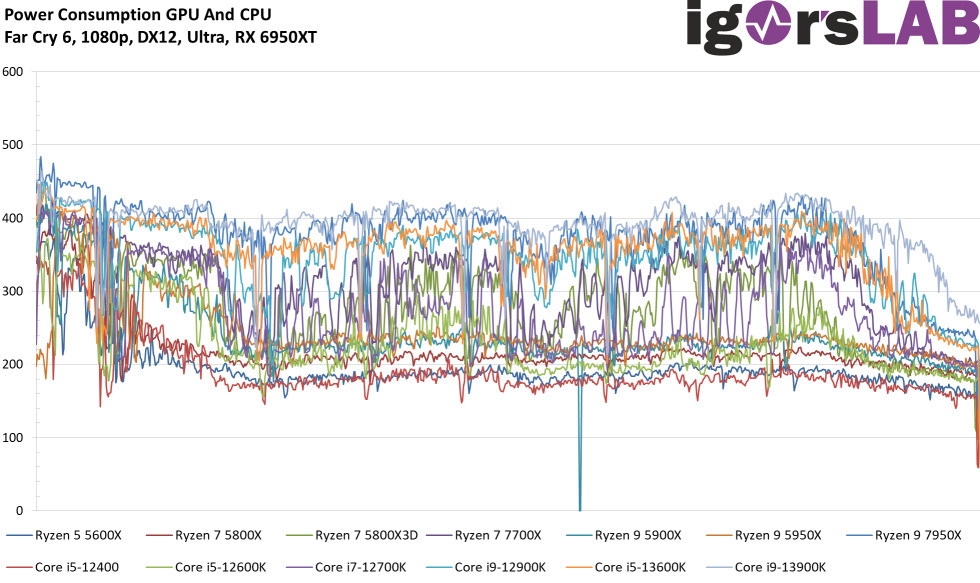
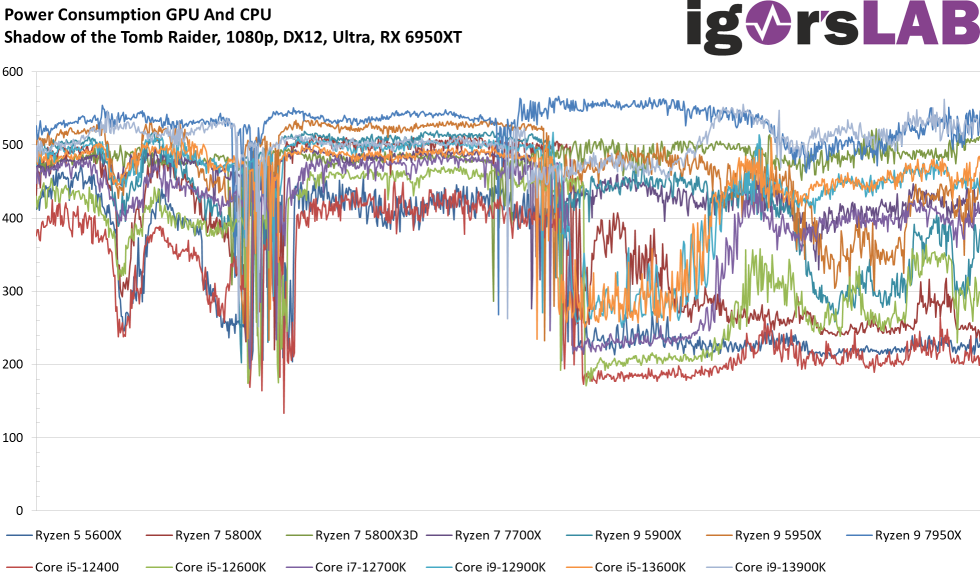
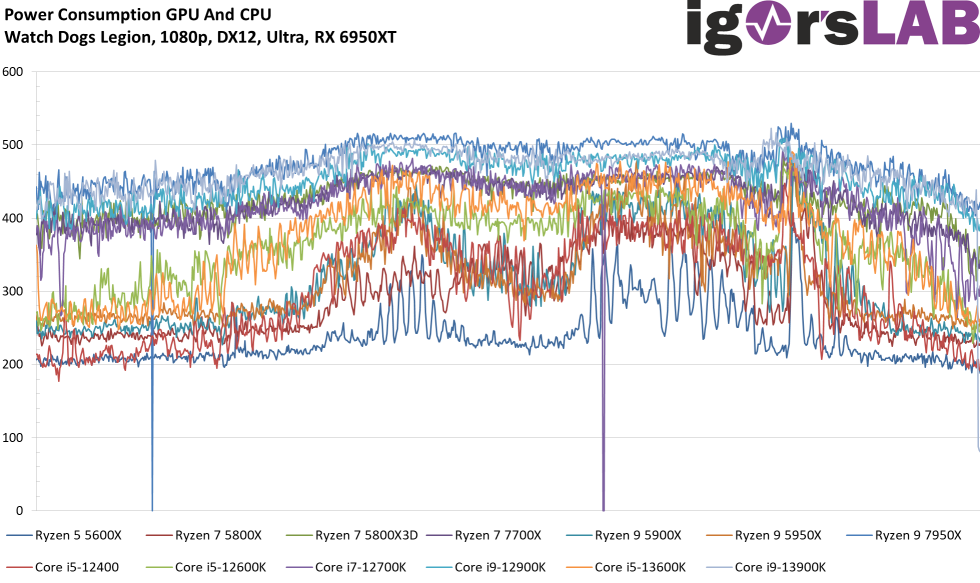
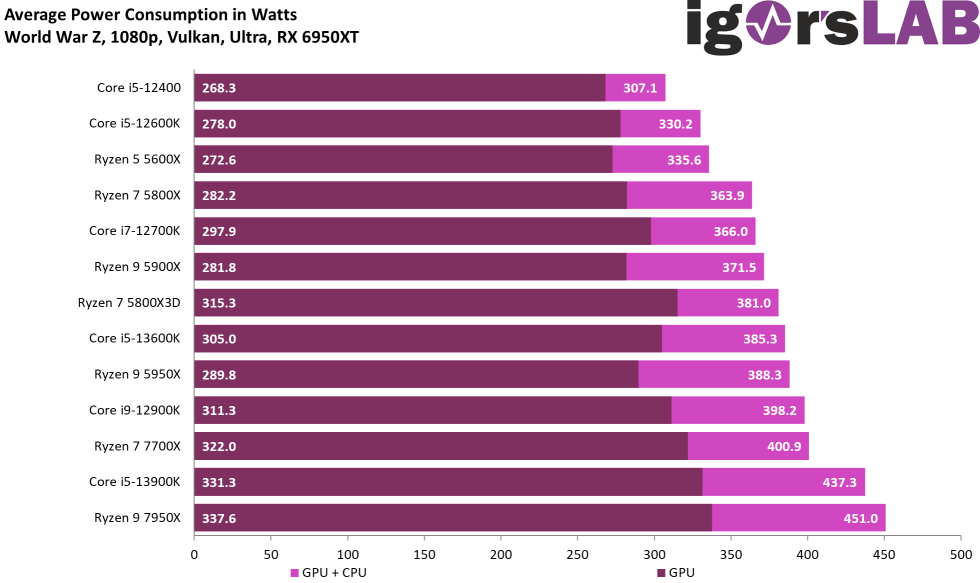
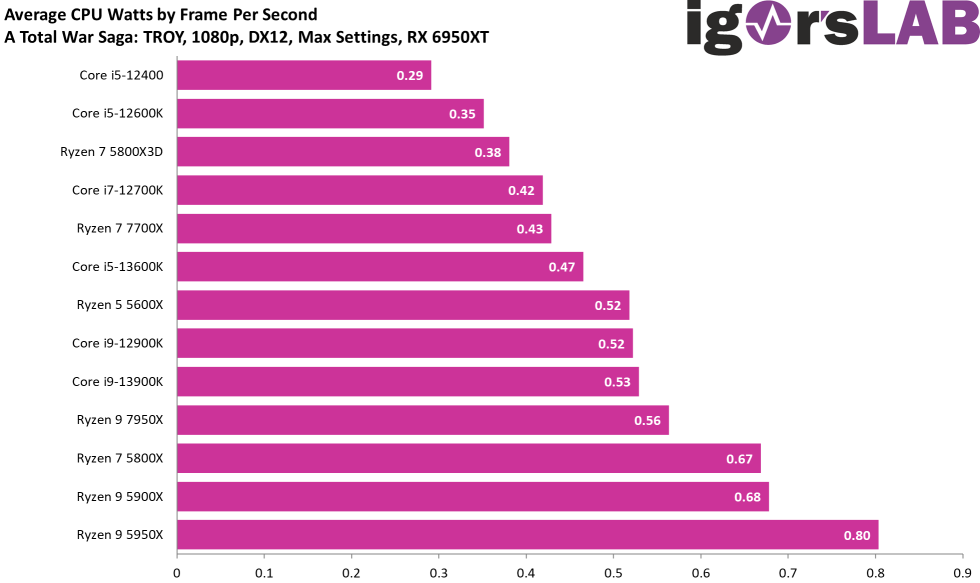
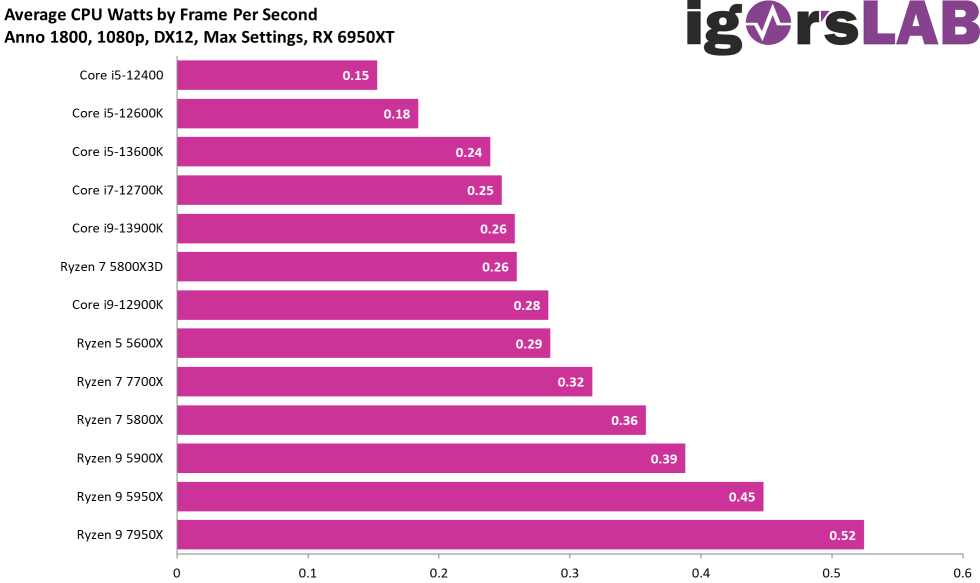
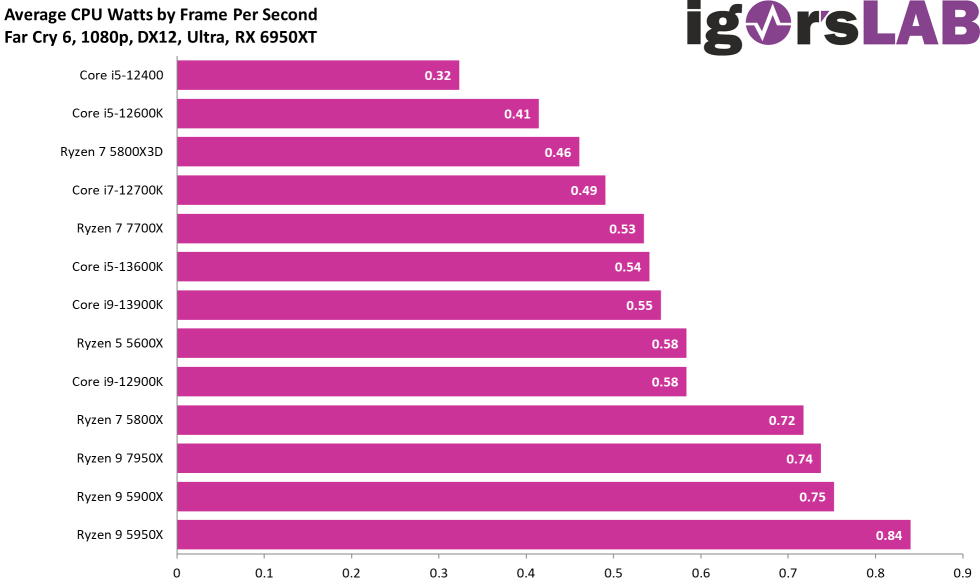
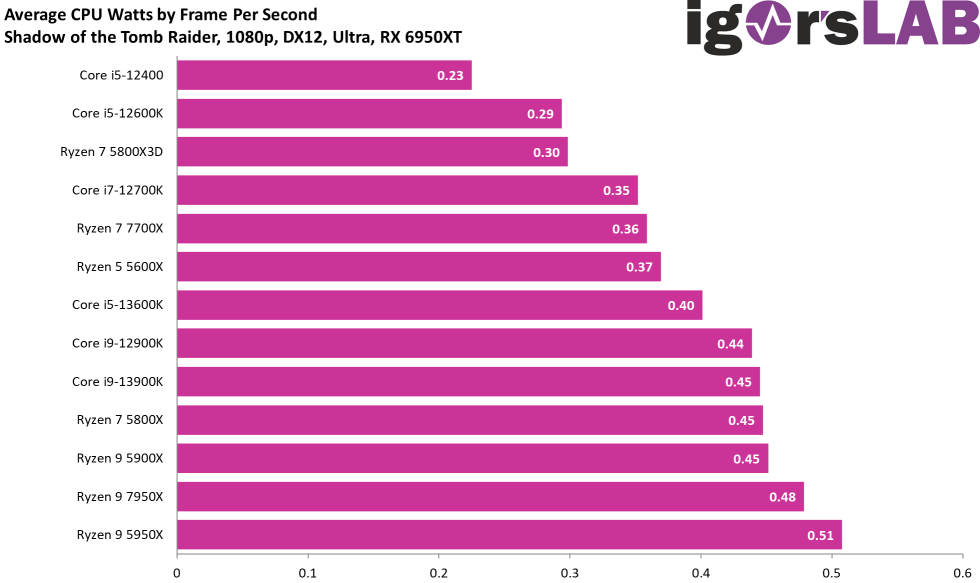
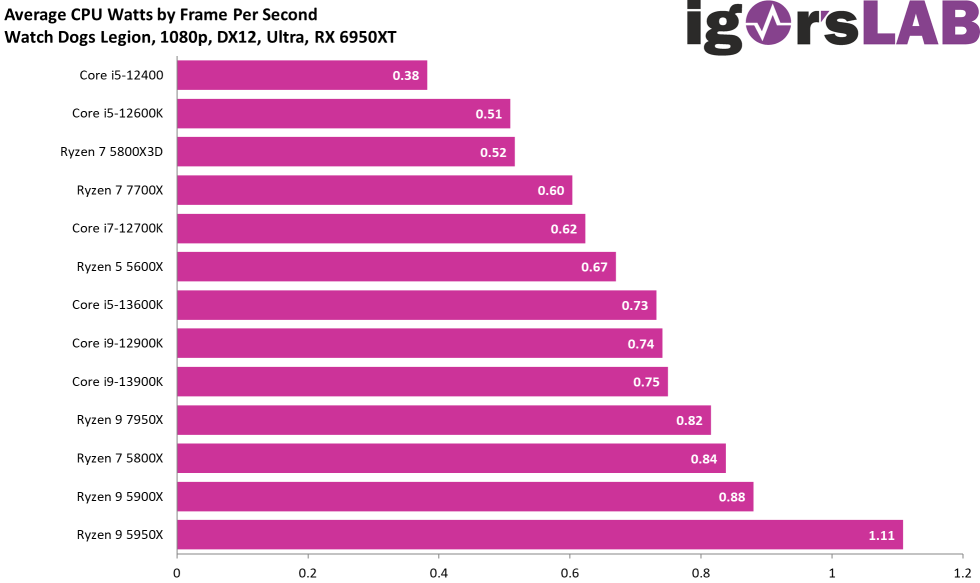
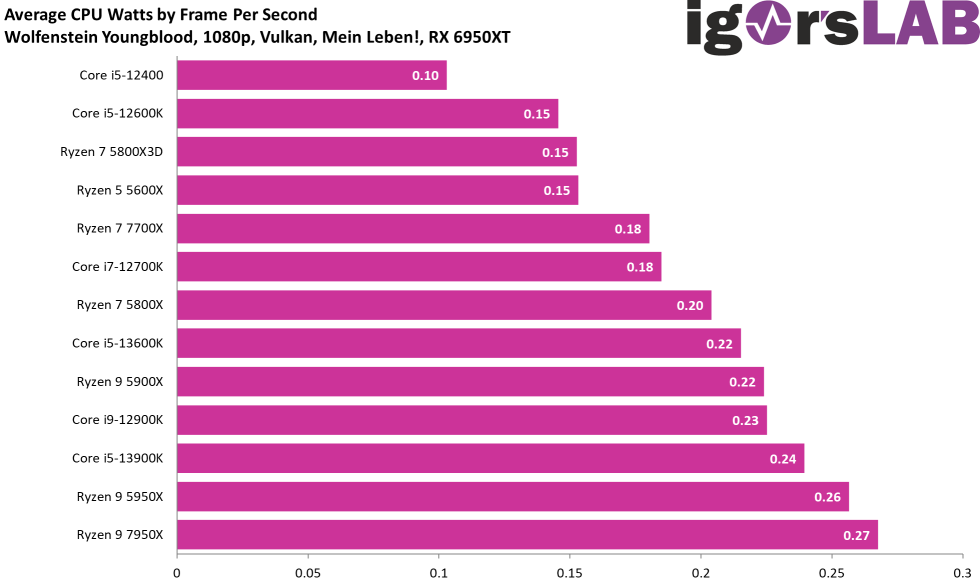
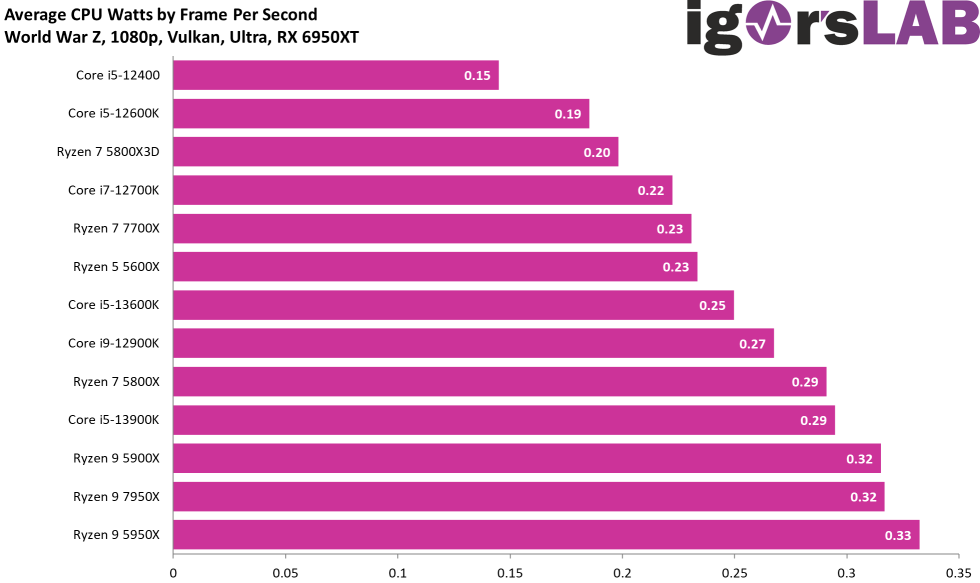
Power Draw and Single Efficiency


- 1 - Introduction, preface and CPU specs
- 2 - What's new with Raptor Lake?
- 3 - Test setup and methodology
- 4 - Gaming Performance HD Ready (1280 x 720 Pixels)
- 5 - Gaming Performance Full HD (1920 x 1080 Pixels)
- 6 - Gaming Performance WQHD (2560 x 1440 Pixels)
- 7 - Autodesk AutoCAD 2021
- 8 - Autodesk Inventor 2021 Pro
- 9 - Rendering, Simulation, Financial, Programming
- 10 - Science and Math
- 11 - Power consumption and efficiency
- 12 - Summary and conclusion


175 Antworten
Kommentar
Lade neue Kommentare
Veteran
1
Mitglied
Veteran
Mitglied
Veteran
Veteran
Veteran
Mitglied
Urgestein
Veteran
Mitglied
Urgestein
Mitglied
1
Urgestein
Mitglied
Urgestein
Veteran
Alle Kommentare lesen unter igor´sLAB Community →