


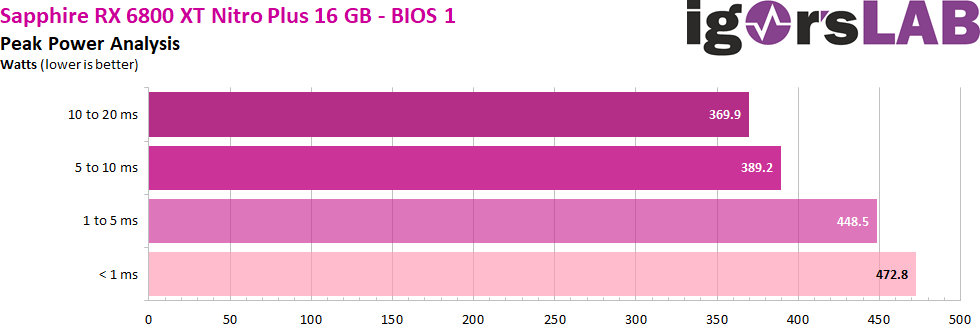
Load peaks (transients) and power supply recommendation
As I have already proved in detail in my basic article “The battle of graphics card against power supply – power consumption and load peaks demystified”, there are also higher loads in the millisecond range, which can lead to unexplainable shutdowns in the case of unfavorably designed or improperly equipped power supplies. The TBP (Typical Board Power) measured by the graphics card manufacturer or the reviewers alone does not really help in this case for a stable system design. Peaks with intervals between 1 and 10 ms can lead to shutdowns in very fast reacting protective circuits (OPP, OCP), especially in multi-rail power supplies, although the average power consumption is still within the standard.
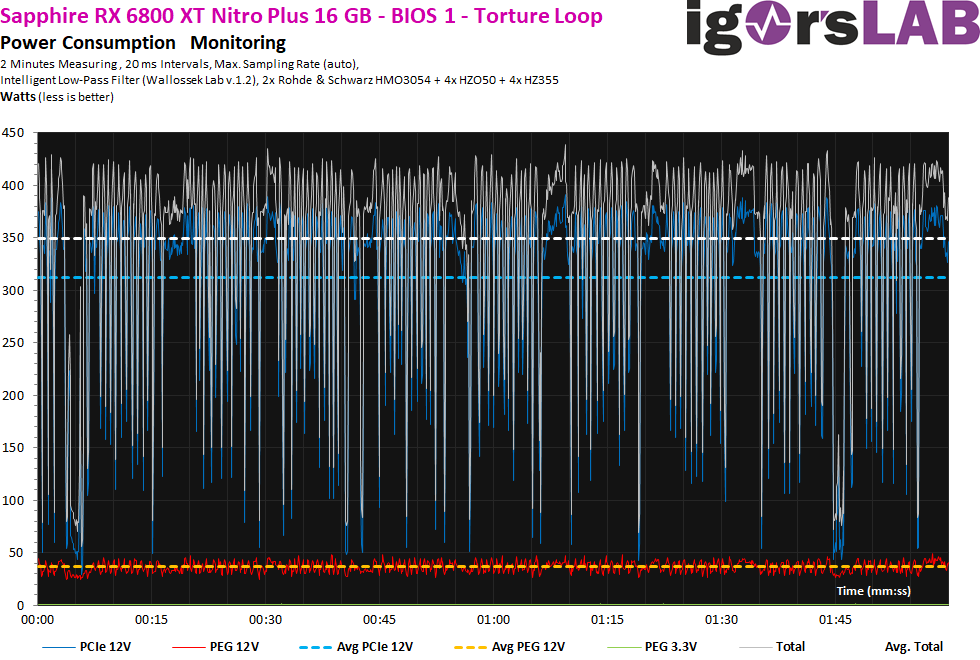
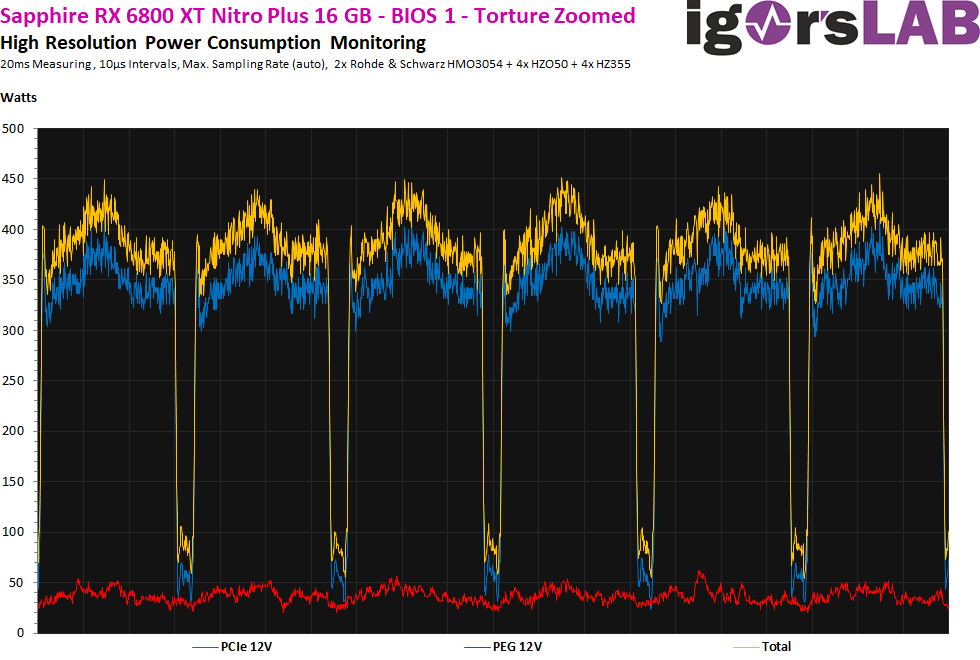
For the BIOS 1, I would therefore calculate with at least 400 watts for the normal OC as a proportion of the total power consumption of the system on the secondary side, in order to have enough reserves for the worst case scenario. If the 15% power limit is fully utilised, the continuous load would be 400 watts and peaks of 450 watts would have to be considered.
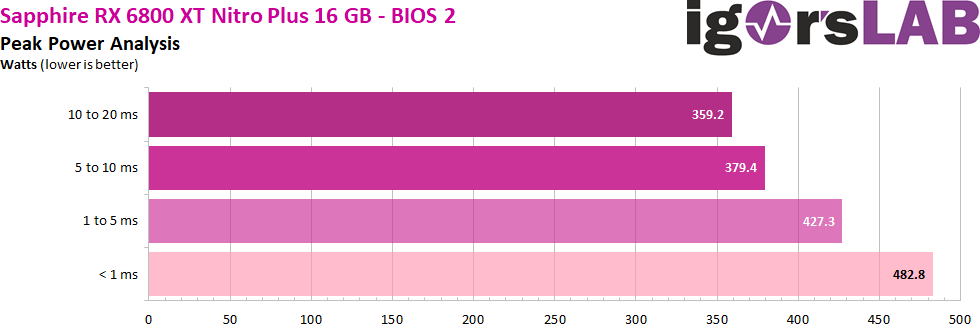
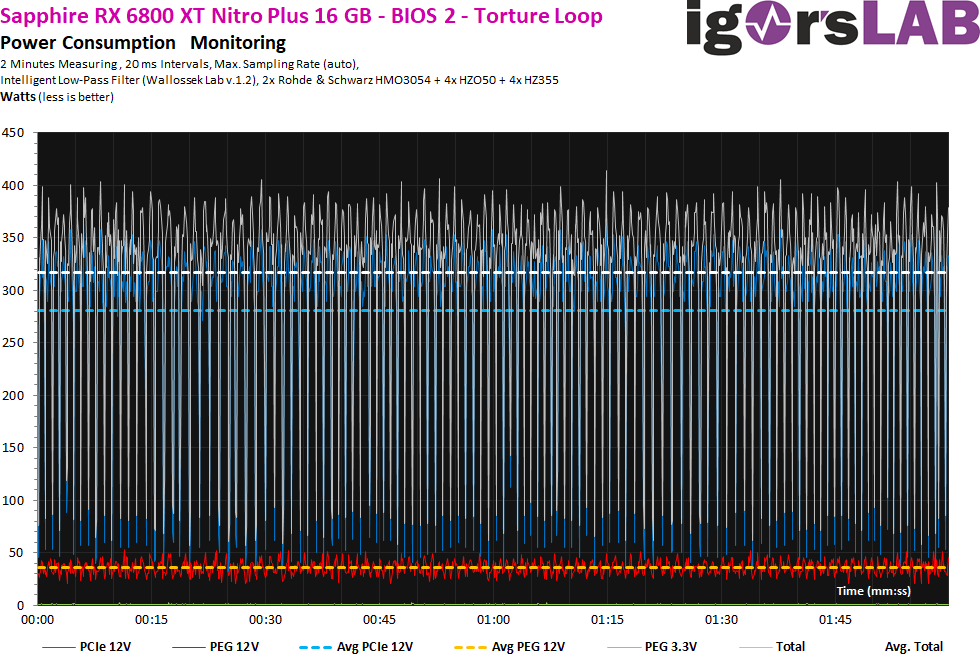
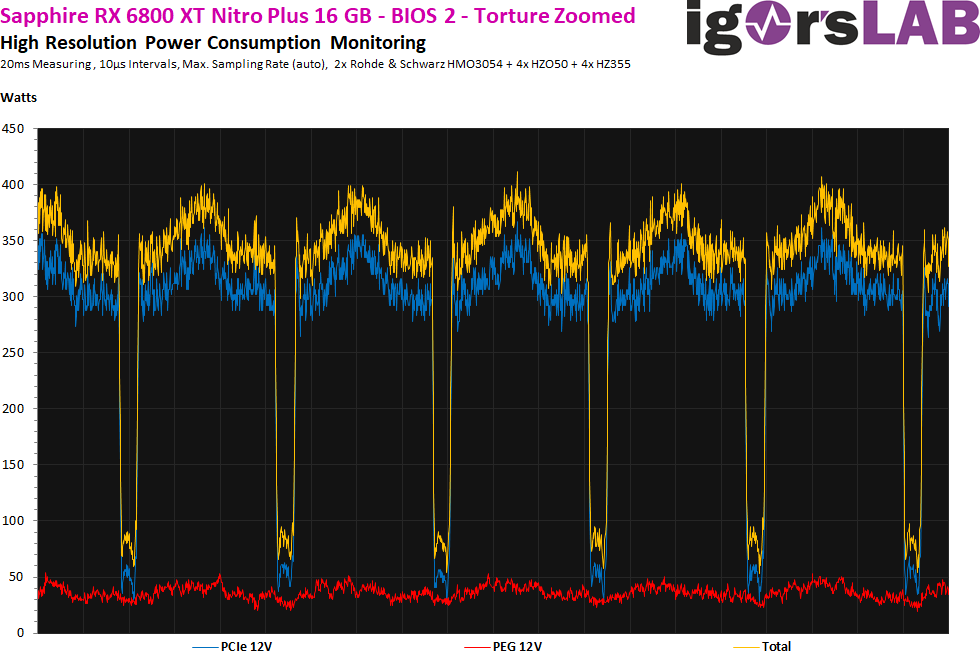
With the BIOS 2 everything turns out a felt number smaller, so that one can also count on an additional OC with approx. 400 Watts proportionally to the system power. This should also satisfy all precautions, unless it is an ultra cheap China firecracker from power supply or a 10 year old Methusalem. In spite of all the joy, unfortunately this is also not so little.
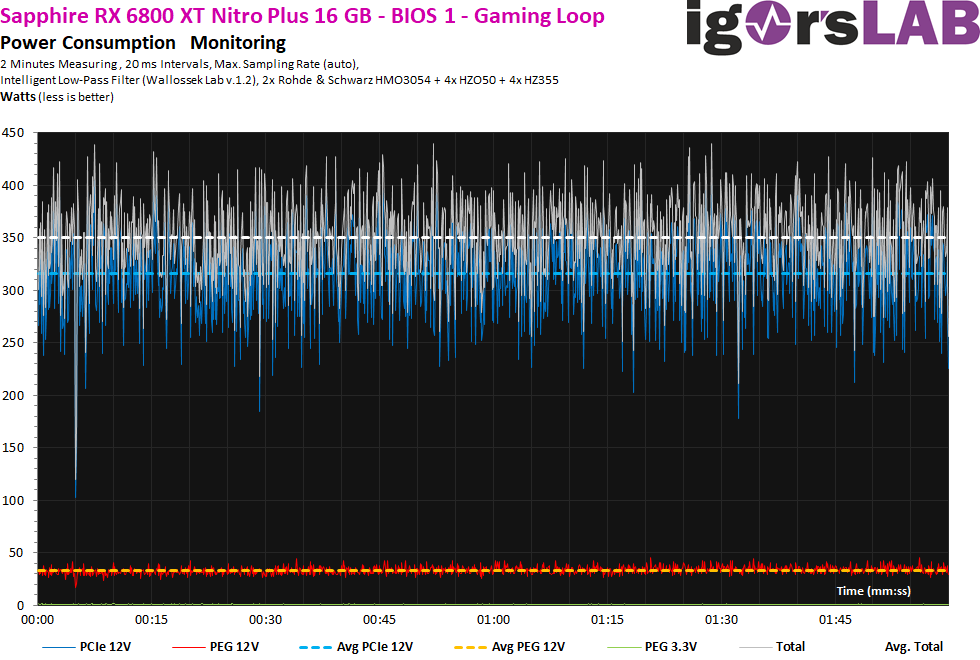
Transients as detailed graphics in different resolutions during gaming and stress testing
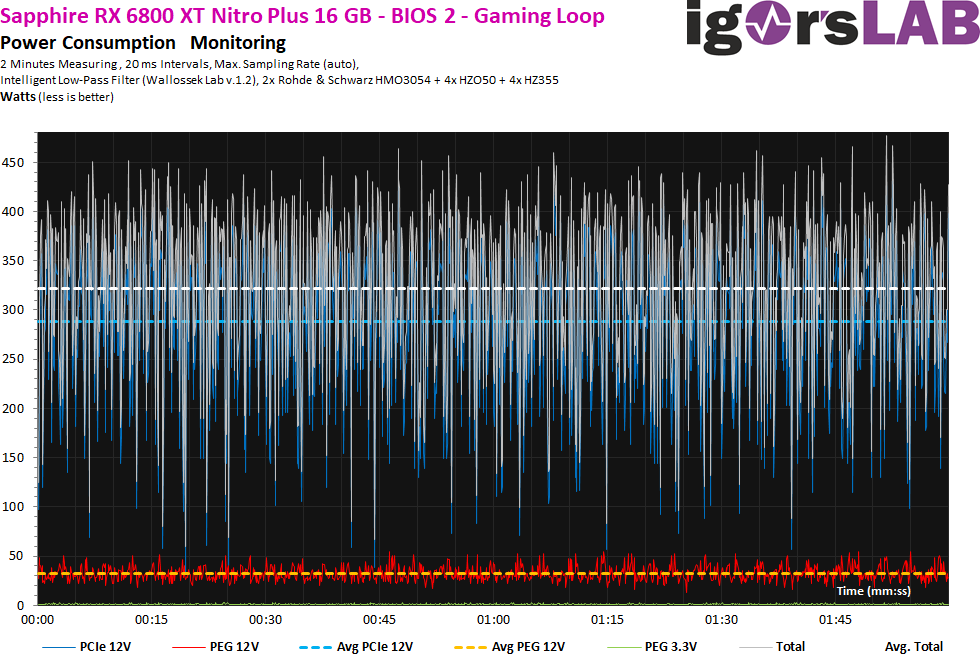
If we now compare BIOS 1 and 2, we see spikes of about the same height in the millisecond range, but they are regulated more frequently and much more extremely:
This applies to the same extent, if not even more so, to the stress test. Also for this there are the suitable measurements of both BIOSes as direct comparison:
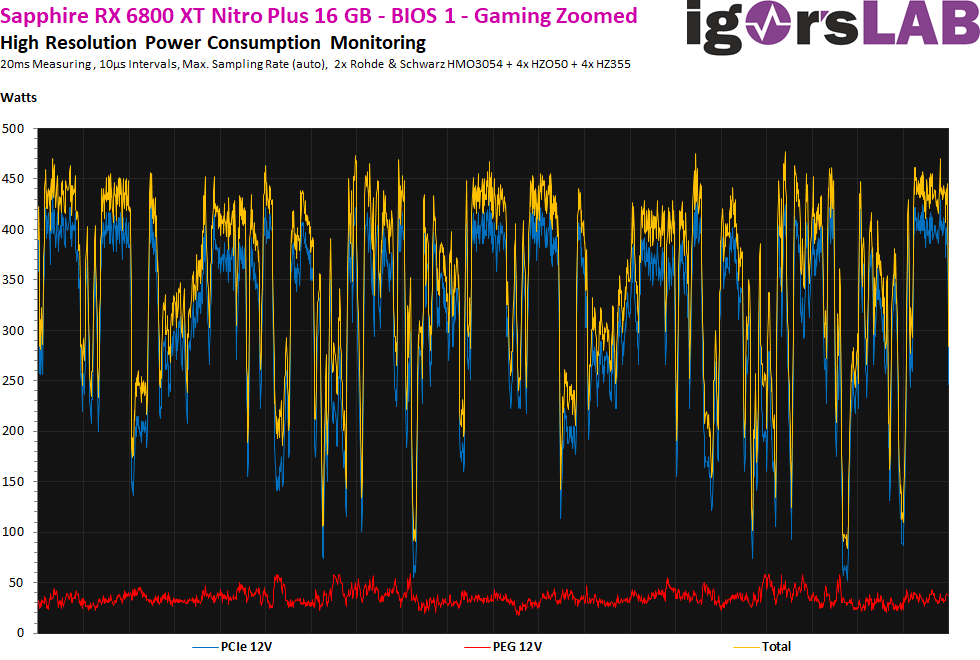
A short excerpt with higher resolution shows us now the 20 ms measurements (10 μS intervals), as I let them run automatically for value determination. Let’s start with gaming again and we see again the rule rage at the BIOS 2:
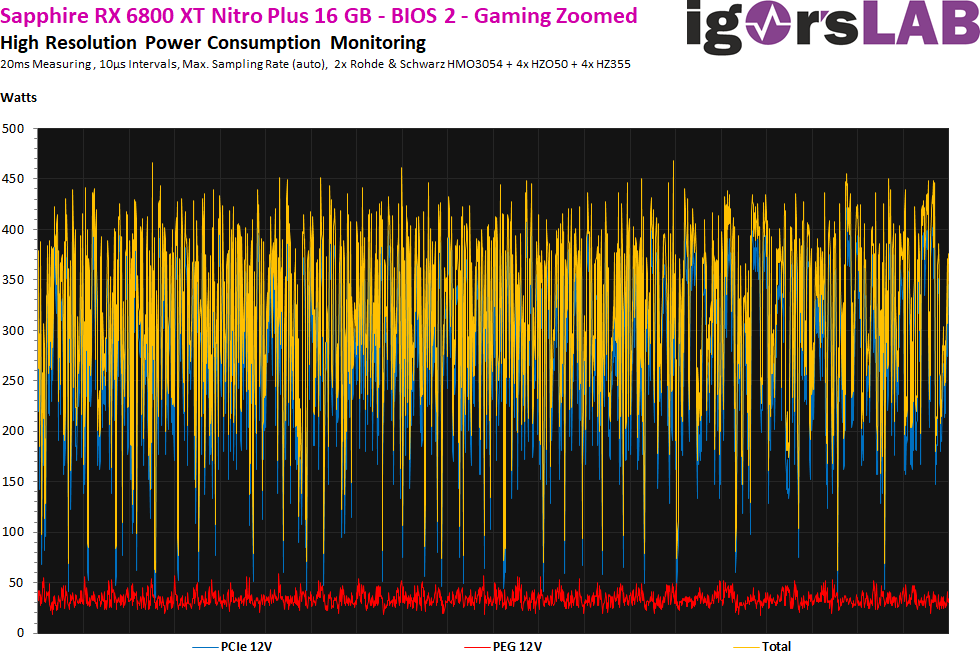
In the stress test, on the other hand, there is no direct difference to be seen in the small intervals:
- 1 - Einführung und technische Details
- 2 - Teardown: Platine, Spannunsversorgung, Kühler
- 3 - Gaming Performance
- 4 - Leistungsaufnahme beim Gaming und Effizienzanalyse
- 5 - Leistungsaufnahme, Spannungen und Normeinhaltung
- 6 - Lastspitzen und Netzteil-Empfehlung
- 7 - Taktraten und Temperaturen
- 8 - Lüfter und Geräuschemission ('Lautsärke')
- 9 - Übersicht, Zusammenfassung und Fazit


Kommentieren