


IMC binning – DDR5 vs. DDR4
As mentioned earlier, for IMC binning, I test the maximum clock rate at which Windows can be booted, at given voltages. If successful, the clock rate is increased by 50 Mbps using BCLK or multiplier. If unsuccessful, the clock rate is reset to the previous value and a second boot test is performed for safety. The voltages for RAM and IMC were set to fixed starting values and, if necessary, increased in 50 mV steps up to a maximum limit in order to also obtain an indicator of scaling. The following voltages in mV were used:
- CPU VDDQ (VDDQ TX / IVR Transmitter VDDQ): 1500 (+100)
- VDD2 (IMC VDD, MC Voltage): 1350 (-50)
- System Agent: 1350 (+-100)
- VDD/VDDQ: 1500
Prophylactically, I would like to note that we have previously assured ourselves from several sources that these possibly highly assuming voltage values do not pose a danger to the CPUs and could even be used in daily operation without any problems. In addition, the CPUs were only operated for a few minutes in total for the whole binning procedure. The primary timings were set to 34-44-44-34 2T to avoid influencing the results as much as possible. Due to DDR5, the Gear 2 mode with a 1:2 ratio between IMC and RAM is used here.
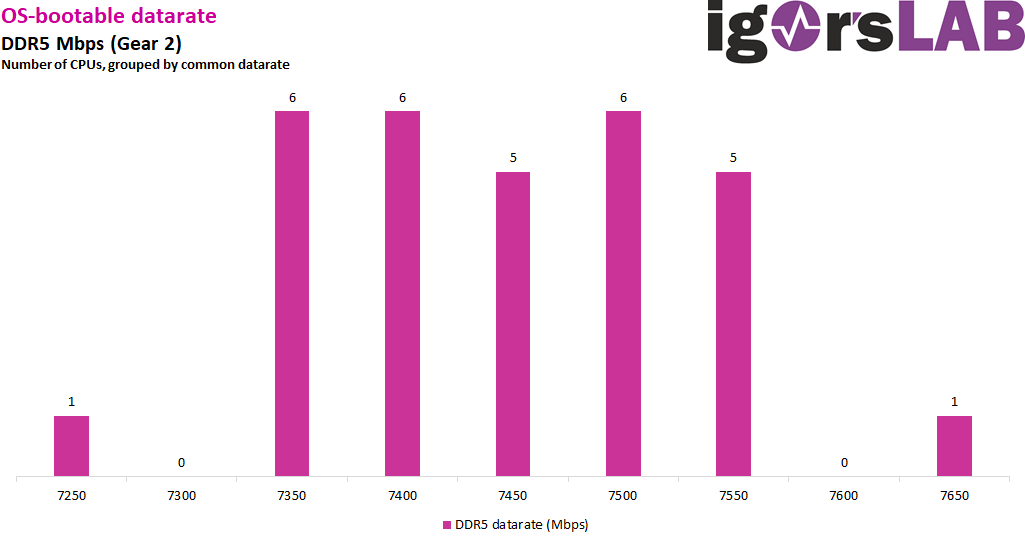
For the DDR5 clock rate, we see a relatively even distribution with clustering in the middle and single outliers at 7650 and 7250 Mbps, respectively, and the average is 7447 Mbps. There are also a few strange phenomena apart from the clock, such as one CPU always crashing with VDD2 at 1350 mV, but the others don’t have any problems with that – 50 mV less is the solution in this individual case. Some CPUs also scale with more CPU VDDQ and can boot a higher clock rate at 1600 mV than at 1500 mV, for example, but other CPUs already reach their maximum DDR5 clock at 1500 mV. The System Agent voltage behaves similarly, but in a smaller window.
The VDD2 voltage and the subdivision of the RAM voltage into VDD and VDDQ are omitted with DDR4. Instead, this is supplied on both sides by the DRAM voltage, which is also set to 1500 mV for the tests. In addition, the Gear 1 mode with 1:1 transmission between IMC and RAM and timings 17-17-17-34 2T is used here. For the most granular sampling possible, the BCLK was again additionally used for testing between two RAM dividers to set the clock rate to a respective median value.

Here, the distribution is a bit more uneven than with DDR5, with a tendency towards the lower end of the tested clock rates. The extremes are 2 CPUs each with 4350 Mbps and 4100 Mbps. The spread is supposedly lower here than with DDR5, but this is of course also due to the missing gearing factor. The average is 4186 Mbps. There wasn’t much more room for maneuvering by raising the voltages here either, whereby the motherboard isn’t preselected in this case either and may be a limiting factor.
Is a good DDR5 IMC always a good DDR4 IMC? Nope, at least not with these 30 CPUs and our test methods.

Here in the diagram, the clock rate is normalized to the actual clock of the IMC (factor 4 for DDR5, factor 2 for DDR4) and then shown with an offset of 1800 or 2000 so that the differences can be read more clearly. Furthermore, the CPUs are sorted here according to the theoretical combined clock rates. In first place is a CPU that manages 1888 MHz with DDR5 and 2175 MHz with DDR4. The taillight is a CPU with 1813 MHz DDR5 and 2067 MHz DDR4. In between is a colorful mix. Some CPUs are better than average in DDR4 and vice versa. The fastest DDR5 CPU is only in the upper midfield with DDR4 and even the fastest DDR4 CPUs are just above or below the DDR5 average.


21 Antworten
Kommentar
Lade neue Kommentare
Veteran
Urgestein
Veteran
Mitglied
1
Mitglied
1
Urgestein
Mitglied
Neuling
Mitglied
Urgestein
Urgestein
Mitglied
Urgestein
Veteran
Urgestein
Veteran
Veteran
Alle Kommentare lesen unter igor´sLAB Community →