


SP values for P and E cores
So, now I’ve beaten around the bush enough! What can our CPUs do now?
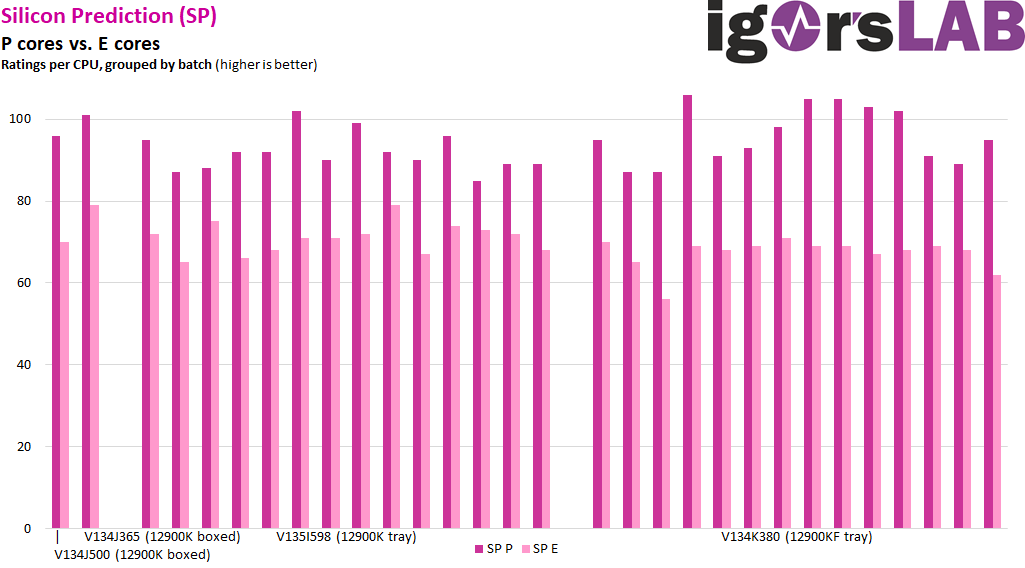
Here you can see all tested CPUs, grouped into my two boxed CPUs on the far left and the two trays of 14 CPUs, each with the SP value for P-cores and E-cores. And what stands out? Actually, nothing really. When averaging, the KF CPUs have slightly better P-cores and slightly worse E-cores, but this could just as easily be just an artifact of our limited test set of 30 CPUs. Of course, you would have to test far more CPUs to be able to draw truly representative conclusions.
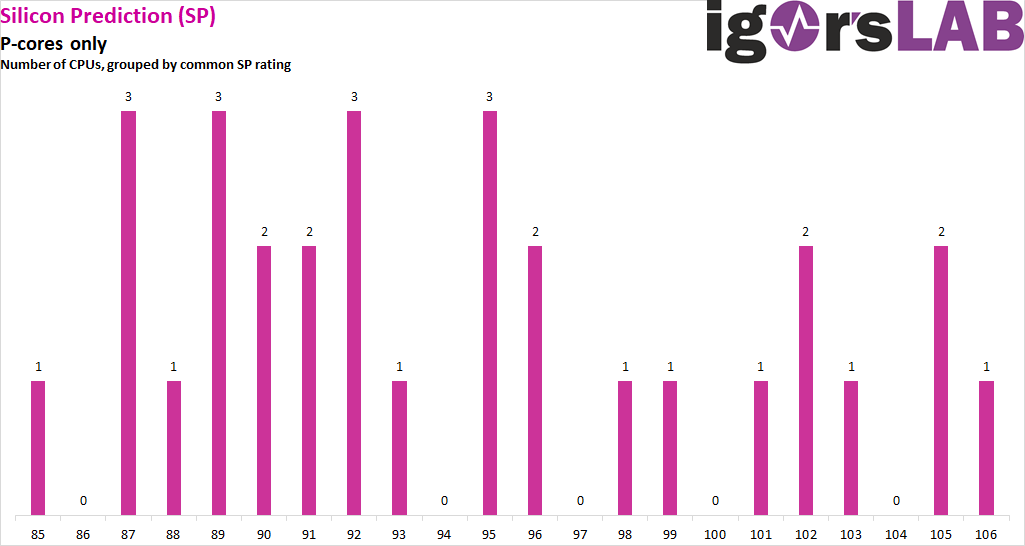
If we now only look at the P-core SP value and the distribution over the number of CPUs, no classic bell curve can be seen, as one would perhaps expect, but of course the total sample number plays a significant role here again. The highest SP value for the P-cores is 106, the lowest 85, both found in only one CPU. The average is 94.3.
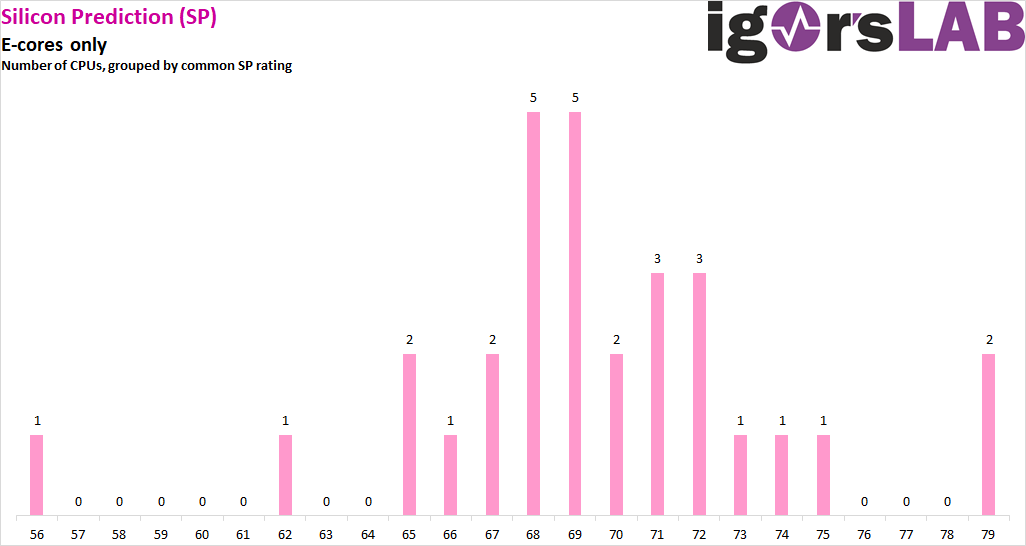
The E-cores have more of a bell shape, whereby the spread between the two best CPUs with SP 79 and the worst with SP 56 is also somewhat wider, with large gaps in between. The average here is 69.4.
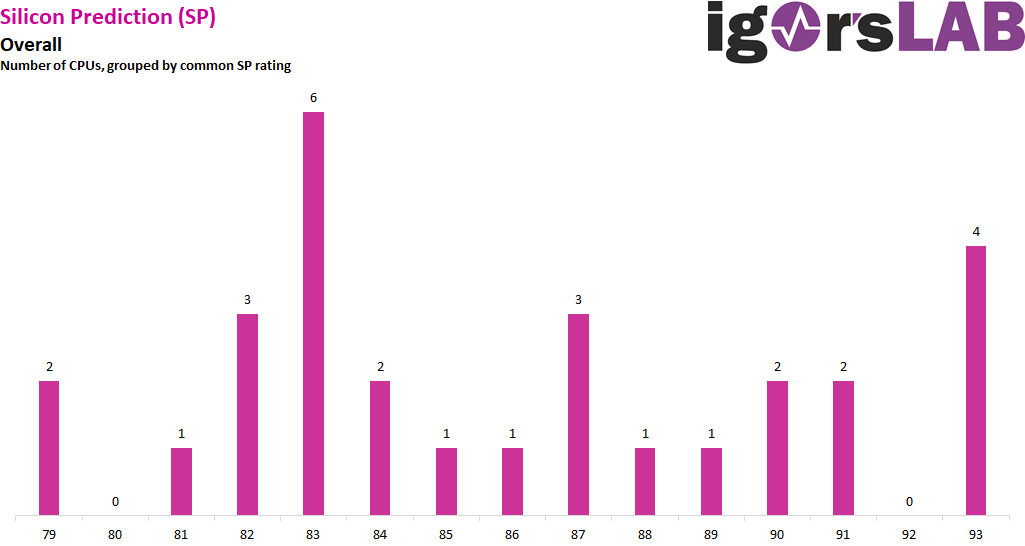
If we now look at the SP value for the entire CPU, where P and E cores are added in a factor of 2:1 as already mentioned, the picture is again quite mixed. The best SP value of 93 is also the second most common CPU. Two CPUs have the lowest SP value with 79. The average is 85.7, just above the most commonly found value of 83 out of 6 CPUs. for comparison, the average SP value of the i9 CPUs tested by quiekMew and colleagues is 85.2 – so we are pretty close here.


21 Antworten
Kommentar
Lade neue Kommentare
Veteran
Urgestein
Veteran
Mitglied
1
Mitglied
1
Urgestein
Mitglied
Neuling
Mitglied
Urgestein
Urgestein
Mitglied
Urgestein
Veteran
Urgestein
Veteran
Veteran
Alle Kommentare lesen unter igor´sLAB Community →