


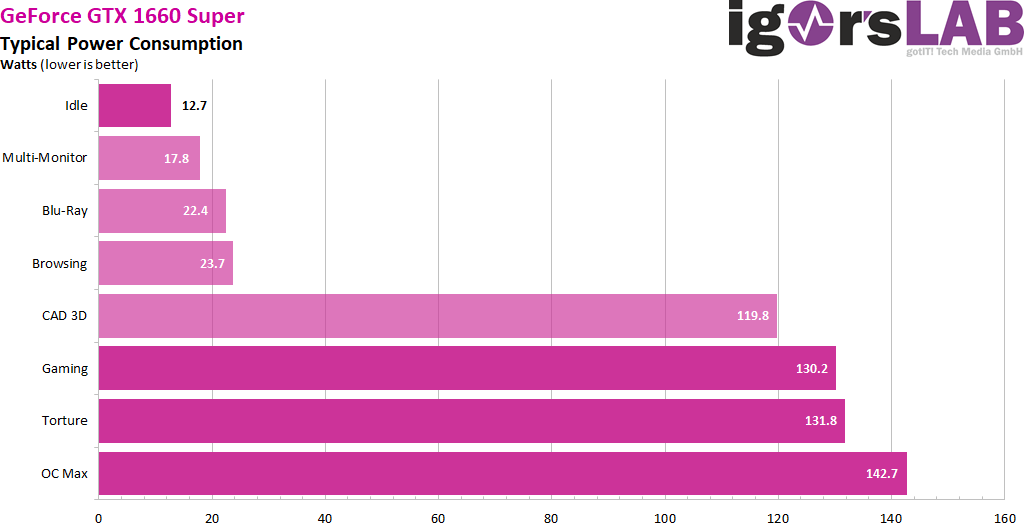
Power consumption and loads
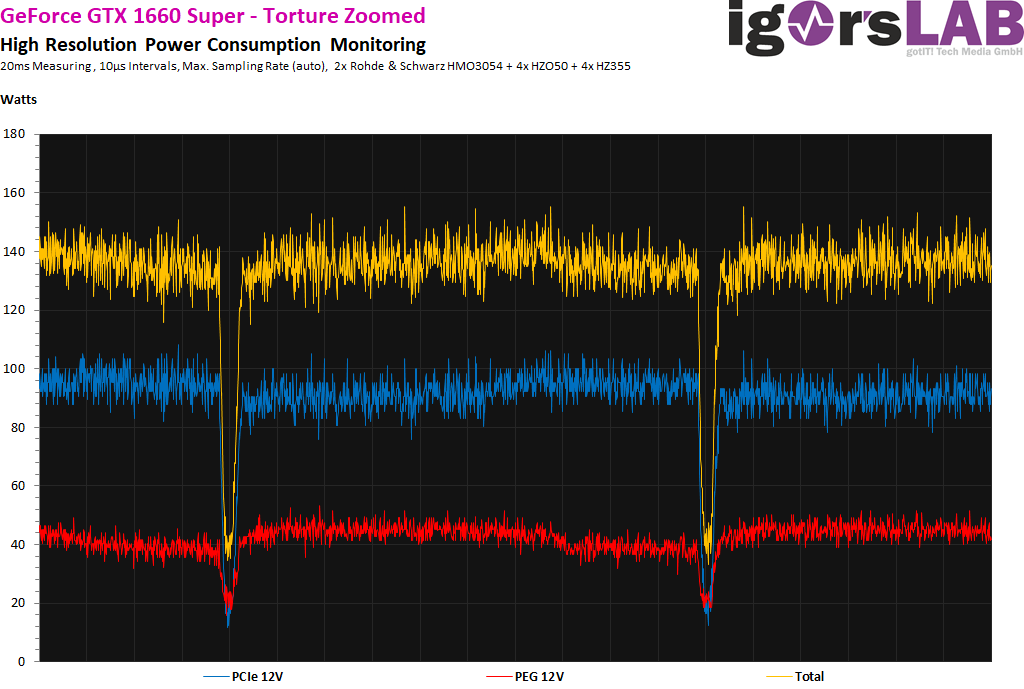
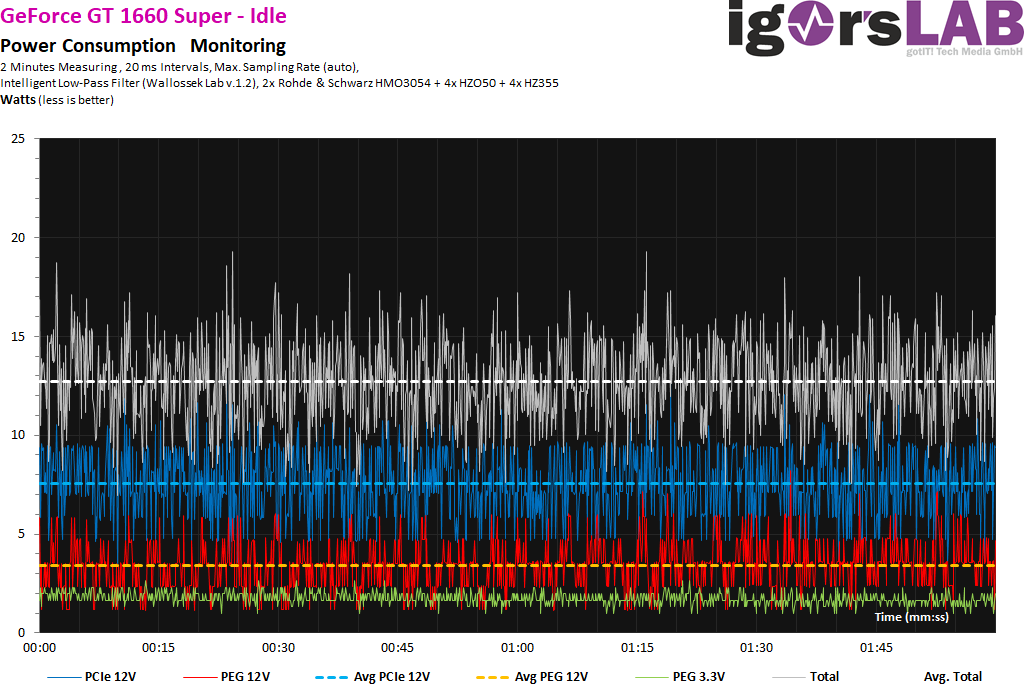
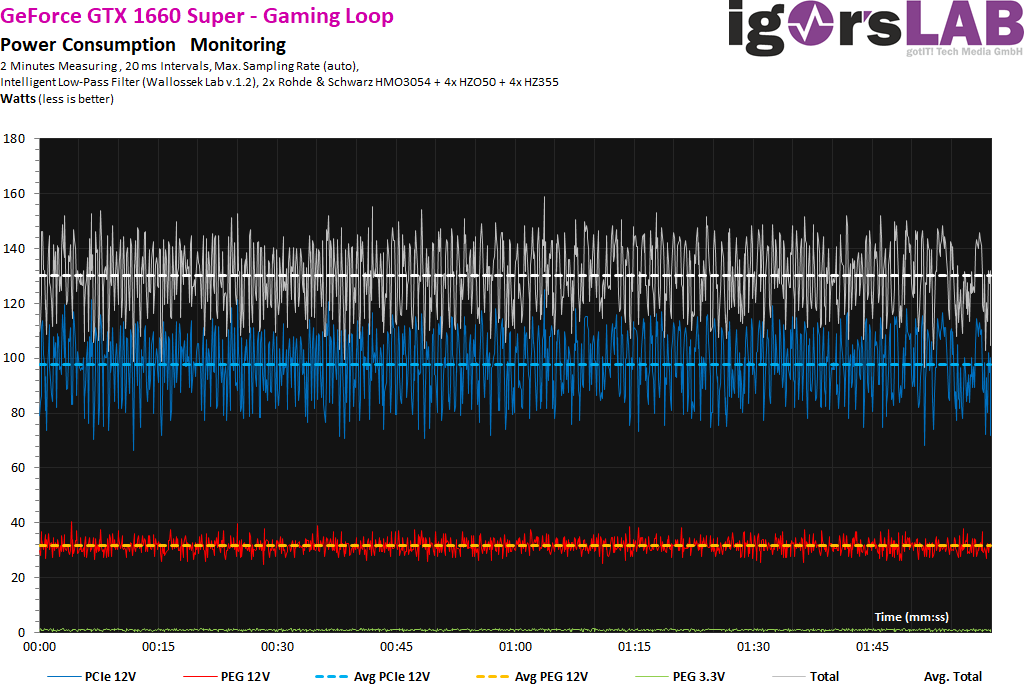
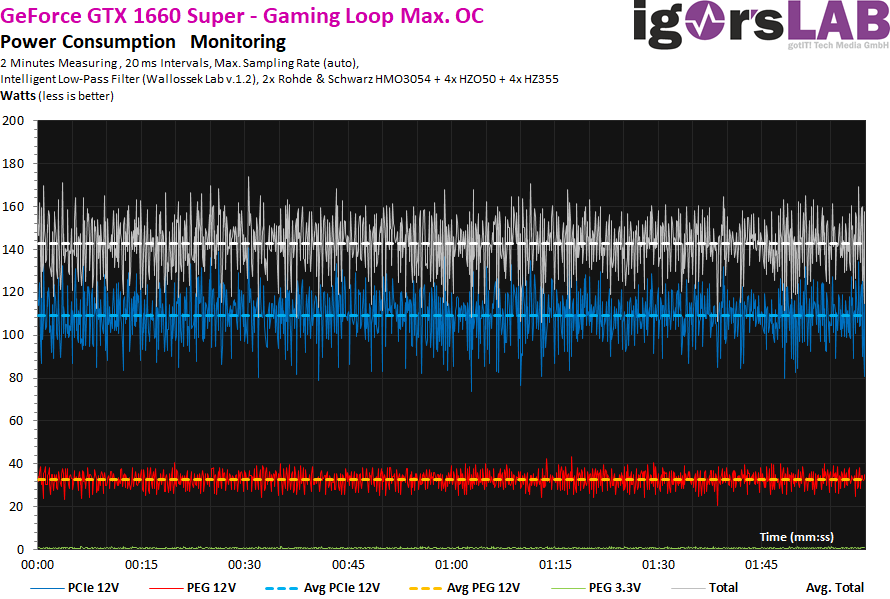
The power consumption of all three cards is 12 to 13 watts in the idle exactly where you could expect them. There is no lighting to be fed. With an average of 130 watts in the gaming loop over 5 minutes and 132 watts in the stress test, all cards are slightly above the wattage of 125 watts stored in the BIOS. This also applies to the maximum power limit, which is also significantly exceeded with 143 watts at the maximum OC and 108% power target.
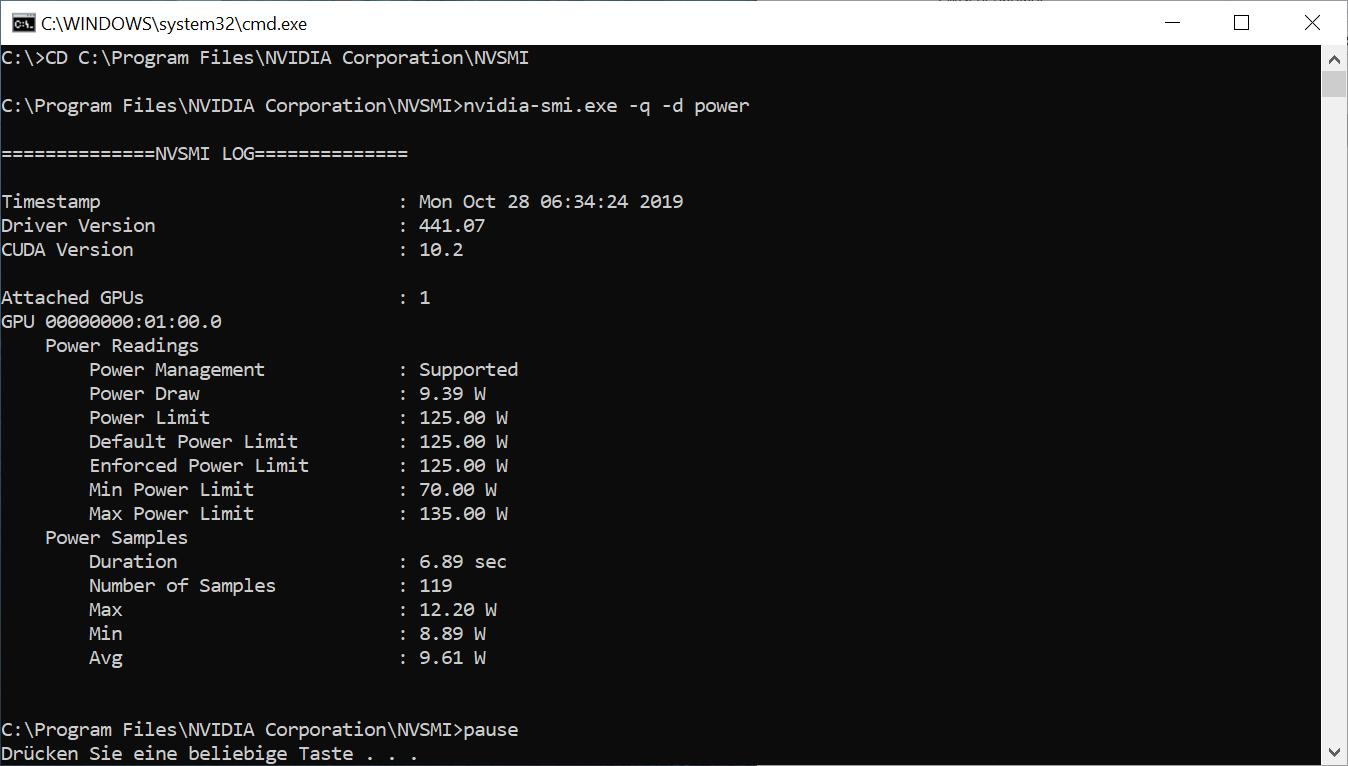
What Nvidia gives all cards via BIOS looks like this:
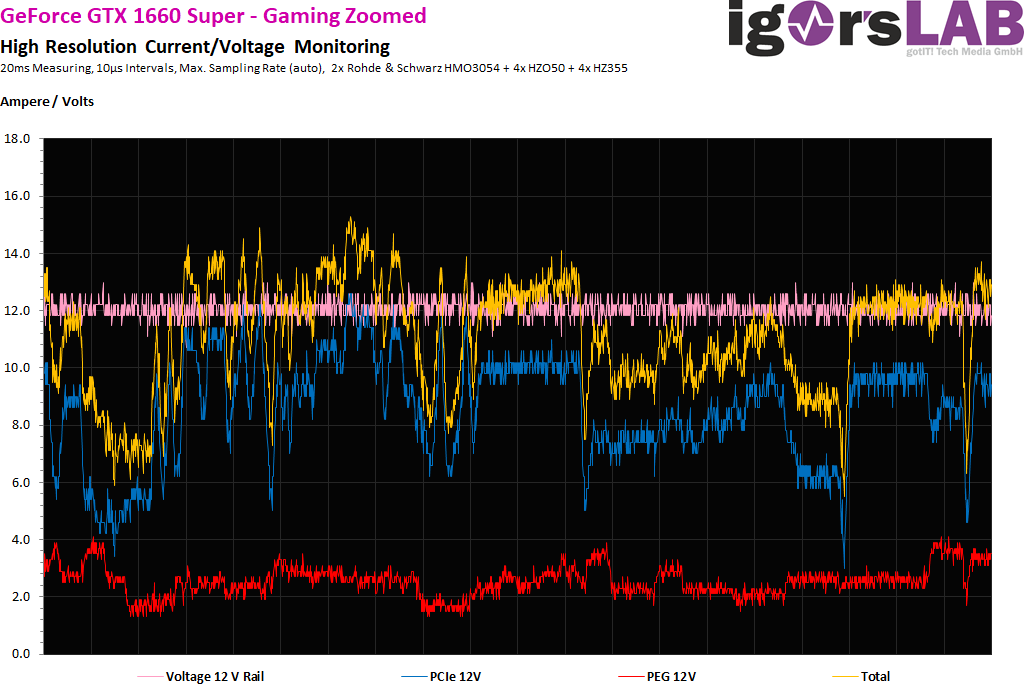
The rather high voltage proves once again that these cards are supplied with significantly more power in relation to the Shaders than the Ti versions. The corresponding temperature-dependent voltages can be seen in the following diagram: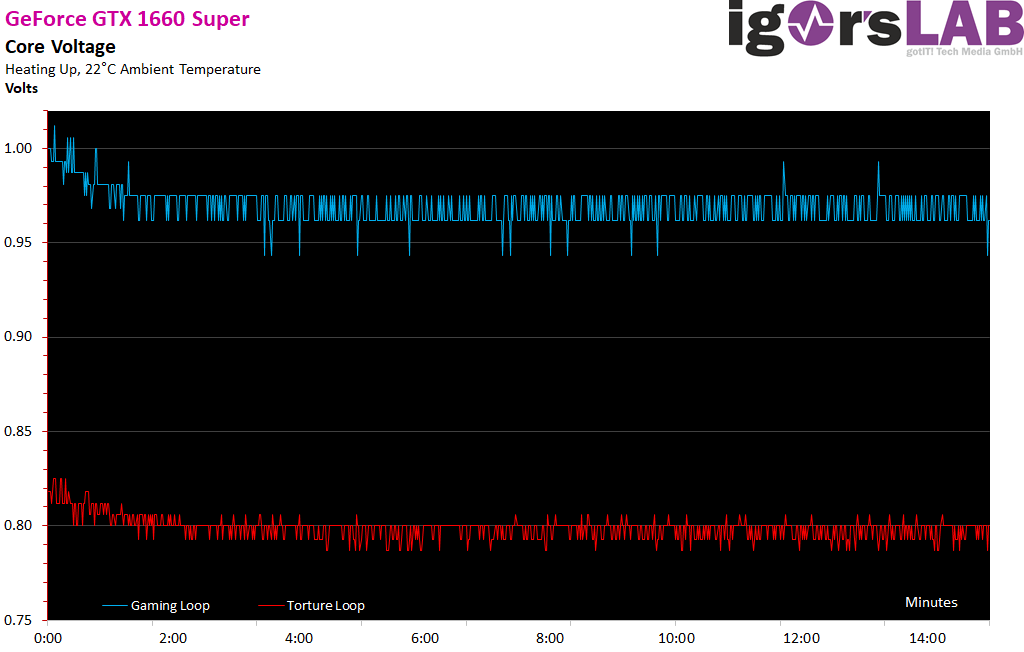
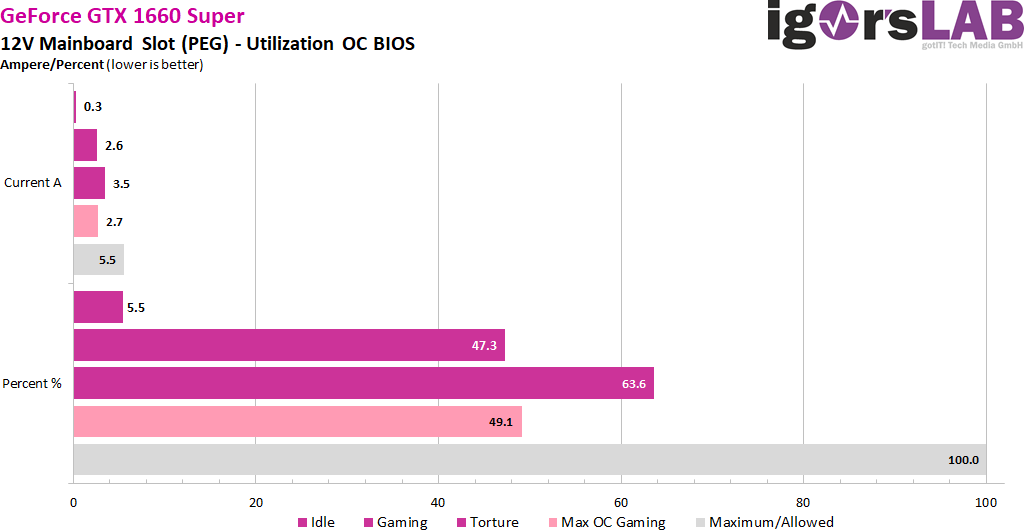
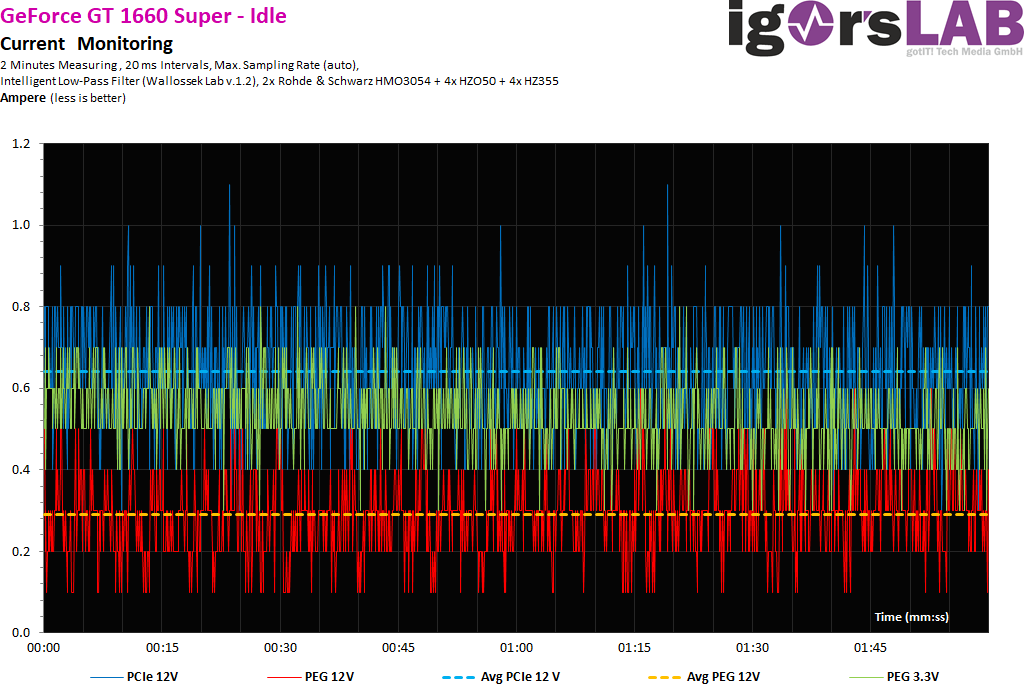
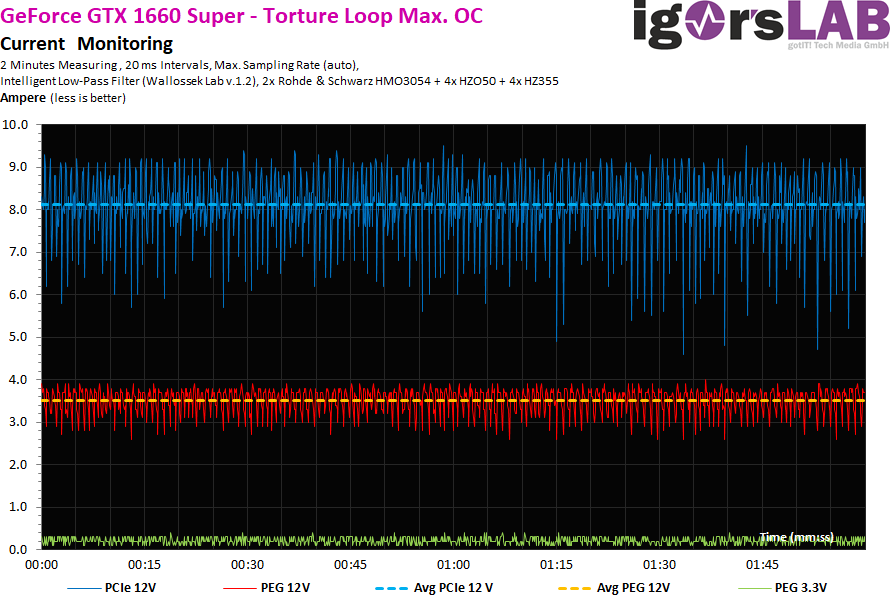
The load distribution on the rails is interesting, because the maximum 5.5 amperes of the motherboard slot are never exceeded. Balancing has been solved in an exemplary manner.
Power supply design and peak loads/currents
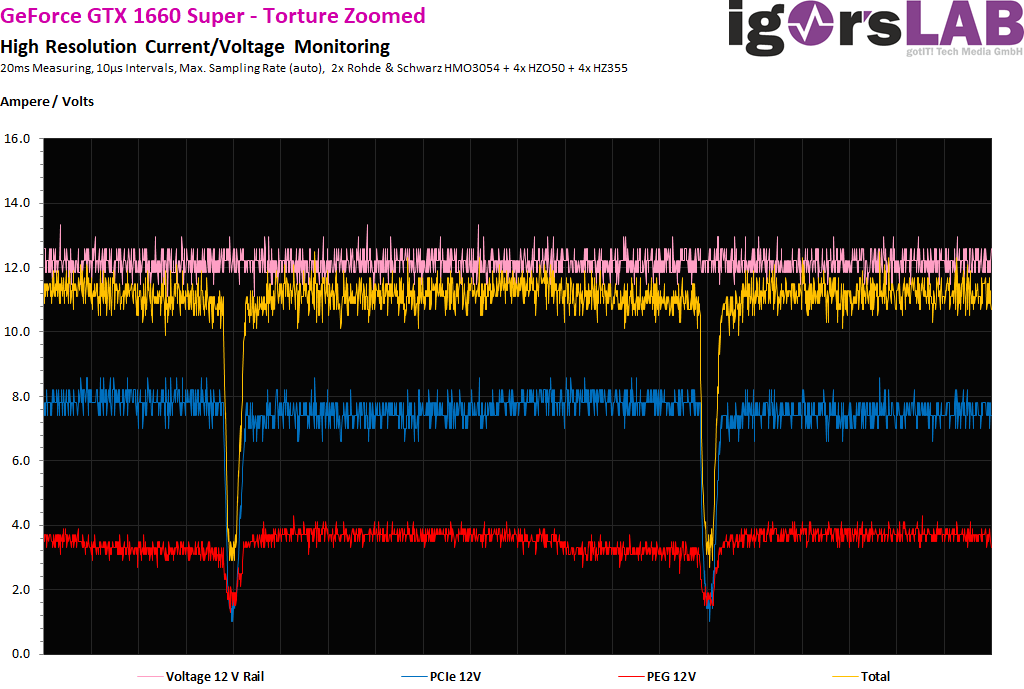
As I have already demonstrated in detail in my basic article "The fight of graphics card against power supply – power consumption and load peaks demystified", there are also temporarily higher loads in the millisecond range, which are unfavorable in case of unfavorable designed or improperly equipped power supplies can already lead to unexplained shutdowns. The TBP (Typical Board Power) measured by the graphics card manufacturer or the reviewers does not really help for a stable design of the system.
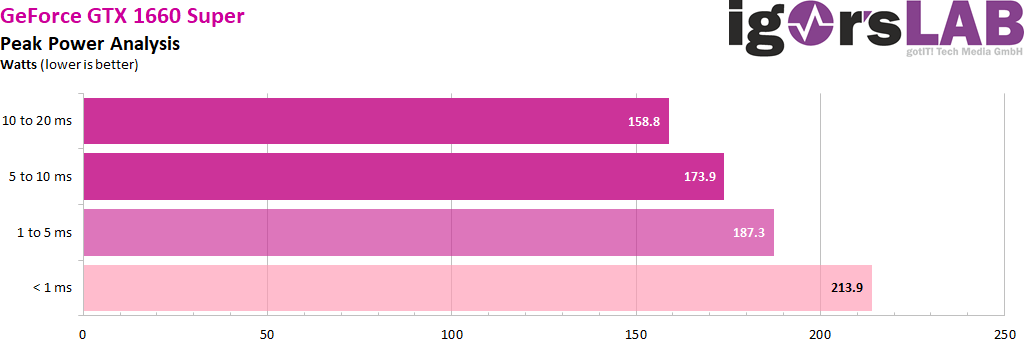
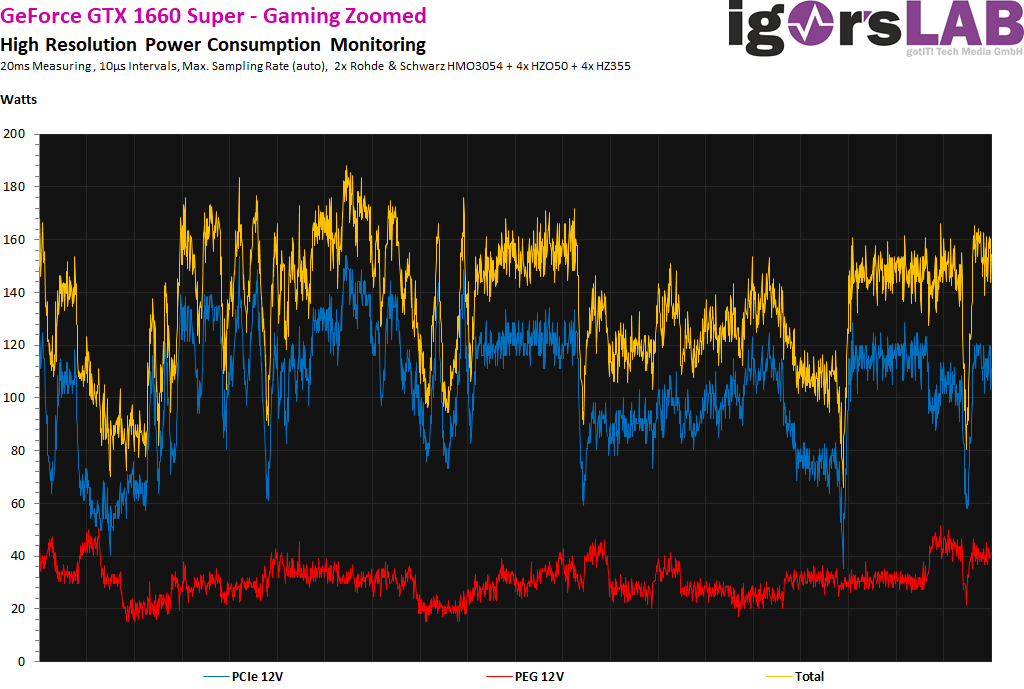
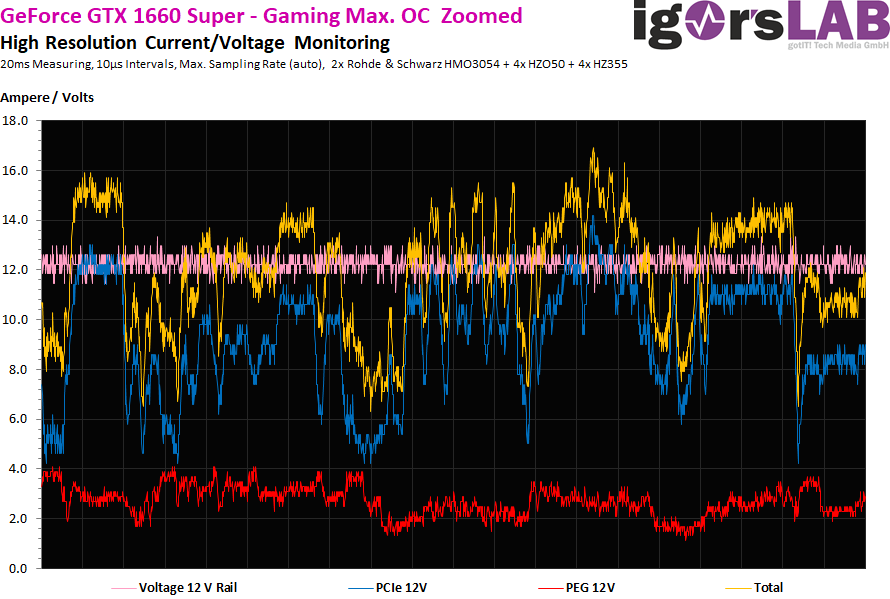
Peaks with intervals between 1 and 10 ms can lead to shutdowns with very fast-reacting protective circuits (OPP, OCP), especially for multi-rail power supplies, although the average power consumption is still in the norm. For all very similar cards I would therefore calculate with the normal OC with 170 to 180 watts, in order to have enough reserves in case of cases. A short excerpt with high resolution now shows us the 20 ms measurements (10 S intervals), how I run them automatically for valuation:

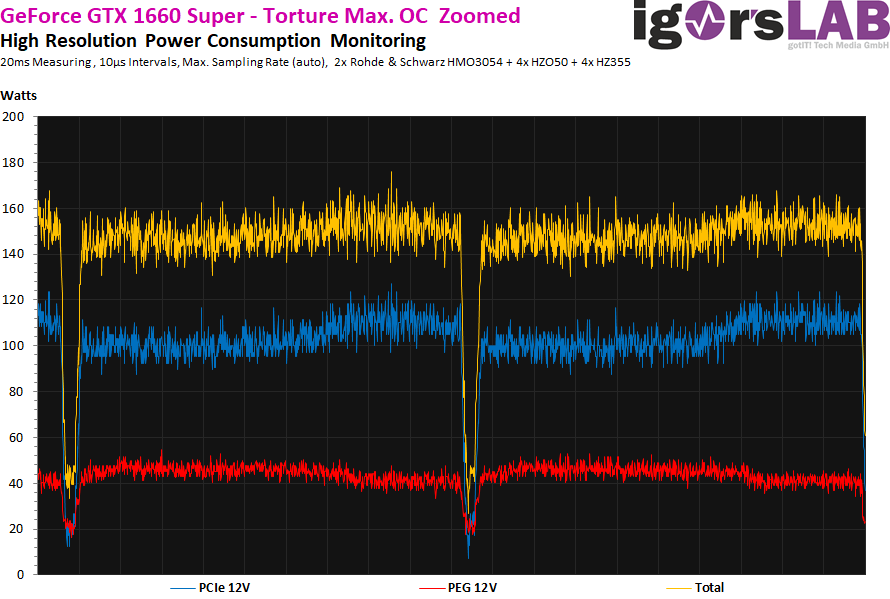
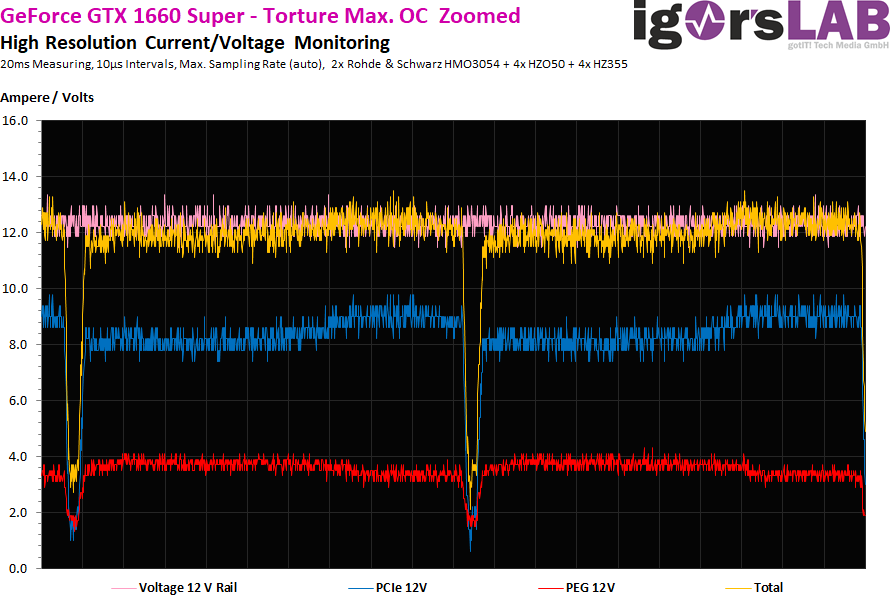
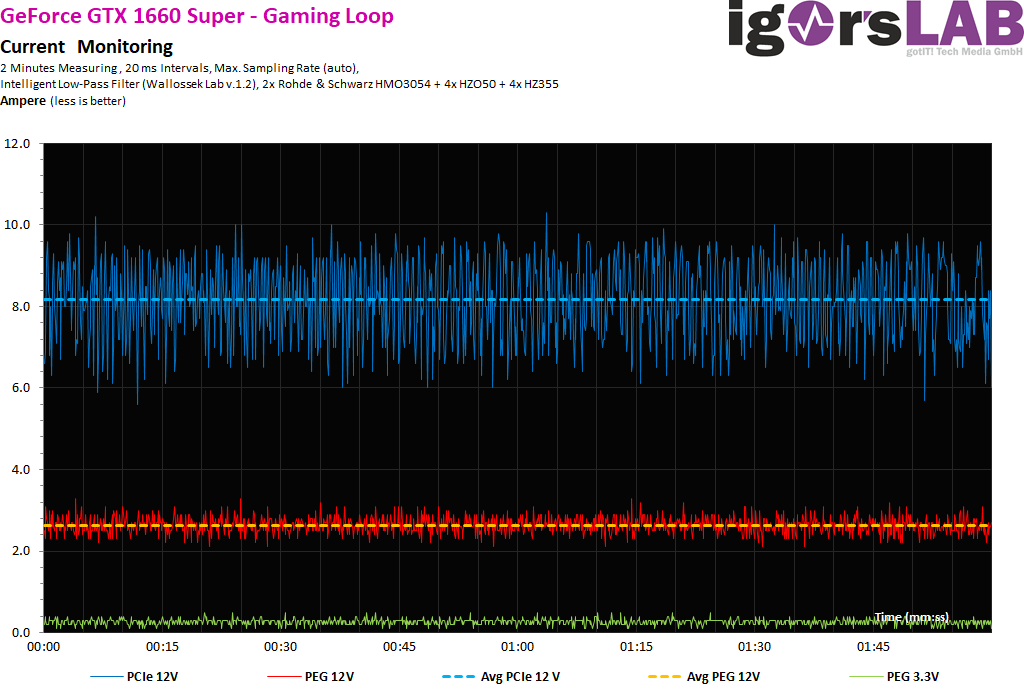
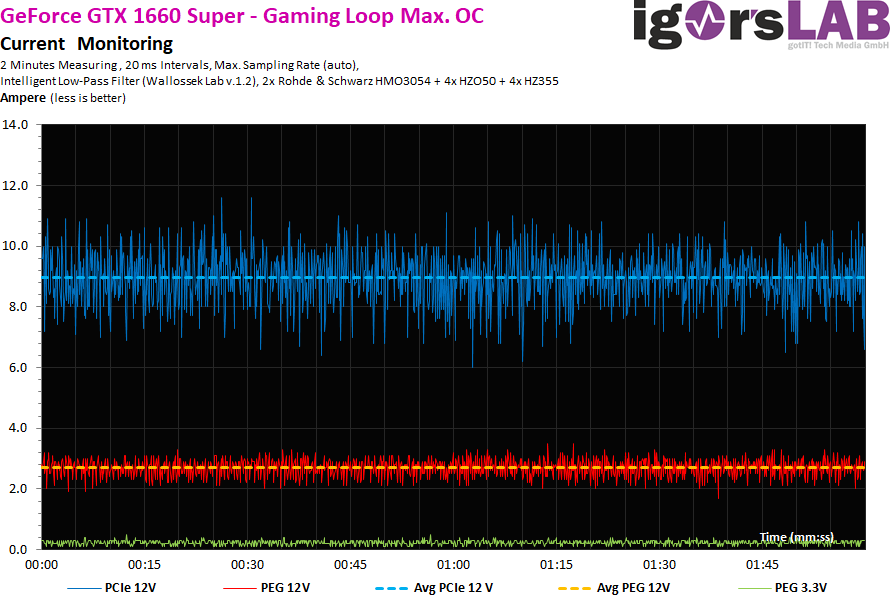
Detailed recording of average power consumption and flowing currents
As usual, I now also set aside the power consumption and the flowing currents as detailed graphics of my oscillograph measurements. A service that hardly anyone else offers and which shows how the maps "tick" in detail:


- 1 - Einführung
- 2 - Tear Down: Platine und Kühler
- 3 - Shadow of The Tomb Raider
- 4 - Grand Theft Auto V
- 5 - F1 2019
- 6 - Total War: Three Kingdoms
- 7 - Far Cry 5
- 8 - The Division 2
- 9 - Metro Exodus
- 10 - Leistungsaufnahme im Detail
- 11 - Temperaturen und Infrarot
- 12 - Lüfter und Geräuschentwicklung
- 13 - Zusammenfassung und Fazit


Kommentieren