


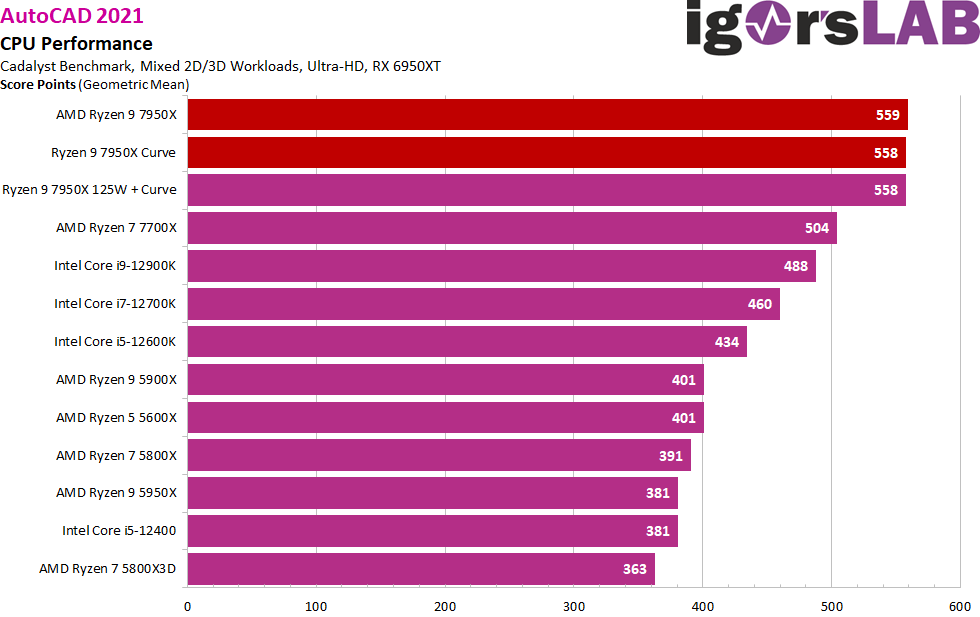
AutoCAD 2021 with the Cadalyst Benchmark Suite
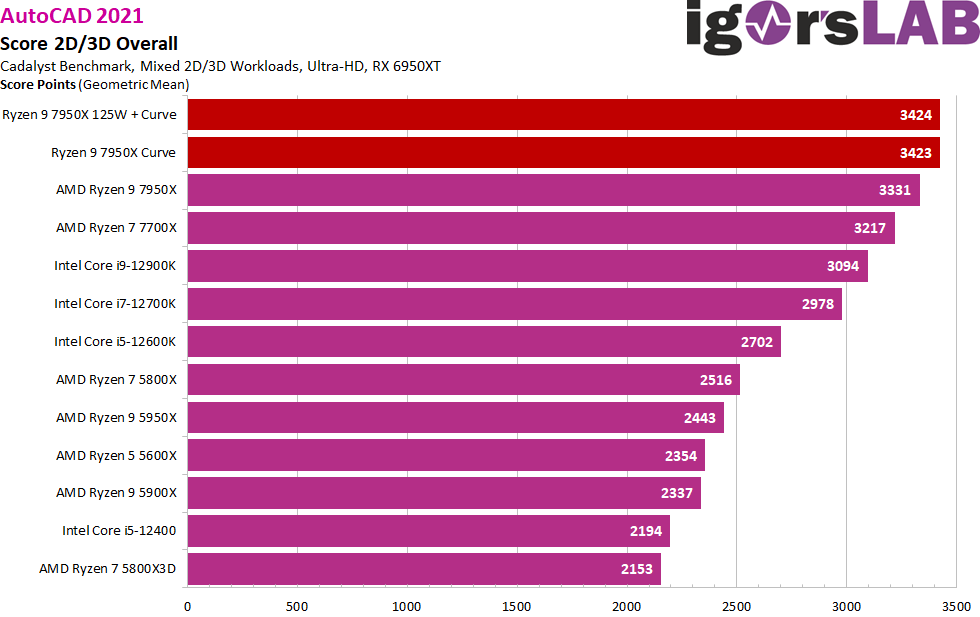
Well, AutoCAD has never really been AMD’s domain, but Ryzen 5000 was able to catch up with Comet Lake S for the first time and even take a slight lead. It was even still good enough for Rocket Lake. And then Alder Lake came along and could really annoy AMD’s Ryzens. Now, unfortunately, AutoCAD is extremely CPU-heavy and there is also quite little to parallelize in the normal workspace. It is often what a few cores are capable of that counts. Well, and then came Ryzen 7000. In 2D and 3D, the Radeon RX 6950XT is still almost limited by the CPU even in Ultra-HD, although it looks a bit better with the newer CPUs from AMD and Intel.
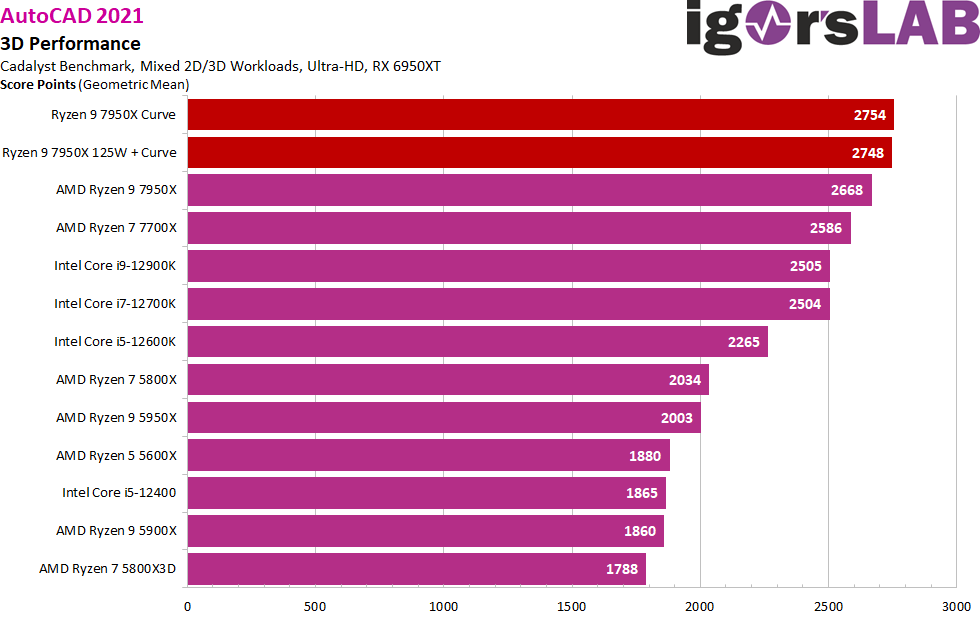
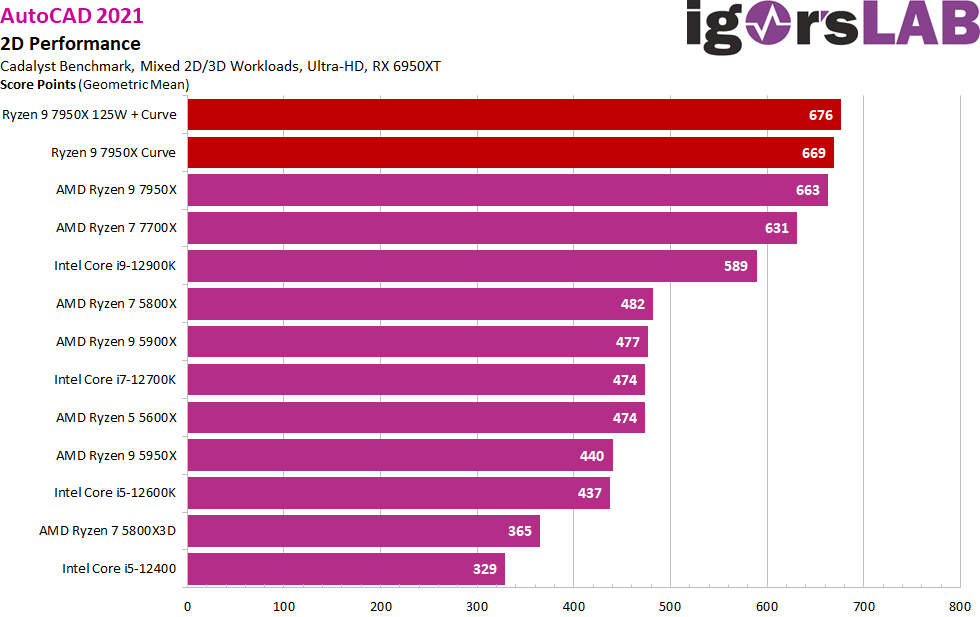
First of all, I will summarize 2D and 3D graphics rendering, since these two partial results are, in my opinion, clearer and more consistent than the Cadalyst’s total score, which also includes data accesses, but which can fluctuate depending on the background noise of the rest of the system. Three benchmarks, but 5 results, if you exaggerate. So that’s my new score, although of course I’ll still list the individual results below as usual.
Partial benchmarks of the Cadalyst
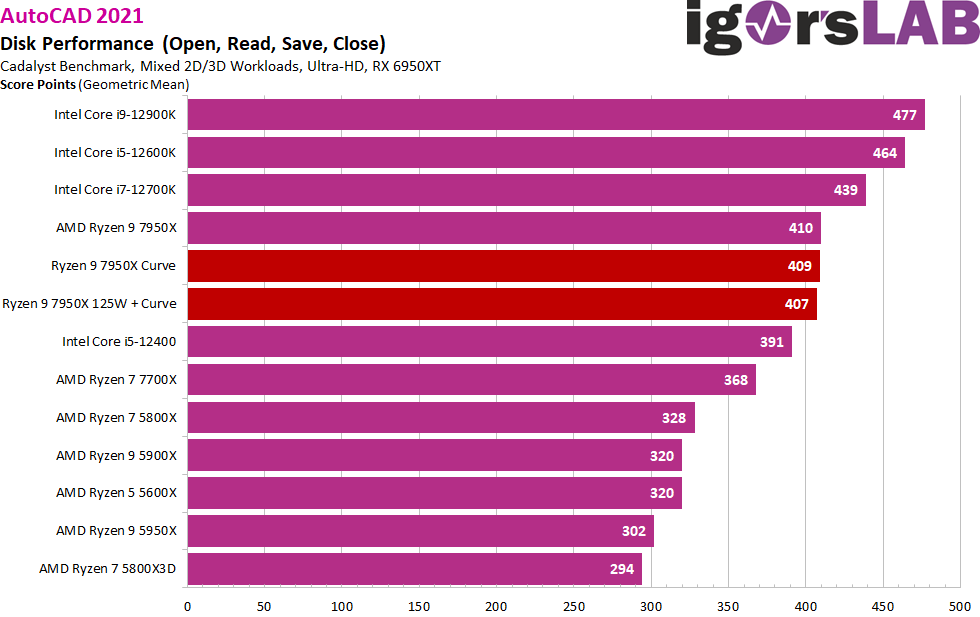
Let’s now take a look at the individual results, where it becomes apparent where AMD’s new Ryzen is a bit weaker. The bottom line is that all benchmarks except for the disk test clearly go to AMD, so you have to be fair in the end. The only thing is that this area is hardly relevant for everyday work with CPUs so close together.
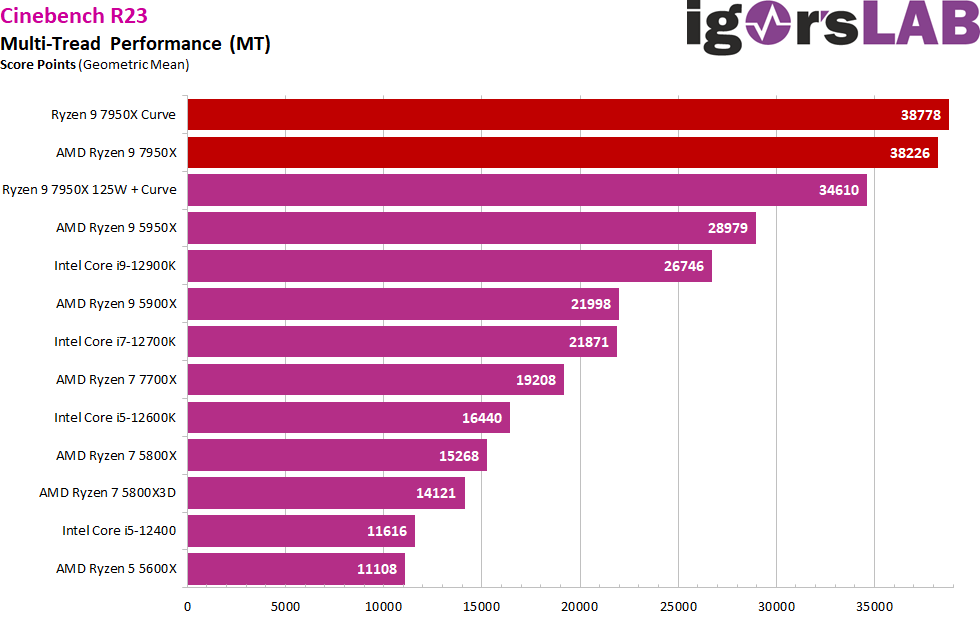
Rendering: Cinebench and Blender with the igoBOT
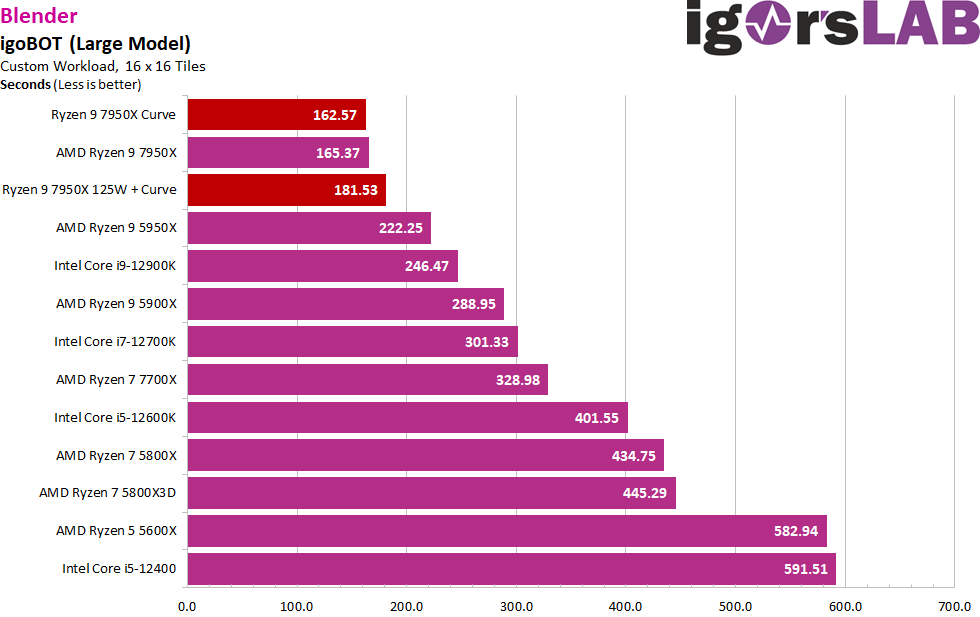
Even though I don’t really like it because the Cinebench R23 delivers rather inconsistent results, you can of course still make a correct statement in total. The performance of the Ryzen 9 7950X is beyond discussion and speaks for itself. However, we also see here that the version with the 125-watt brake falls behind more clearly, but it also acts cooler and more frugal. We’ll see how much of a difference such a thing can make later on in Blender and on the next page in power consumption and efficiency.
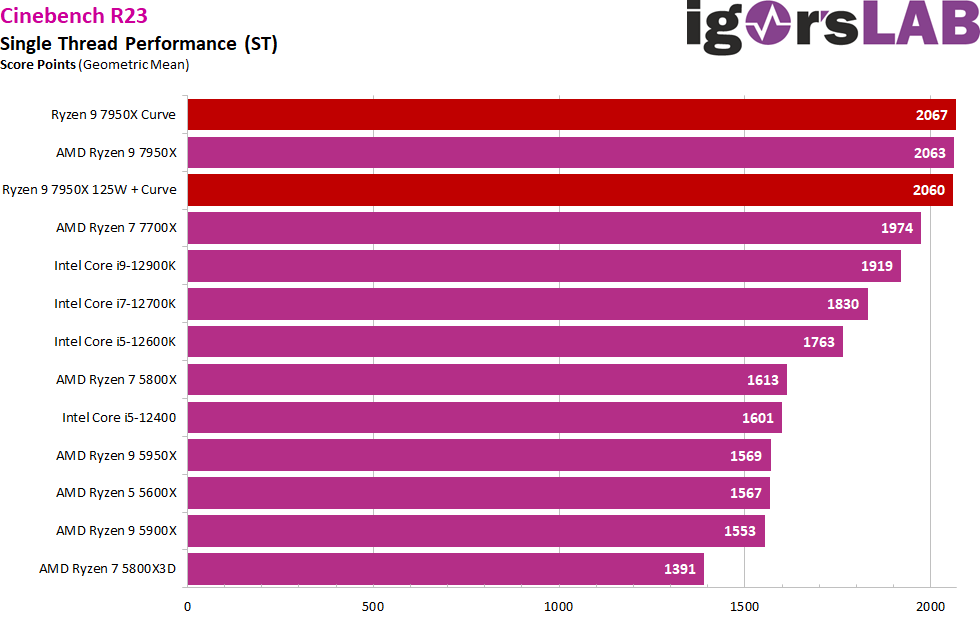
The single-thread performance logically shows the expected picture, even if the Curve version’s lead is extremely tiny. However, we can assume that we are already within the benchmark’s tolerance range and that all three options are somewhat equally fast.
 Of course, it’s the same as always: a good renderer needs invigorating core fodder, that’s always been the case. My beloved igoBOT is a grateful task there, even if rendering on the CPU is slowly going out of fashion. But before I take things like Cinebench as the sole benchmark, I’d rather run something like that, which also sometimes causes a few minutes of work and delivers very consistent results. And it can also heat. Unless you throttle your colleague in a bit more.

- 1 - Einführung, Advanced PBO und Curve-Options
- 2 - Gaming: FPS Bars
- 3 - Gaming: FPS Curves
- 4 - Gaming: Percentile Curves
- 5 - Gaming: Frame Time Bars
- 6 - Gaming: Leistungsaufnahme CPU
- 7 - Gaming: Leistungsaufnahme CPU & GPU
- 8 - Gaming: Effizienz in Einzelspielen
- 9 - Gaming: Zusammenfassung Performance, Verbrauch, Effizienz
- 10 - Workstation: CAD und Rendering
- 11 - Workstation: Leistungsaufnahme, Temperaturen und Fazit


101 Antworten
Kommentar
Lade neue Kommentare
Urgestein
1
Moderator
Urgestein
Urgestein
Mitglied
Mitglied
Urgestein
Veteran
Urgestein
Veteran
Veteran
1
Urgestein
1
Urgestein
Urgestein
Alle Kommentare lesen unter igor´sLAB Community →