


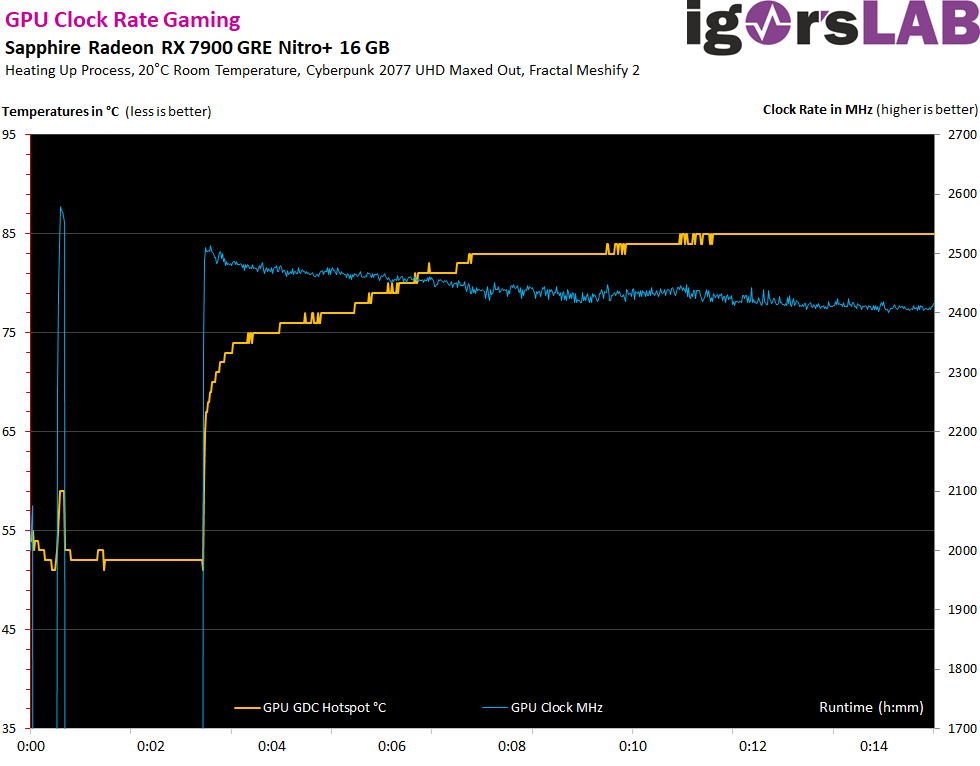
Real achievable clock rates and overclocking
The clock rates and readout are very fancy and time-consuming, which is why I automated it again this time. I logged all games (WQHD only) and calculated an average for everything, which I first recorded in a table and compared with the Radeon RX 7800XT MBA:
| Card | Average in MHz | Maximum boost in MHz |
| Sapphire RX 7900 GRE Nitro 16 GB |
2409 | 2510 |
| AMD Radeon RX 7800XT MBA 16 GB | 2462 | 2546 |
The clock rates of the GRE card are a real disappointment. The OC card is a good two percent behind the RX 7800XT MBA and over four percent behind an RX 7800XT with factory OC. Together with the reduced memory bandwidth, this also explains the low performance advantages. After all, the GRE has 33% more shaders and is also significantly broader in other respects, but simply doesn’t get the performance on the road. I can’t understand what move AMD actually wanted to make here.
GPU temperatures in the housing
The differences are not as great as feared if you use a proper case. In the end, the card does not dissipate much less heat than the XT. If you close the panel, the GPU temperature (edge) rises by 2 to 3 Kelvin, the GDC hotspot rises by up to 4 Kelvin. This is all in the deep green range and looks better than AMD’s reference, the XT, even without the vapor chamber.
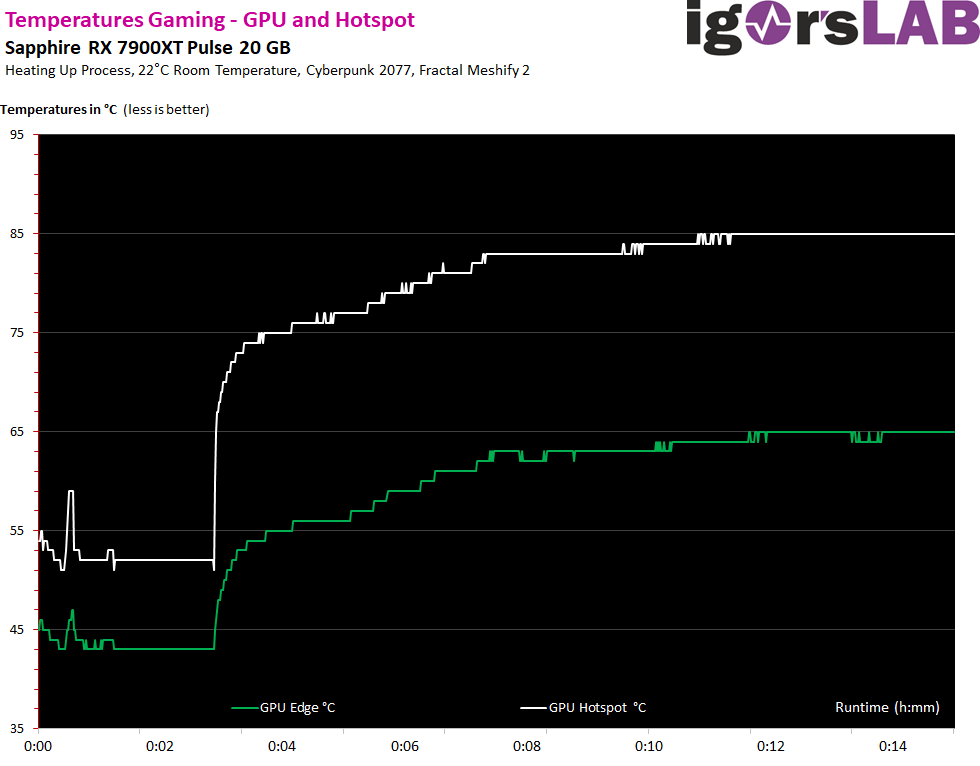
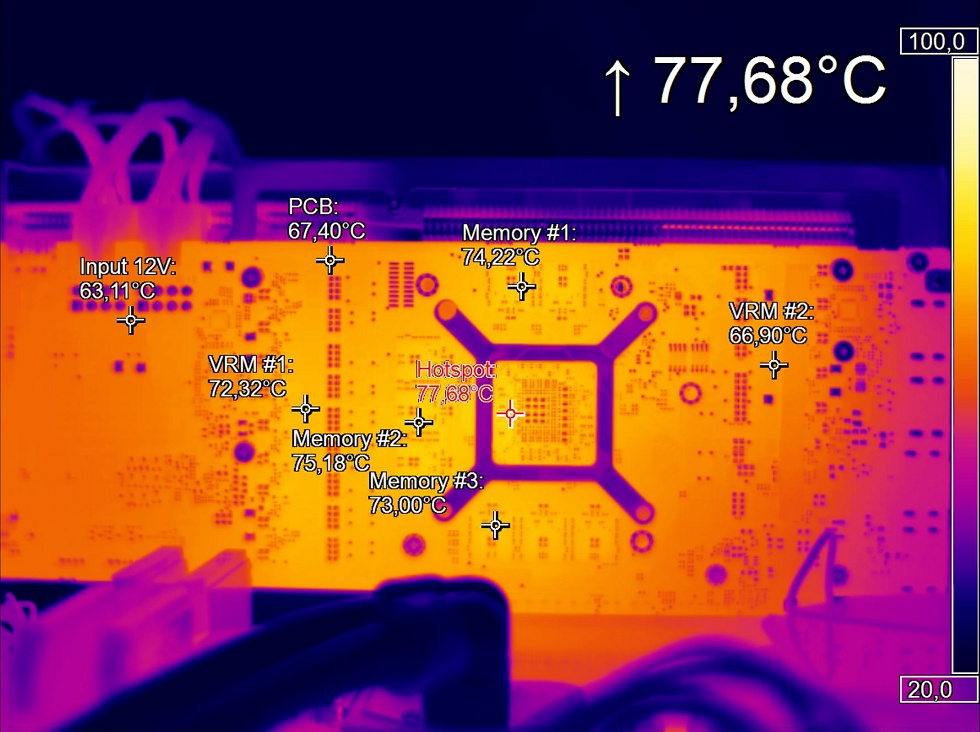
Infrared measurements (heat flow analysis)
Let’s start with the gaming loop and we can see that it is warmer underneath the socket than in the GPU, which is not surprising. Sapphire has designed the fan control to be very reactive, which is acceptable.
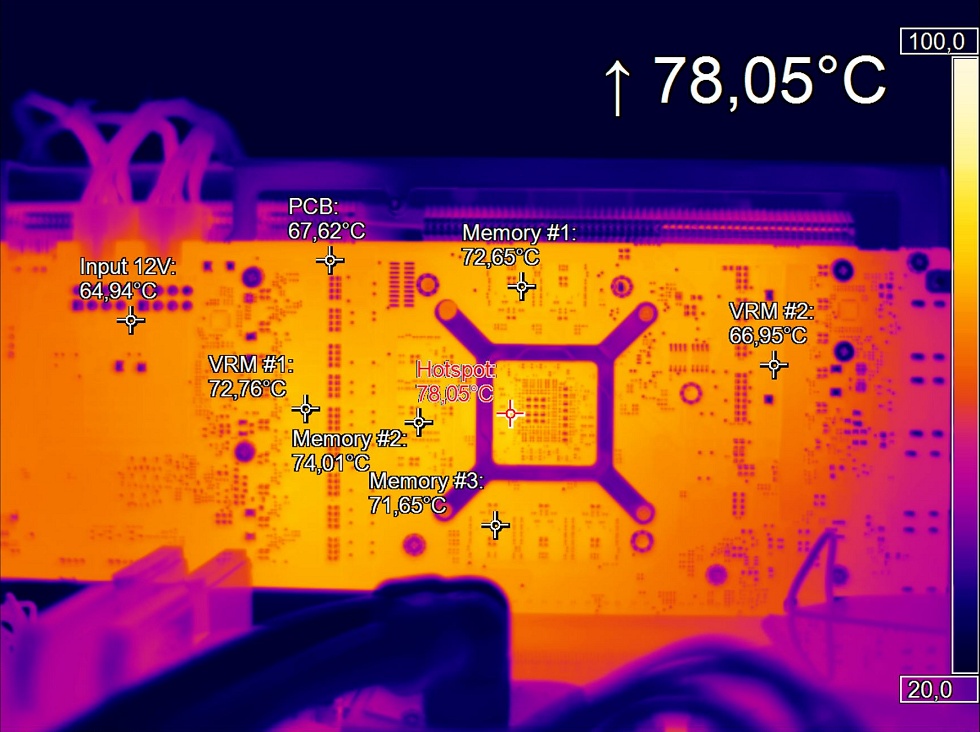
In the stress test, the temperatures only rise a little in the memory, but the same applies here. The balancing act between cooling performance and fan noise is really successful!
- 1 - Introduction, technical data and technology
- 2 - Test s4etup and methods
- 3 - Teardown: PCB and components
- 4 - Teardown: cooler and cleaning tips
- 5 - Teardown: material analysis
- 6 - Gaming-Performance Full-HD (1920 x 1080)
- 7 - Gaming-Performance WQHD (2560 x 1440)
- 8 - Gaming-Performance Ultra-HD (3840 x 2160)
- 9 - Gaming-Performance DLSS / FSR (3840 x 2160)
- 10 - Gaming-Performance FSR3 Frame Generation (3840 x 2160)
- 11 - Latenzen
- 12 - Power consumption and balancing
- 13 - Transients and PSU recommendation
- 14 - Temperatures, IR analysis and clock rate / OC
- 15 - Fan curves, noise and audio sample
- 16 - Summary and conclusion


297 Antworten
Kommentar
Lade neue Kommentare
Urgestein
1
1
Urgestein
Urgestein
Urgestein
Mitglied
Urgestein
1
Urgestein
Veteran
Mitglied
Urgestein
1
Urgestein
Urgestein
Veteran
Urgestein
Mitglied
Alle Kommentare lesen unter igor´sLAB Community →