


Even though another patch for the Windows 11 patch has been announced for 10/21/2021, I have already tested the patch for the L3 bug. Background was actually the compilation of the test suite for the launch of Intel’s Alder Lake on 04.11.2021, where I am still faced with the choice of which CPU I will test with which operating system as fairly as possible and what differences between the individual operating system versions could be expected in the end.
I don’t have the time for multiple operating systems, nor do I intend to give an advantage to any of the CPU manufacturers, so the weighing of platforms really becomes a matter of conscience this time. Since the patch for the L3 bug was already available in the Insider Program, I used the most current version of Windows 10 as of yesterday against the most current, normally available version of Windows 11 as well as its patched version from the Insider Program for today’s benchmarks, which represents part of my test suite for the ADL launch.
Since I’m sure that God and the world (which includes all YouTubers and Twitchers) are focusing on gaming, I thought about what else I could test that would provide interesting content and thus added value for many end users. There’s no need to bring the 1001st benchmark there, that’s certainly well covered elsewhere. Of course, there will be the games, even in the usual depth, but just not only. Since my stock of professional applications is not a small one, I will shift the focus there, because the benchmarks of suites, some of which can cost 5-digit sums, are likely to be thin on the ground. I call this courage for the niche and it is certainly one of the reasons why this site still exists.
I’ve picked out a total of 14 benchmarks from the workstation area today as examples and put three games to the side, that’s enough for now. And it paints a very similar picture to the first test with Windows 10 versus Windows 11. I used other benchmarks on purpose to round out the picture even further. Apart from the somewhat difficult attempts after the patch, when hardly any standard software ran properly, Microsoft had patched again a bit later in the Insider program (up to the broken .NET). That took another day of work, but at least everything is up and running now. And it is precisely this interim status that is at issue today. If the patch on 10/21/2021 still does something and fixes the CPPC bug, I’ll put that data back in as well and bring a follow up. I have to measure it anyway.
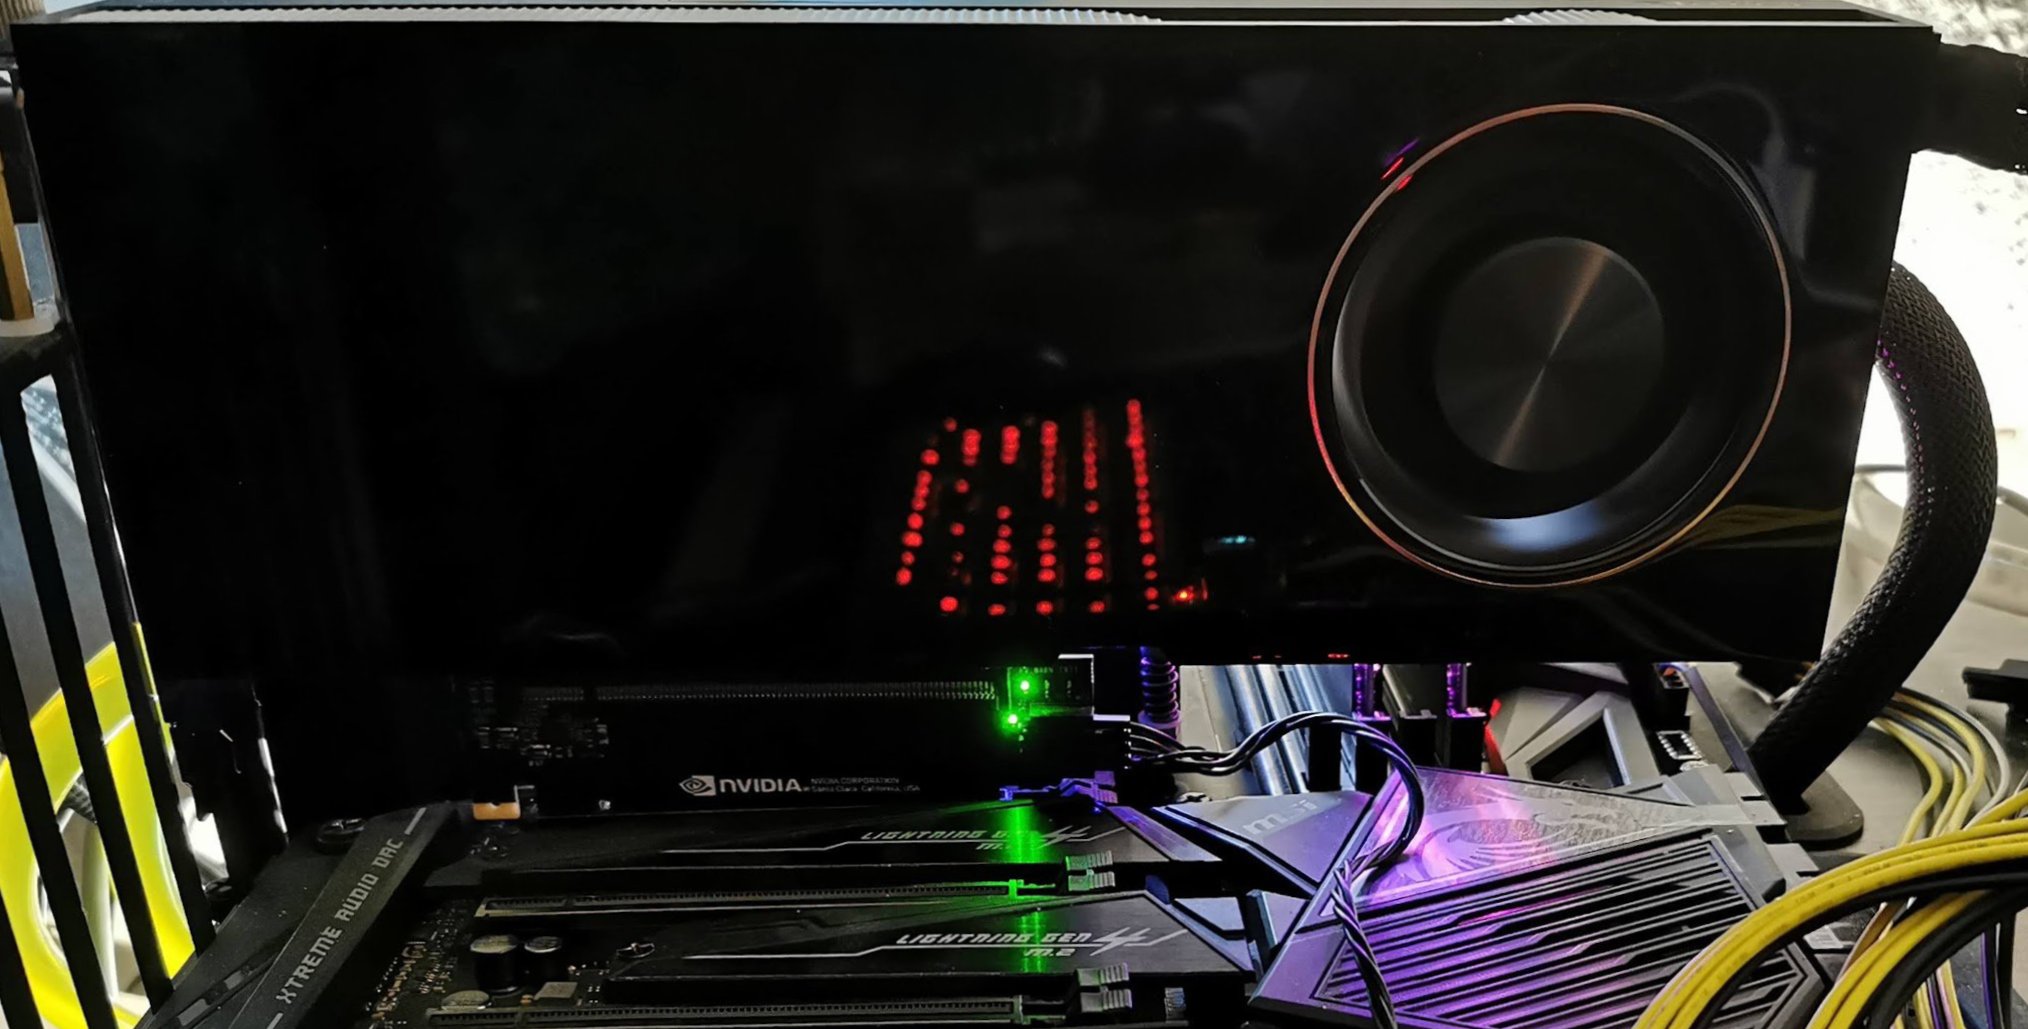
I’m using a well clocked Ryzen 9 5900X this time (see test system below), which I’m supporting with a GeForce RTX A6000, because more is hardly possible in the workstation sector. I also measure these applications mainly in Full-HD, because especially there the CPU quickly becomes a bottleneck for the graphics output. I’m just saying AutoCAD… So, be curious, my results give a much more positive picture of Windows 11 than you can read. And yes, they do exist, the negative exceptions. But there are also counter-examples that show where the journey could go!

Test system and evaluation software
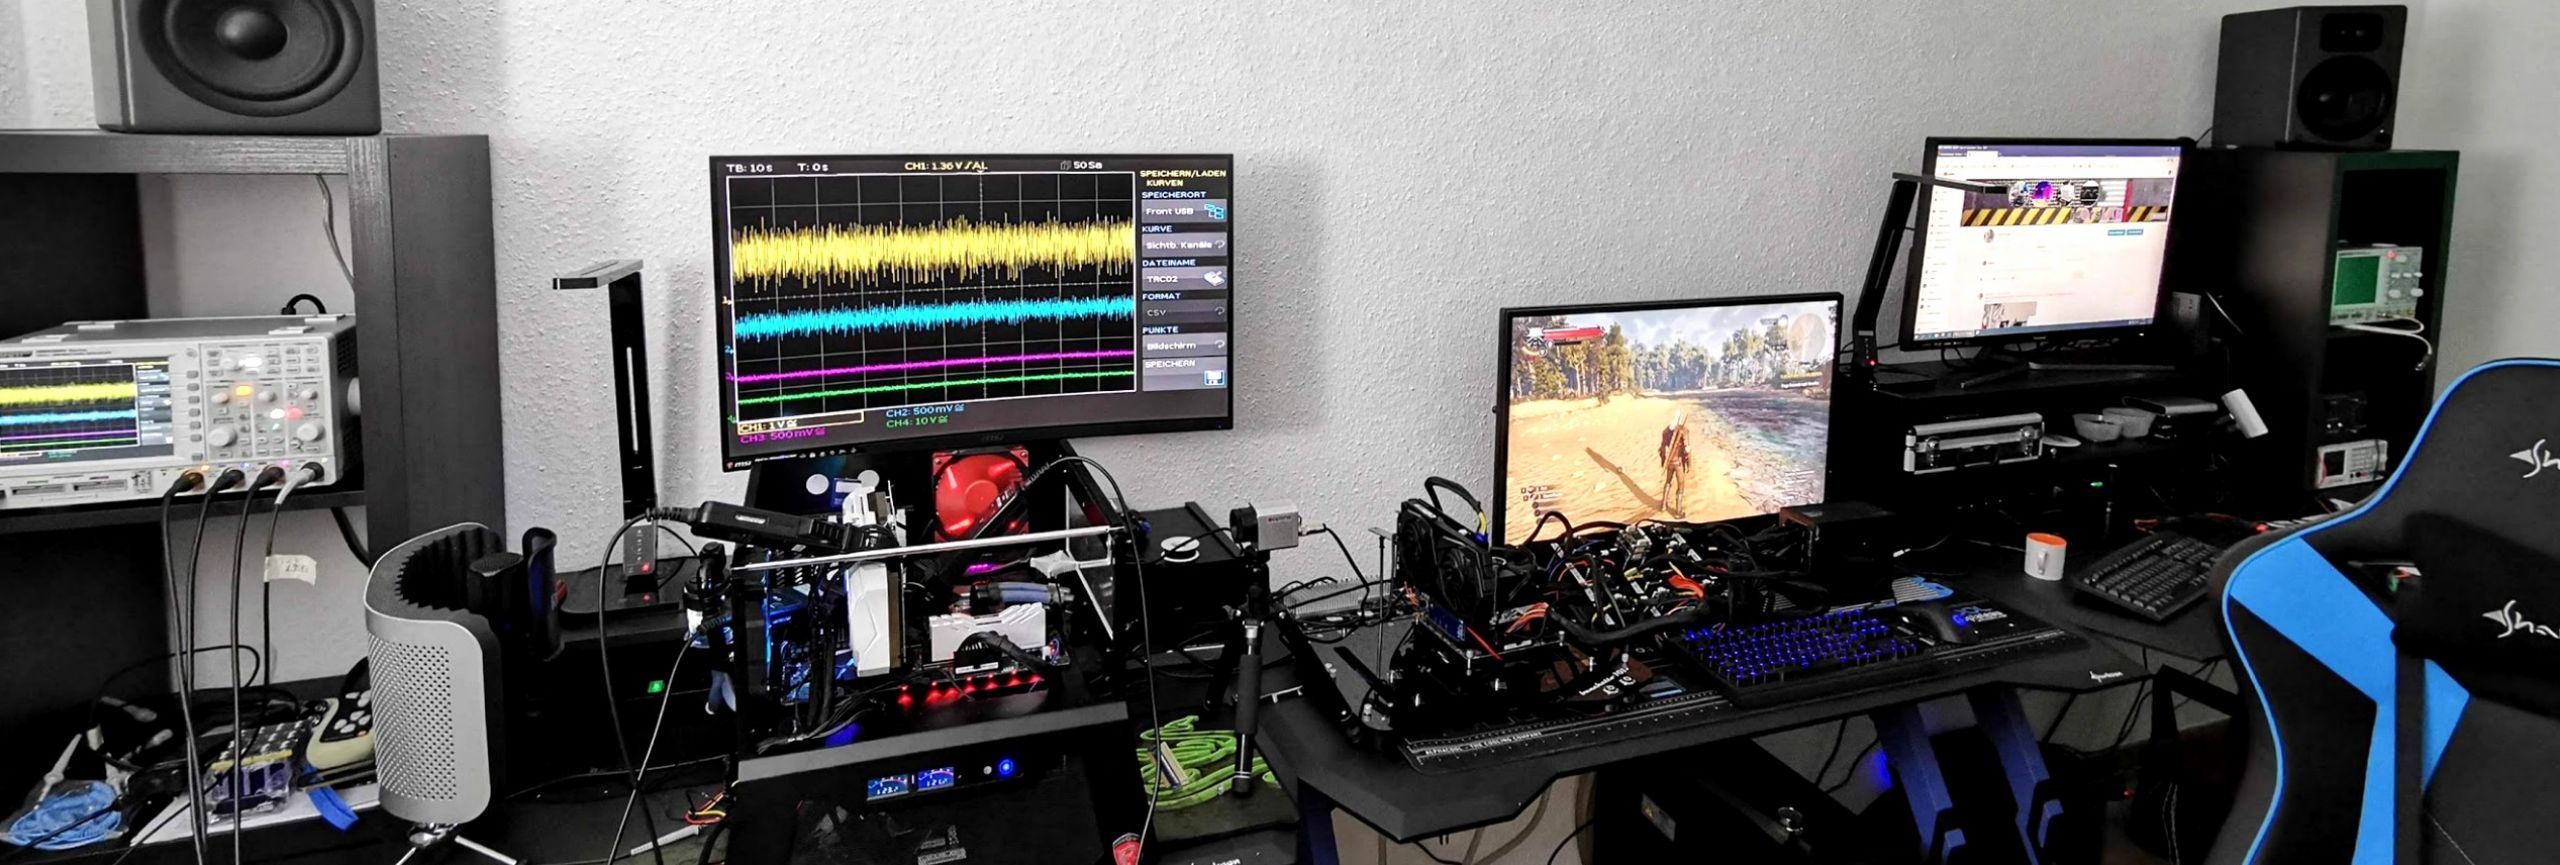
The benchmark system relies on PCIe 4.0, the matching X570 motherboard in the form of the MSI MEG X570 Godlike and a selected Ryzen 9 5900X that was overclocked water-cooled (PBO + 500 MHz). The graphics card was tested fresh with rBAR On. Add to that the matching DDR4 4000 RAM from Corsair, as well as several fast NVMe SSDs. For direct logging during all games and applications, I use my own measurement station with shunts and riser card, as well as NVIDIA’s PCAT in games, which adds to the convenience immensely.
The measurement of the detailed power consumption and other, more profound things takes place here in the special laboratory on a redundant and in detail identical test system then double-tracked by means of high-resolution oscillograph technology…
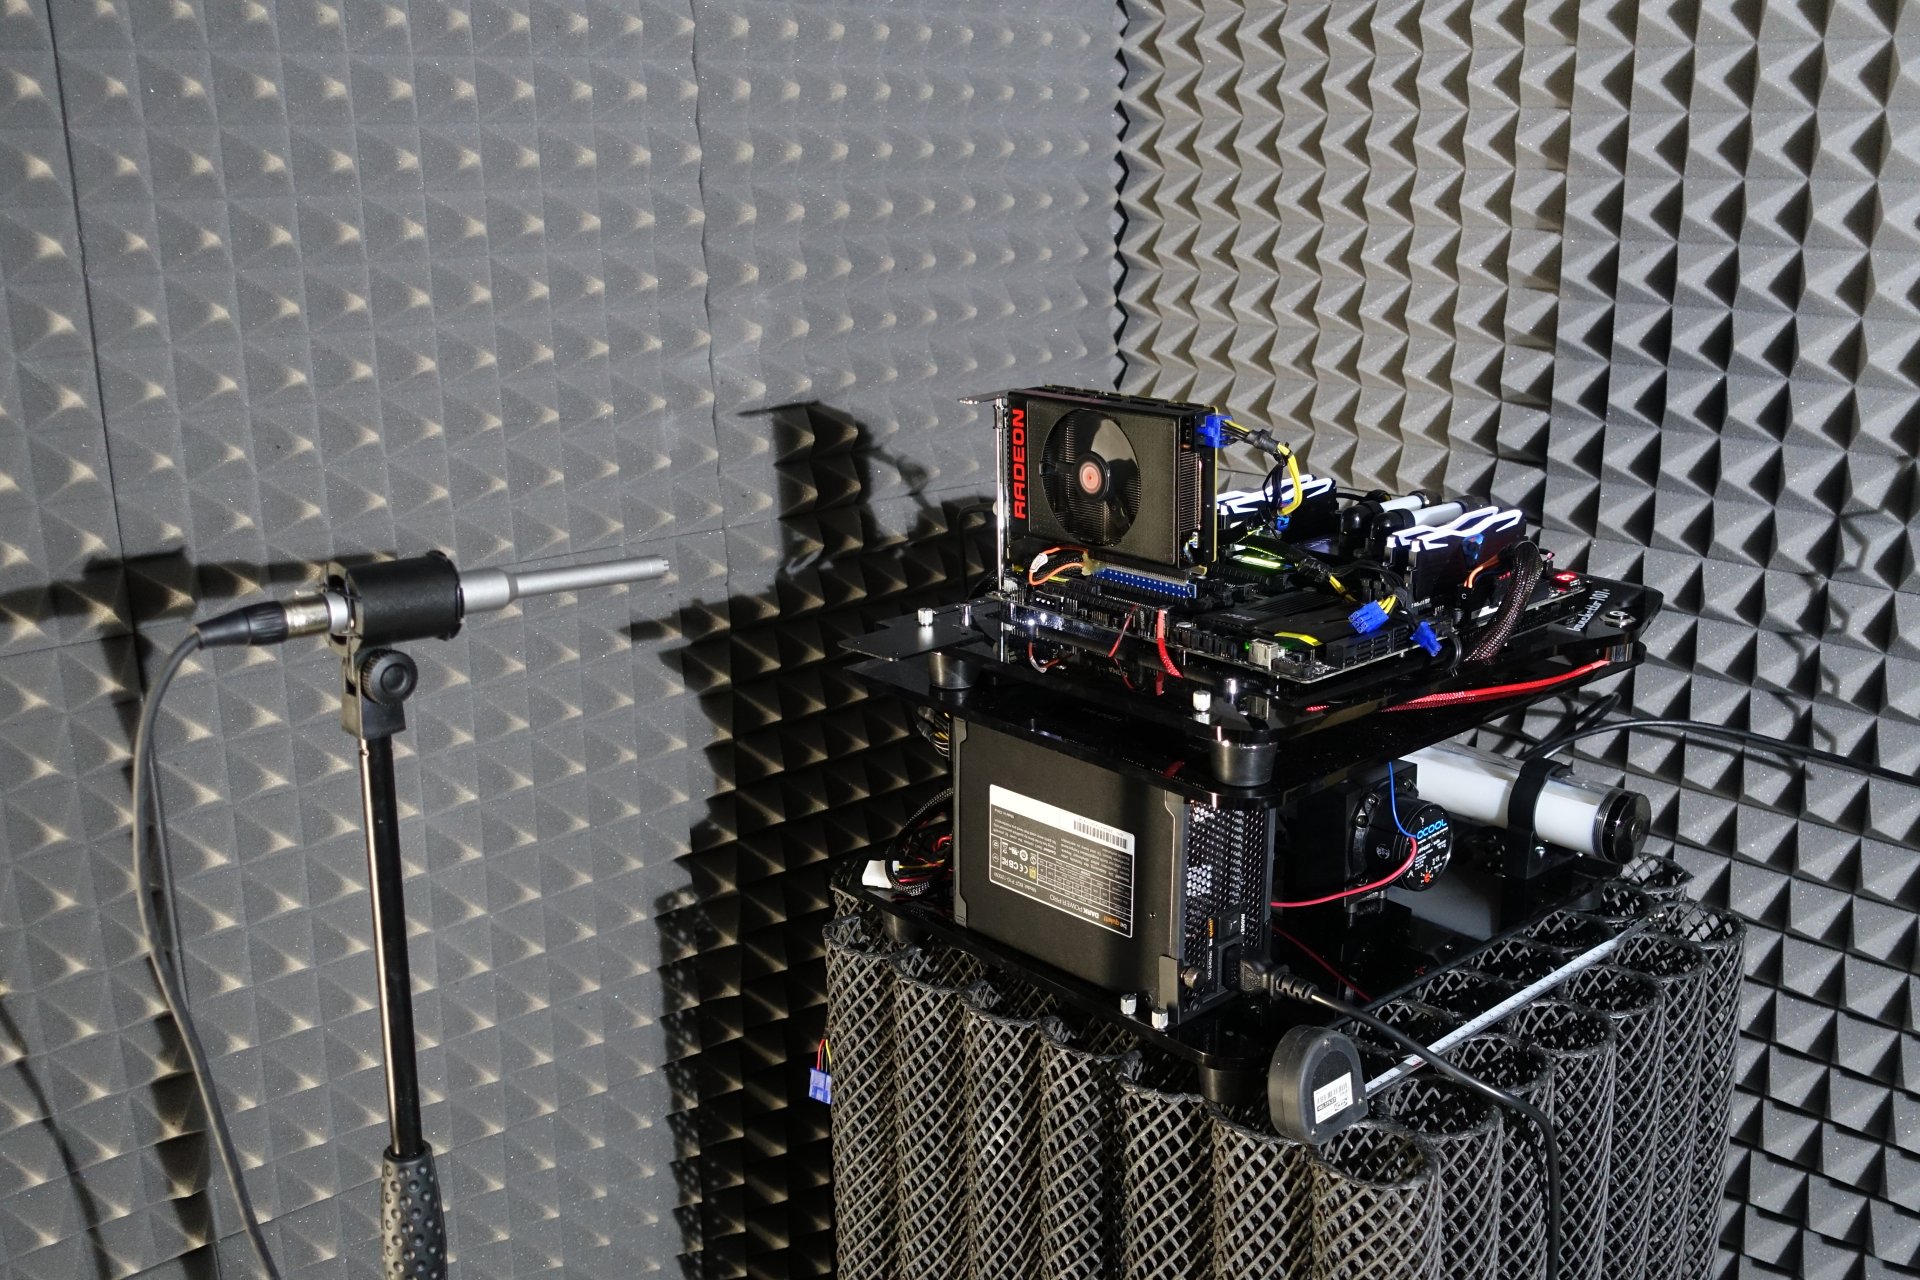
…and the self-created MCU-based measurement setup for motherboards and graphics cards (pictures below), where at the end in the air-conditioned room also the thermographic infrared images are created with a high-resolution industrial camera. The audio measurements are done outside in my Chamber (room within a room).
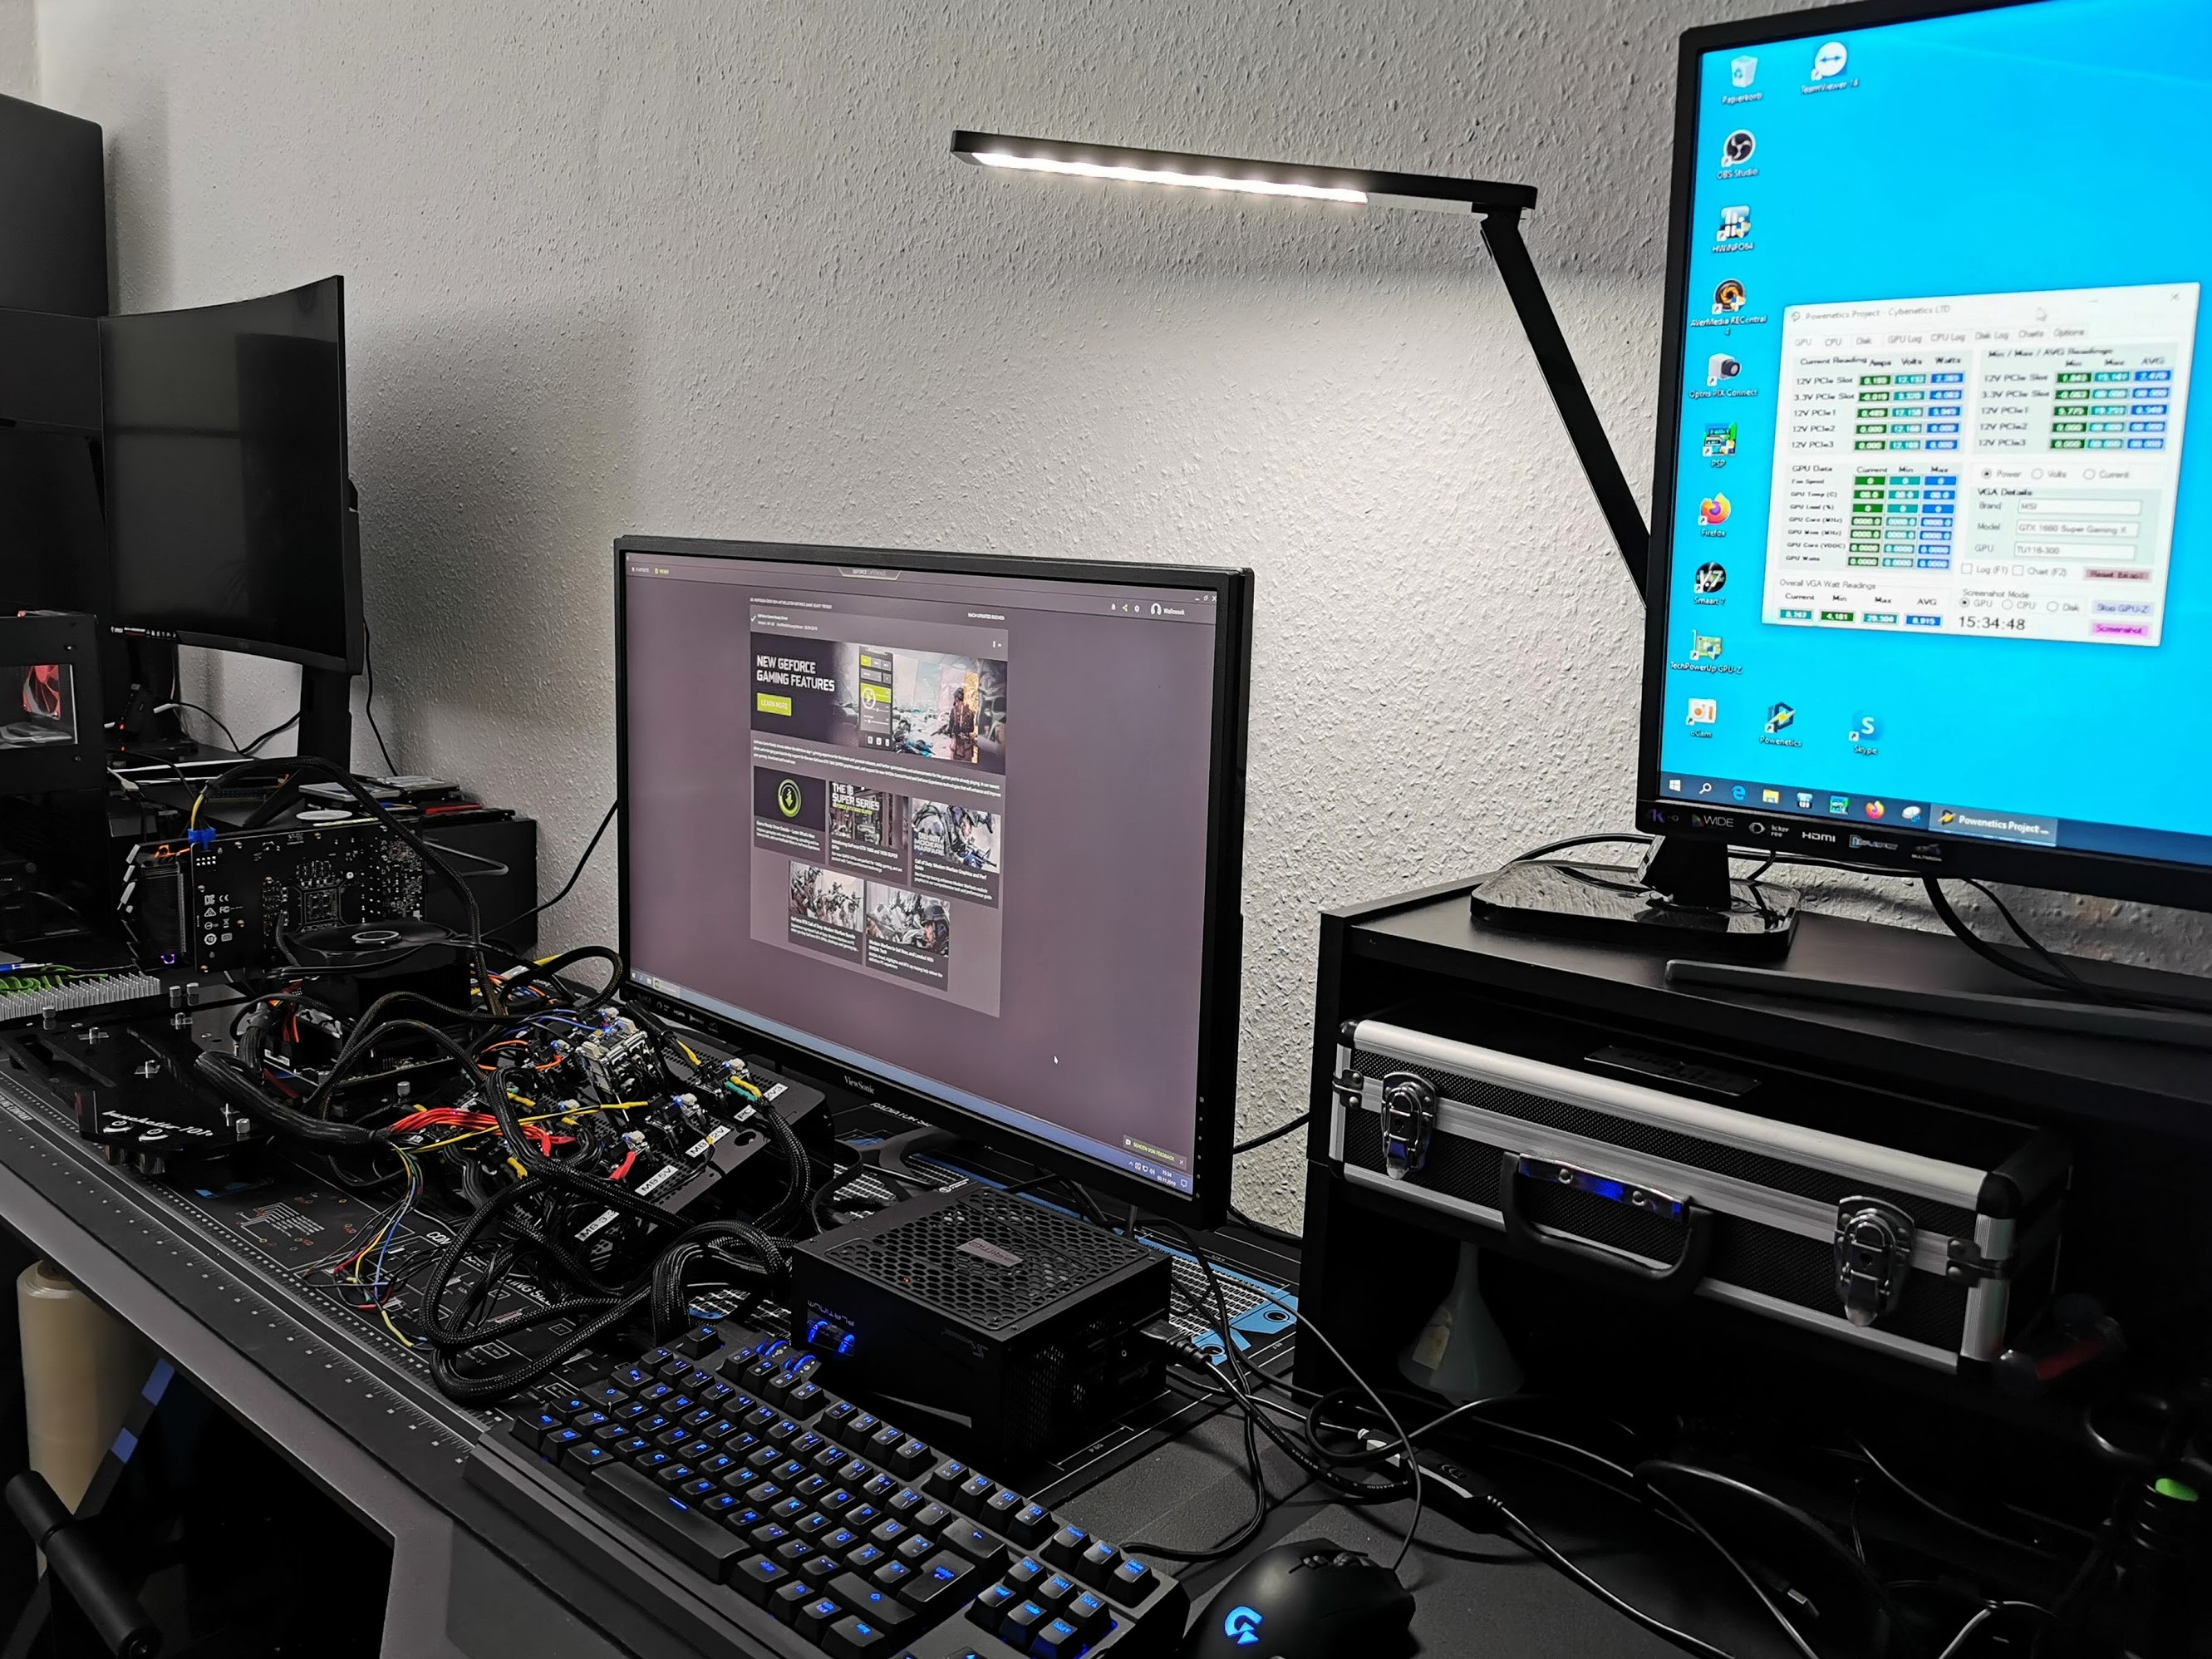

I have also summarized the individual components of the test system in a table:
| Test System and Equipment |
|
|---|---|
| Hardware: |
AMD Ryzen 9 5900X OC MSI MEG X570 Godlike 2x 16 GB Corsair DDR4 4000 Vengeance RGB Pro 1x 2 TByte Aorus (NVMe System SSD, PCIe Gen. 4) 1x2 TB Corsair MP600 Pro (Data) 1x Seagate FastSSD Portable USB-C Be Quiet! Dark Power Pro 12 1200 Watt |
| Cooling: |
Alphacool Ice Block XPX Pro Alphacool Ice Wolf (modified) Thermal Grizzly Kryonaut |
| Case: |
Raijintek Paean |
| Monitor: | BenQ PD3220U |
| Power Consumption: |
Oscilloscope-based system: Non-contact direct current measurement on PCIe slot (riser card) Non-contact direct current measurement at the external PCIe power supply Direct voltage measurement at the respective connectors and at the power supply unit 2x Rohde & Schwarz HMO 3054, 500 MHz multichannel oscilloscope with memory function 4x Rohde & Schwarz HZO50, current clamp adapter (1 mA to 30 A, 100 KHz, DC) 4x Rohde & Schwarz HZ355, probe (10:1, 500 MHz) 1x Rohde & Schwarz HMC 8012, HiRes digital multimeter with memory function MCU-based shunt measuring (own build, Powenetics software) NVIDIA PCAT and Fr |
| Thermal Imager: |
1x Optris PI640 + 2x Xi400 Thermal Imagers Pix Connect Software Type K Class 1 thermal sensors (up to 4 channels) |
| Acoustics: |
NTI Audio M2211 (with calibration file) Steinberg UR12 (with phantom power for the microphones) Creative X7, Smaart v.7 Own anechoic chamber, 3.5 x 1.8 x 2.2 m (LxTxH) Axial measurements, perpendicular to the centre of the sound source(s), measuring distance 50 cm Noise emission in dBA (slow) as RTA measurement Frequency spectrum as graphic |
| OS: | Windows 10 Windows 11 (.258.0) Windows 11 Patched (.282.0) |


71 Antworten
Kommentar
Lade neue Kommentare
Veteran
Urgestein
1
Veteran
Urgestein
Veteran
Urgestein
Veteran
Urgestein
Mitglied
Urgestein
Urgestein
Urgestein
Urgestein
Urgestein
Alle Kommentare lesen unter igor´sLAB Community →