


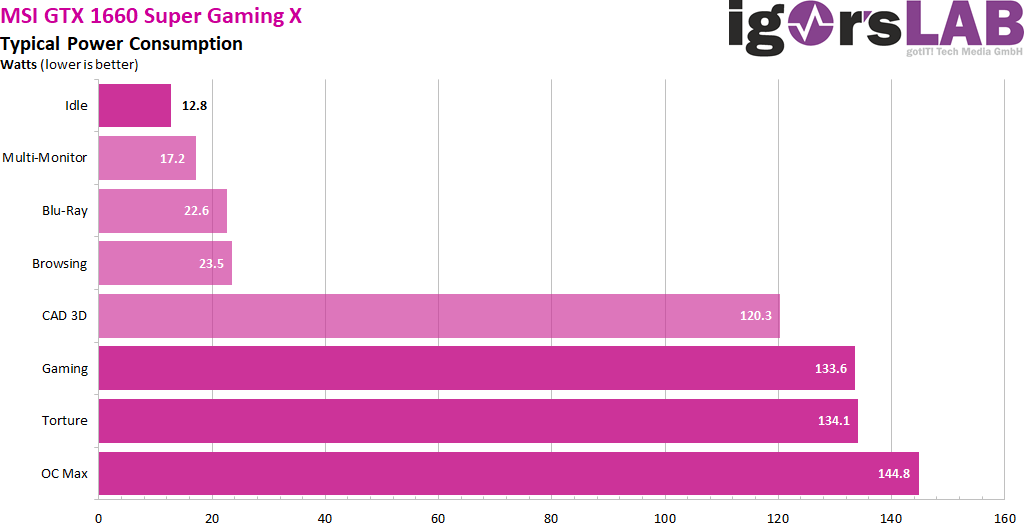
Power consumption and loads
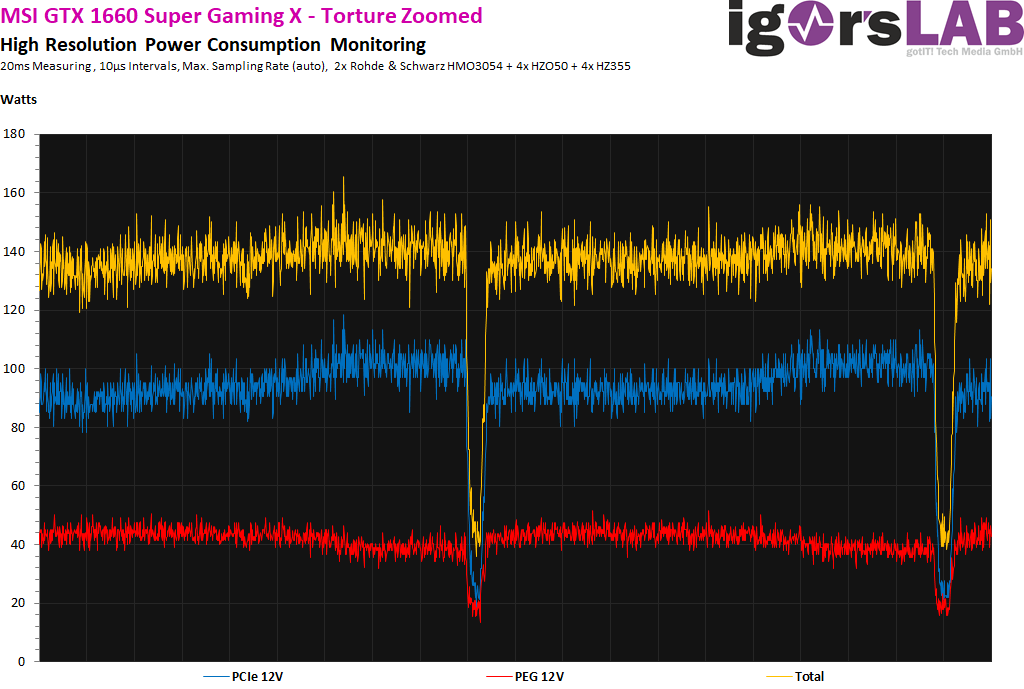
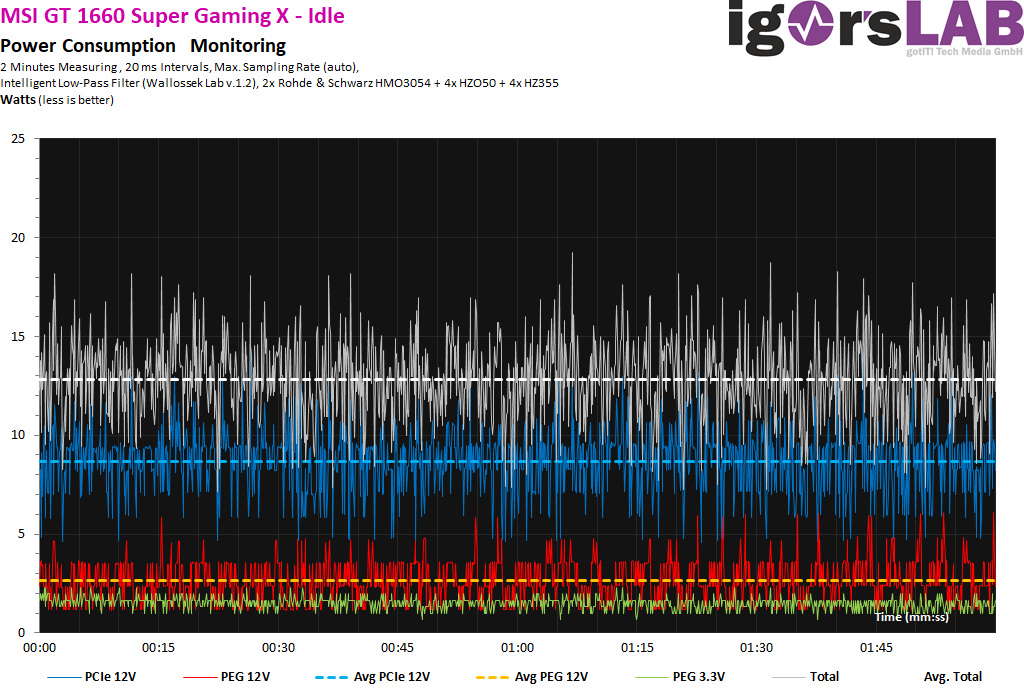
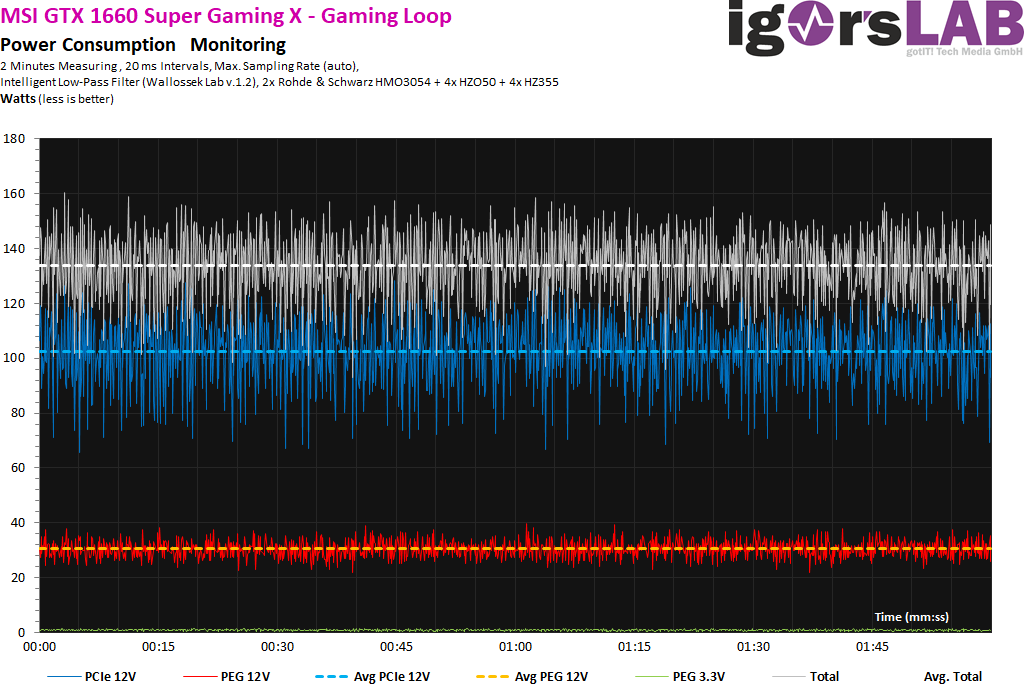
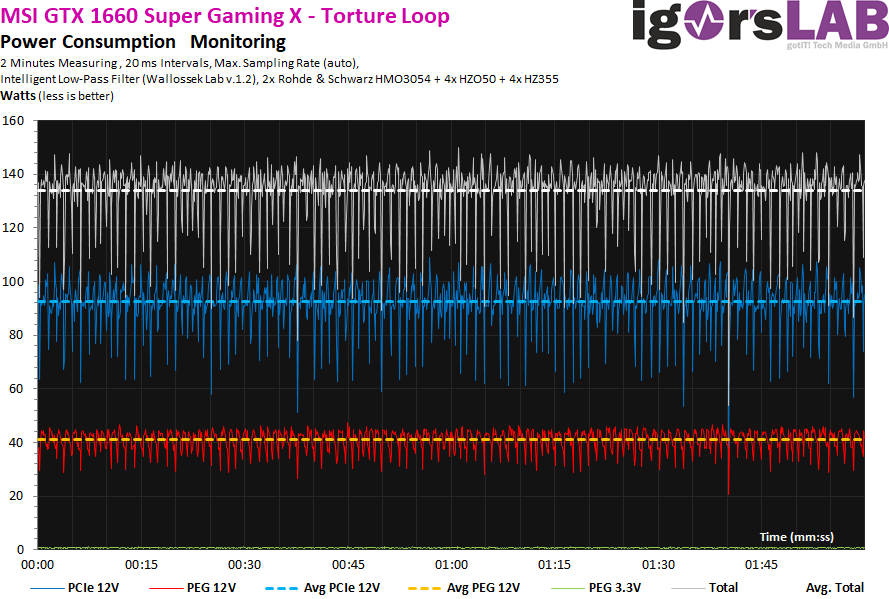
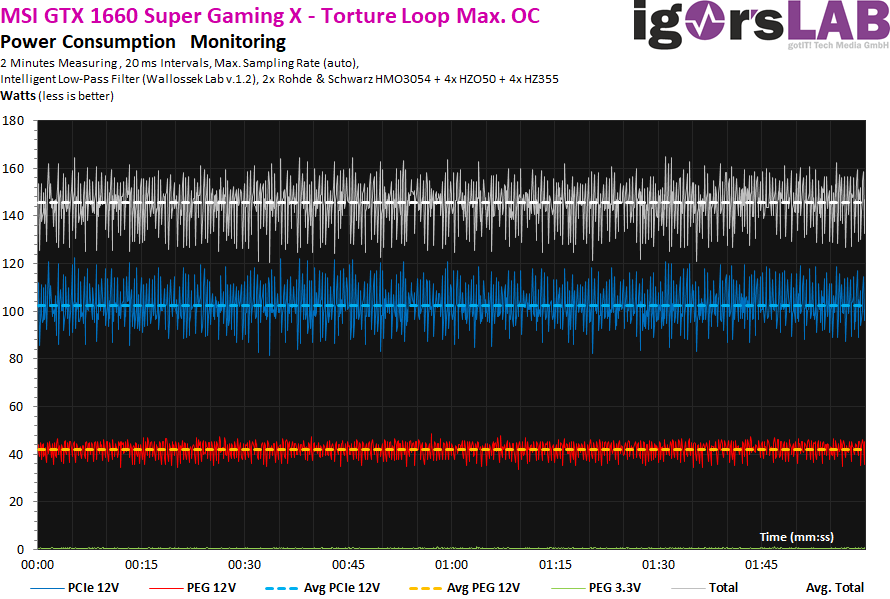
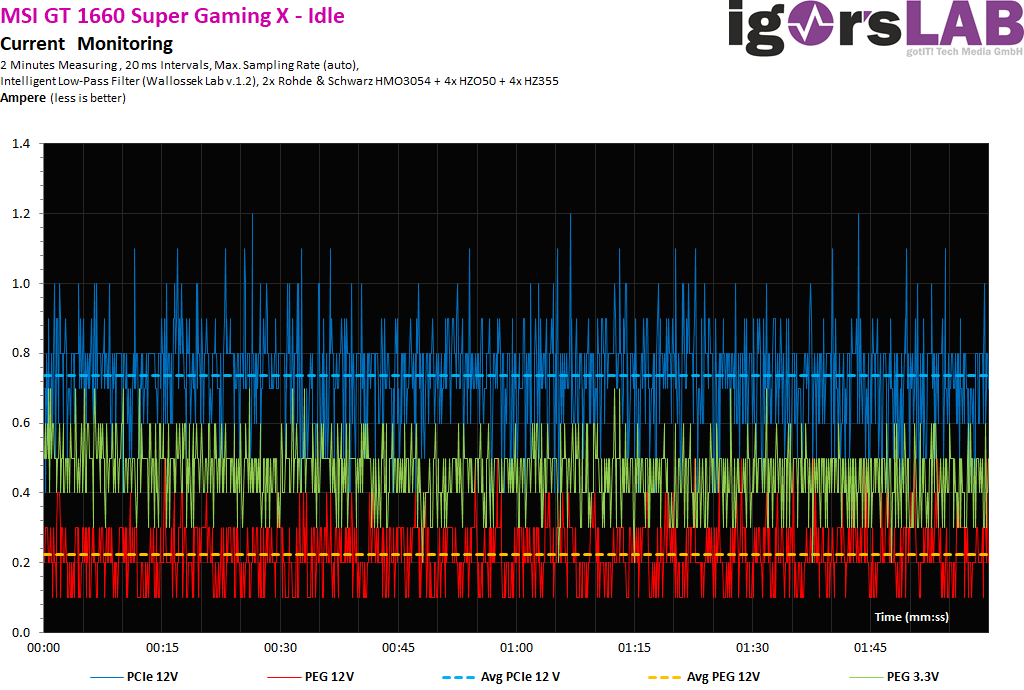
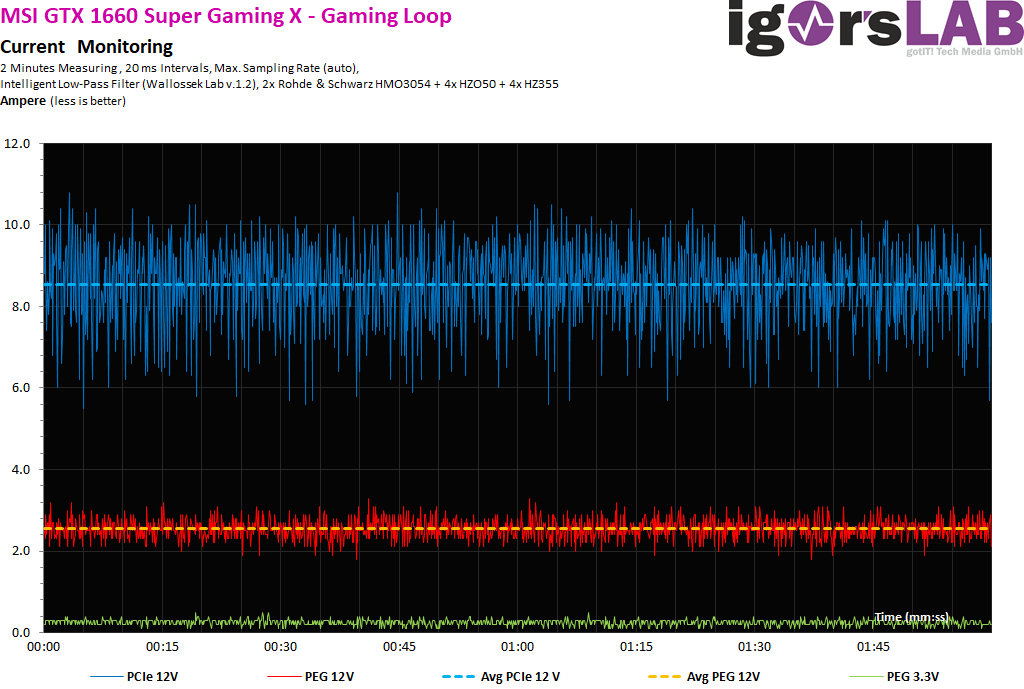
The power consumption of the MSI GTX 1660 Super Gaming X with just under 10 watts in the idle is exactly where you could expect it, the MSI GTX 1660 Ti Ventus XS and the EVGA GTX 1660 Ti XC Black Gaming are almost a watt less, as the streetlights remain dark. With the gaming loop, the Gaming X with a good 132 watts and the torture loop with just under 134 watts is within the range of the set limit of 130 watts. The MSI GTX 1660 Ti Ventus is located with approx. 124 or 125 watts due to the lower clock a little below.
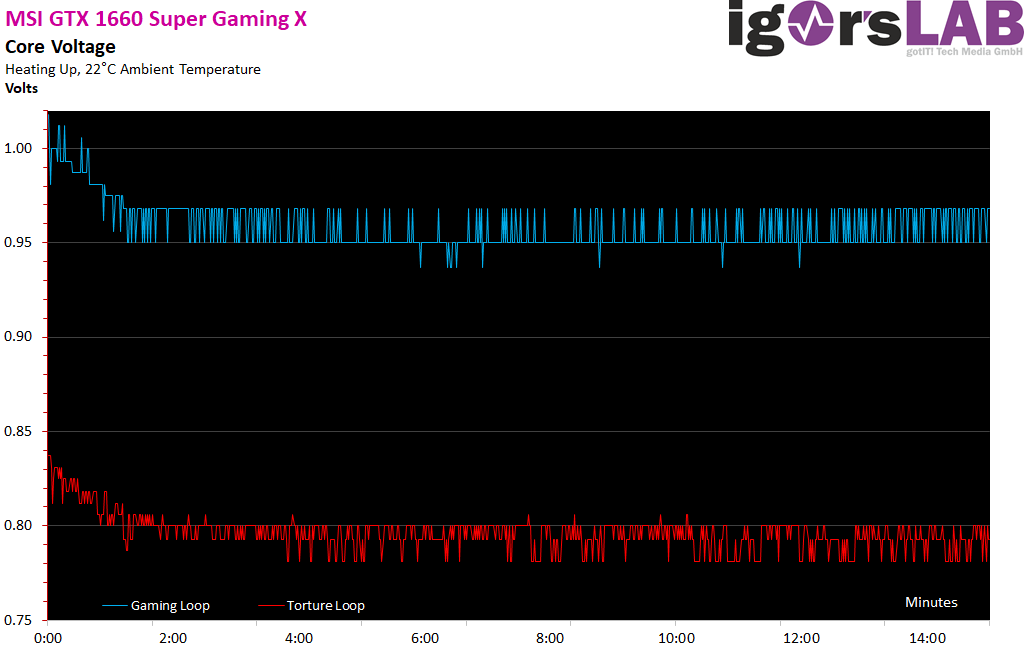
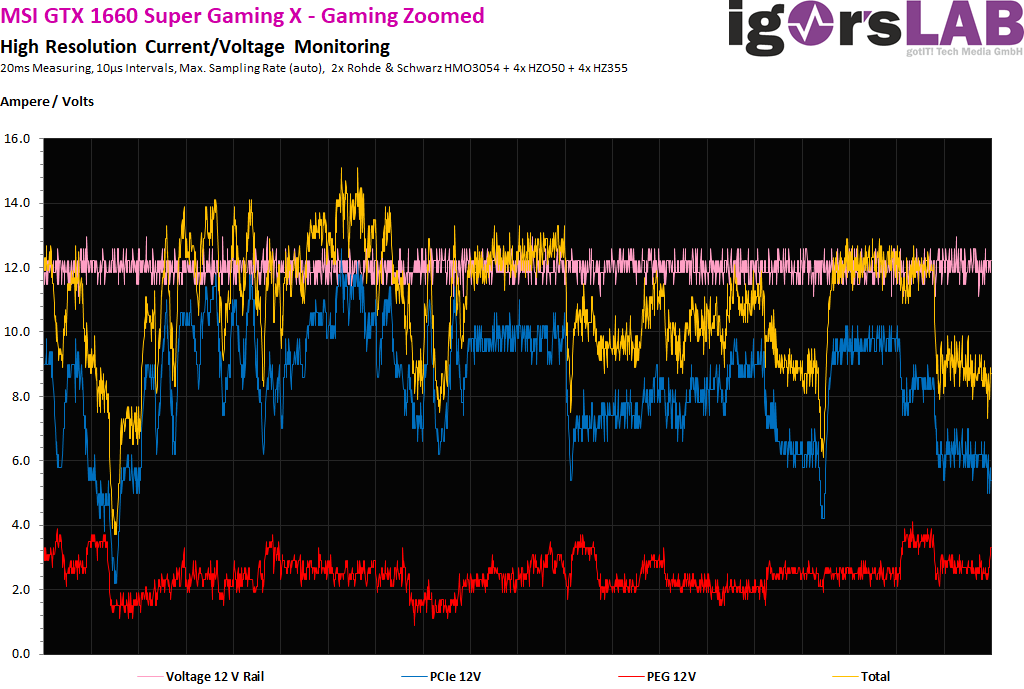
The voltages are in the expected range, but do not reach 1.05 volts in the cold state. The average value over the entire runtime tends towards 1 volt for the cards:
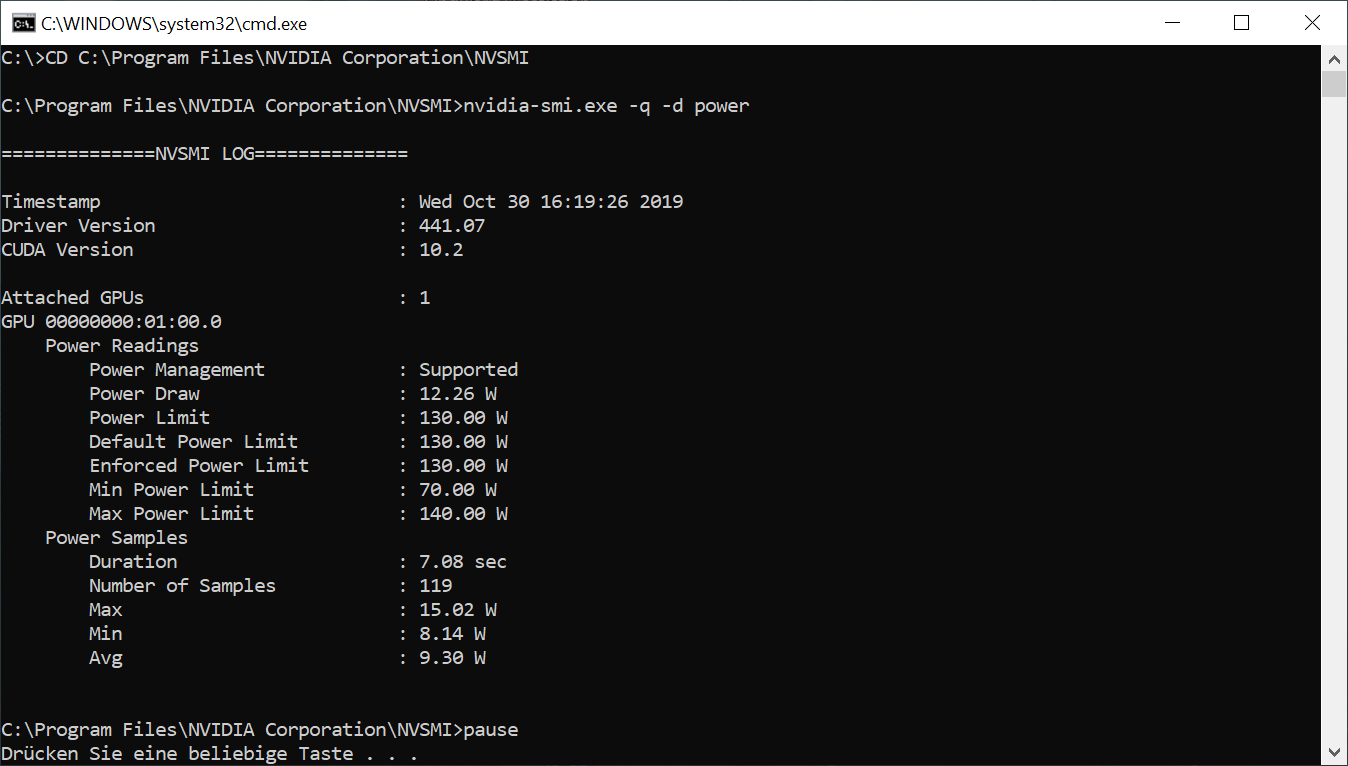
Here is a short excerpt from what MSI actually gave this card in the firmware of limits:
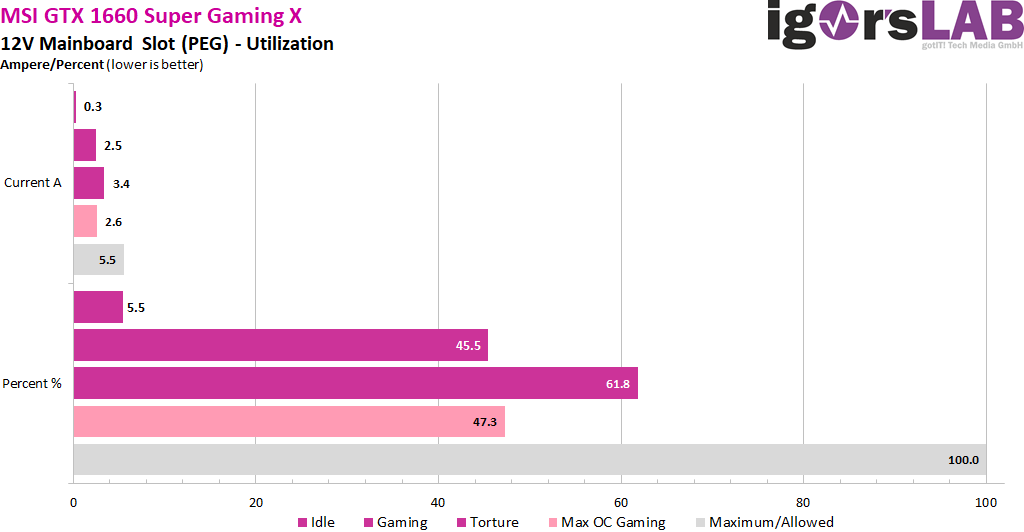
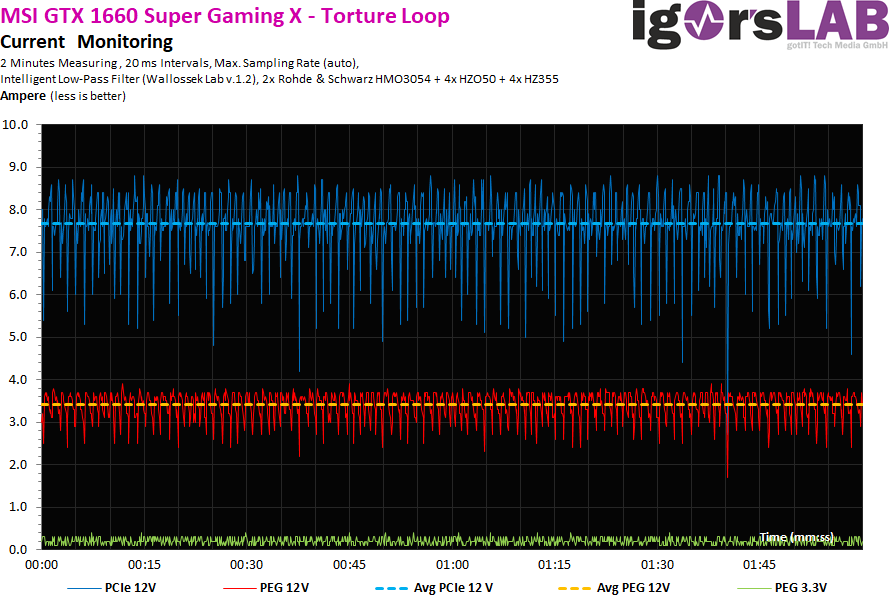
The load distribution on the rails is interesting, because the maximum 5.5 amperes of the motherboard slot are never exceeded. Balancing has been solved in an exemplary manner.
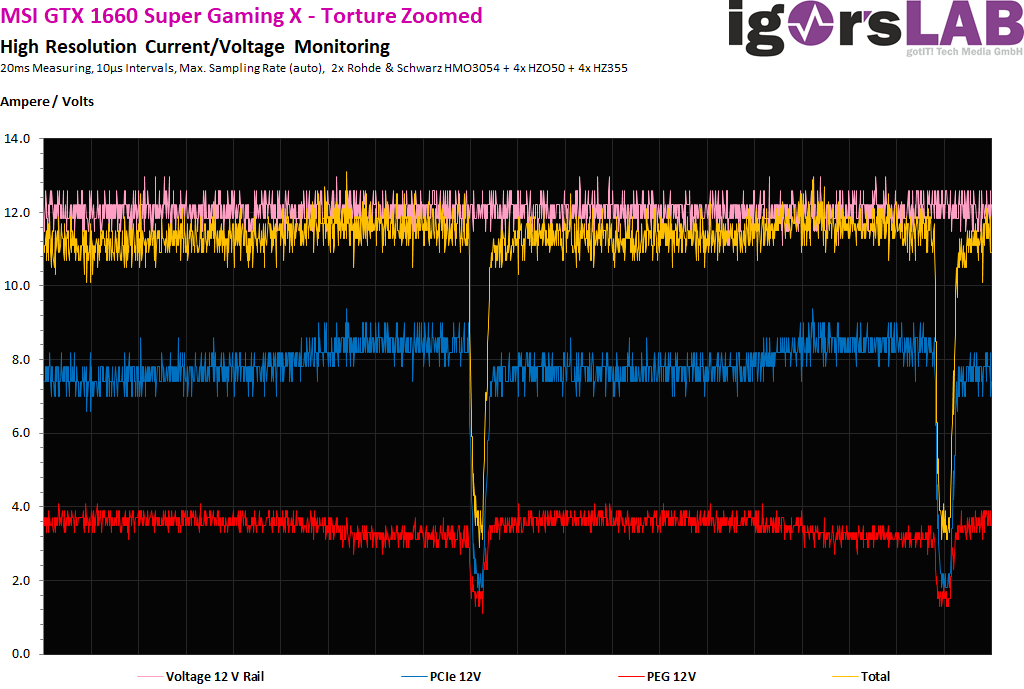
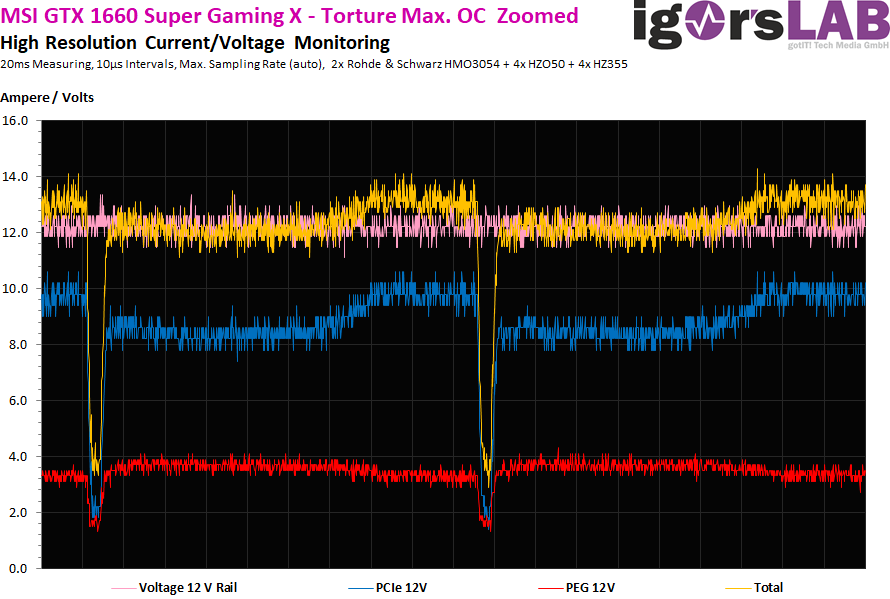
Power supply design and peak loads/currents
As I have already demonstrated in detail in my basic article "The fight of graphics card against power supply – power consumption and load peaks demystified", there are also temporarily higher loads in the millisecond range, which are unfavorable in case of unfavorable designed or improperly equipped power supplies can already lead to unexplained shutdowns. The TBP (Typical Board Power) measured by the graphics card manufacturer or the reviewers does not really help for a stable design of the system.
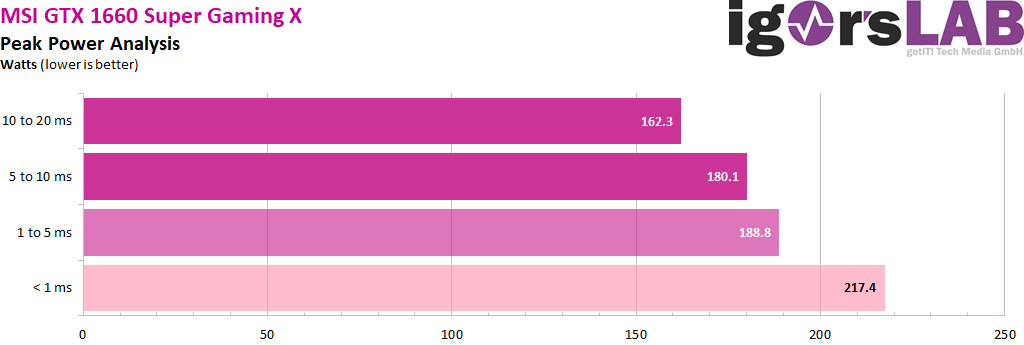
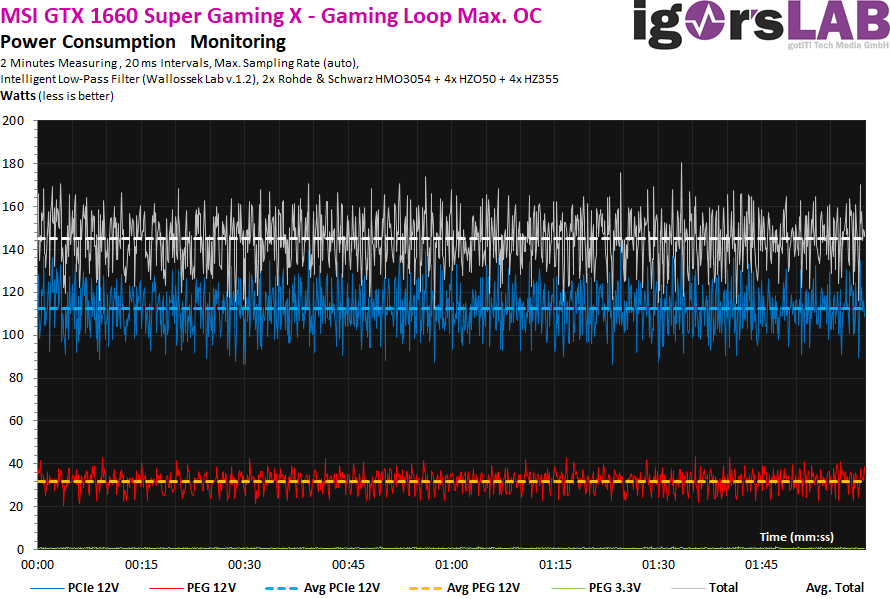
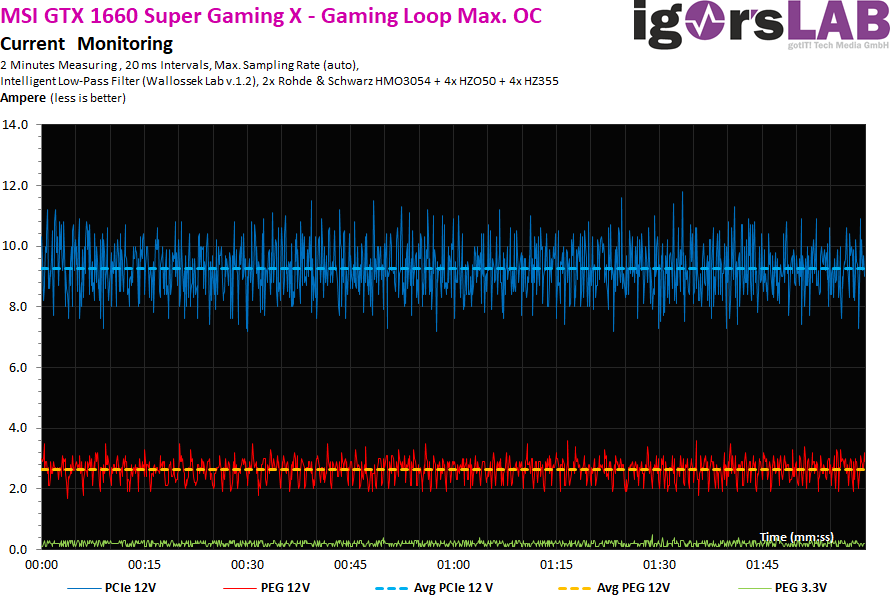
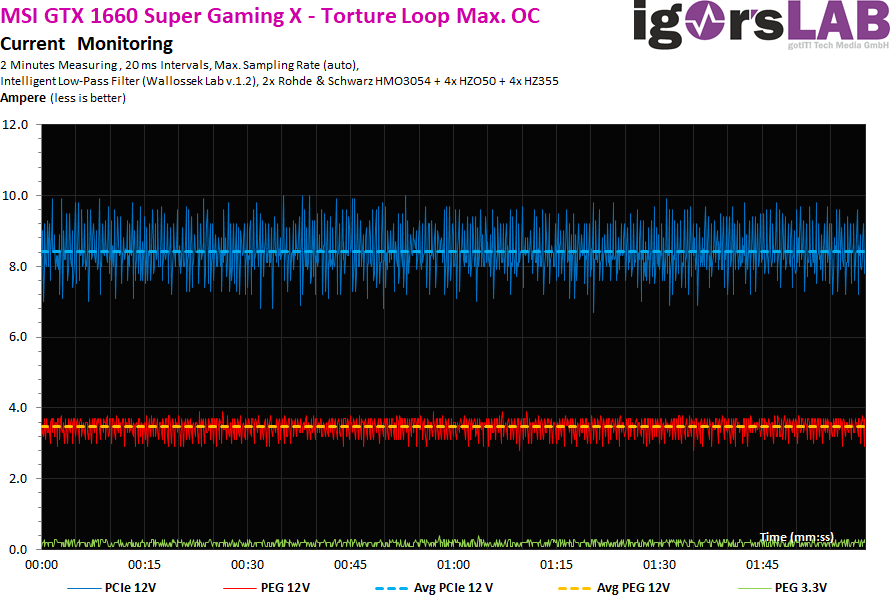
Peaks with intervals between 1 and 10 ms can lead to shutdowns with very fast-reacting protective circuits (OPP, OCP), especially for multi-rail power supplies, although the average power consumption is still in the norm. For the MSI GTX 1660 Ti Gaming X I would therefore calculate with 160 to 170 watts for the normal OC and with approx. 150 watts to have enough reserves in case of cases. A short excerpt with high resolution now shows us the 20 ms measurements (10 S intervals), how I run them automatically for valuation:
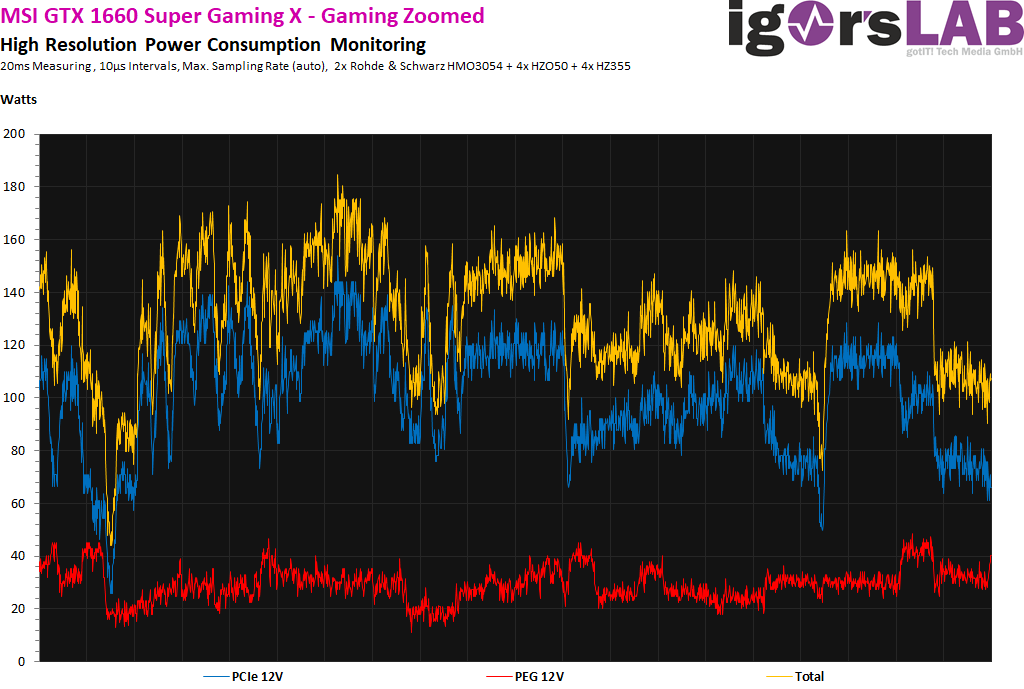
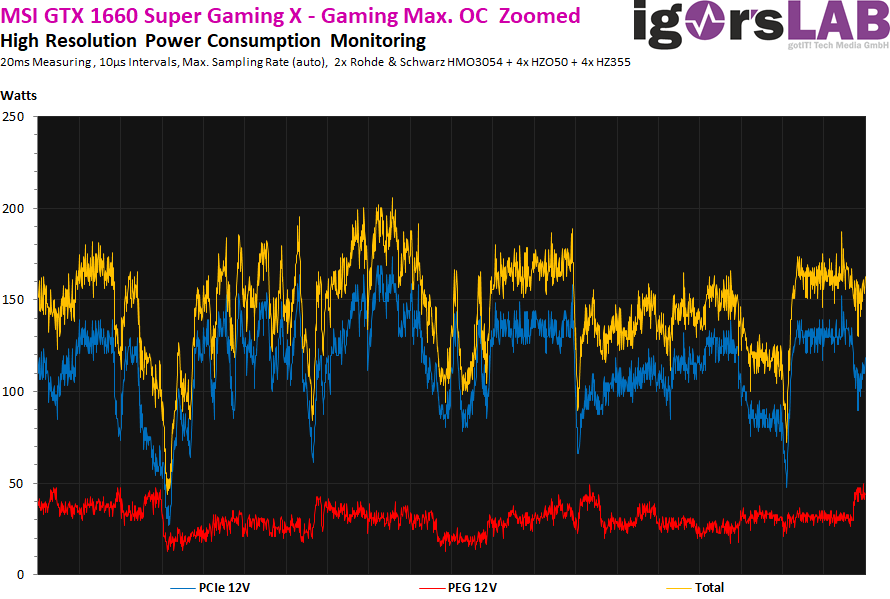
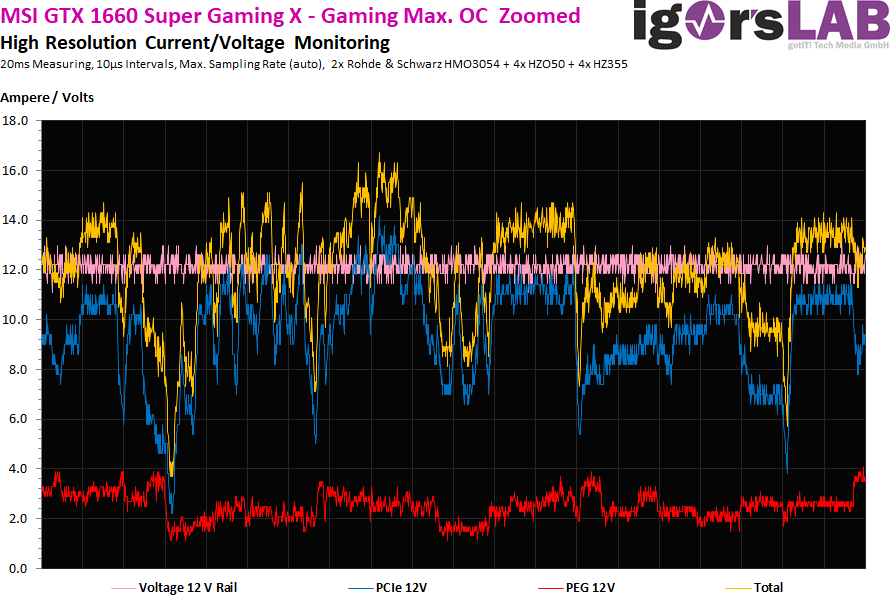
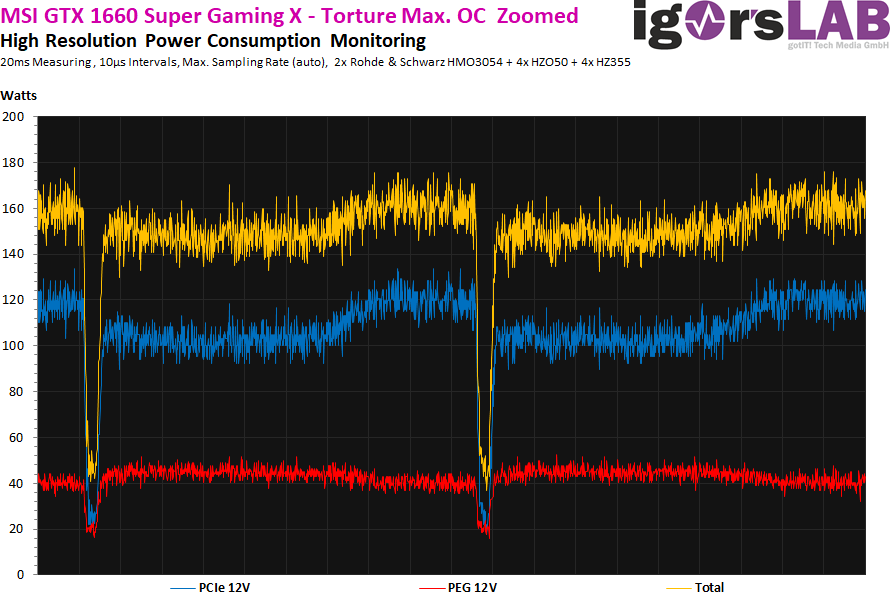
Detailed recording of average power consumption and flowing currents
As usual, I now also set aside the power consumption and the flowing currents as detailed graphics of my oscillograph measurements. A service that hardly anyone else offers and which shows how the maps "tick" in detail:


Kommentieren