


Important preliminary note
We’ll do the same today with the benchmarks as always, i.e. again like yesterday in the previous test without the overclocking. This is important because in the sum of all games the peculiarities of the respective architectures quickly blur. In the end, there are only 10 specially selected games, but I chose these from over 20 titles and the pre-tests with several cards as examples, because the result was almost exactly the same in the end. The weighting between the titles with pure raster graphics without DXR and those with DXR was done in a ratio of 6:4, with the four DXR titles coming out very differently. This may not be entirely in line with the manufacturer’s wishes, but it reflects everyday life well.
Full ray tracing fun in Cyberpunk 2077, combined with more mid-range effects like in Metro Exodus EE and the hybrid implementation of lighting to Marvel’s Guardians of the Galaxy and Shadow of the Tomb Raider, where ray tracing really only comes into play humanely. DXR is being implemented in more and more games, and the current engines almost all allow for it by now. From this point of view, it would be just as unfair to completely forego it as it would be to exclusively use such titles with DXR. Since every user has different preferences and some prefer to do without DXR completely (why actually?), I accommodate all target groups as always.
Sum of all games
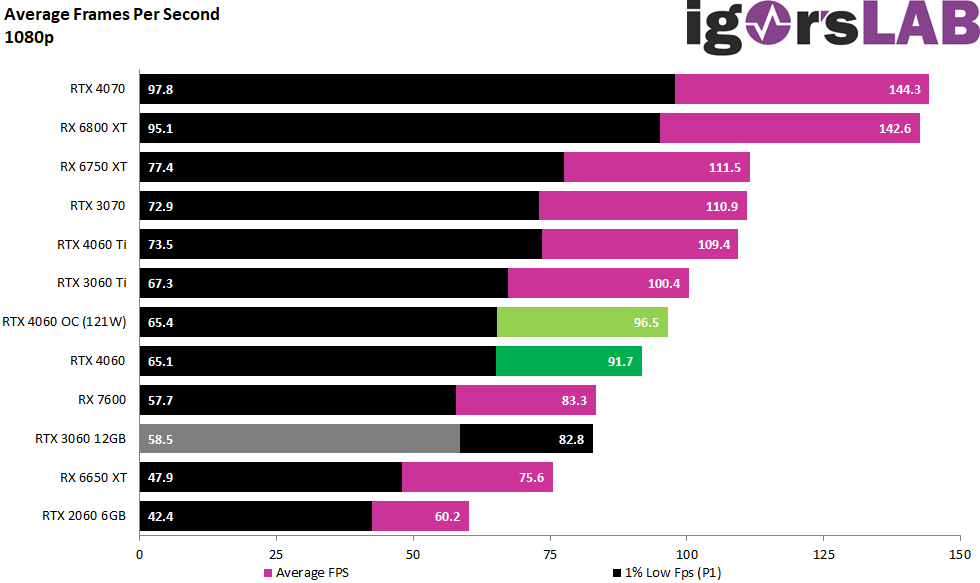
First, I’ll show you the normalized results of all games, since that’s what most people are most interested in. Of course, the details come right after that in the usual detail. I normalized the FPS and percentiles and formed a geometric mean (Geomean), because statistically this is simply more accurate and is also how it is done in the industry. Today, it’s MSRP card vs OC card first.
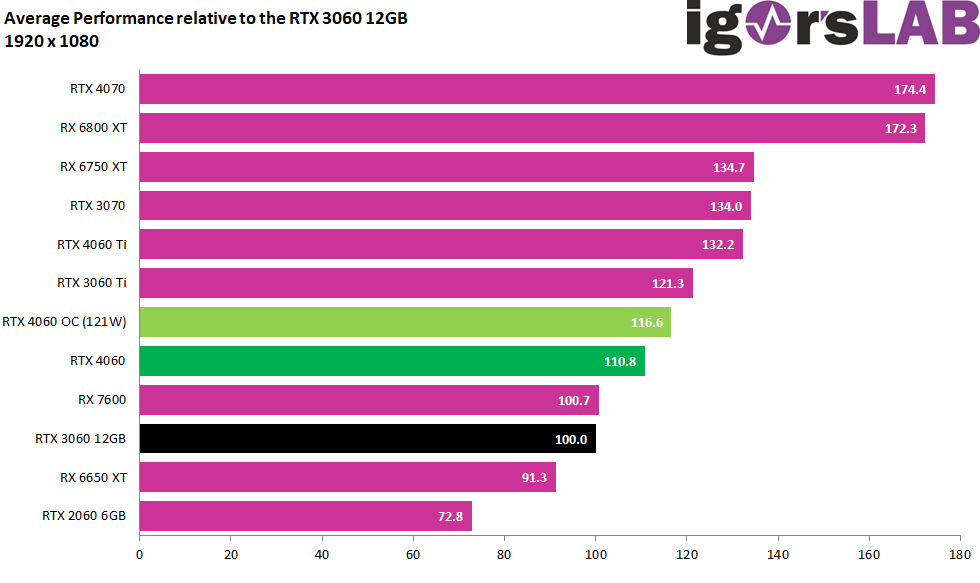
The 115 watt card lands 10.8 percentage points ahead of the old GeForce RTX 3060 12 GB in Full HD, and the OC card even manages 16.6%. The RTX 3060 Ti only misses the RTX 4060 OC by 4.7 percentage points and it is still 15.6 percentage points to the RTX 4060 Ti. Yes, the GeForce RTX 4060 OC is significantly faster than the RTX 3060 12 GB and the Radeon RX 7600 it almost as fast as in some YouTube videos with OC and no cherry picking. Check it out!
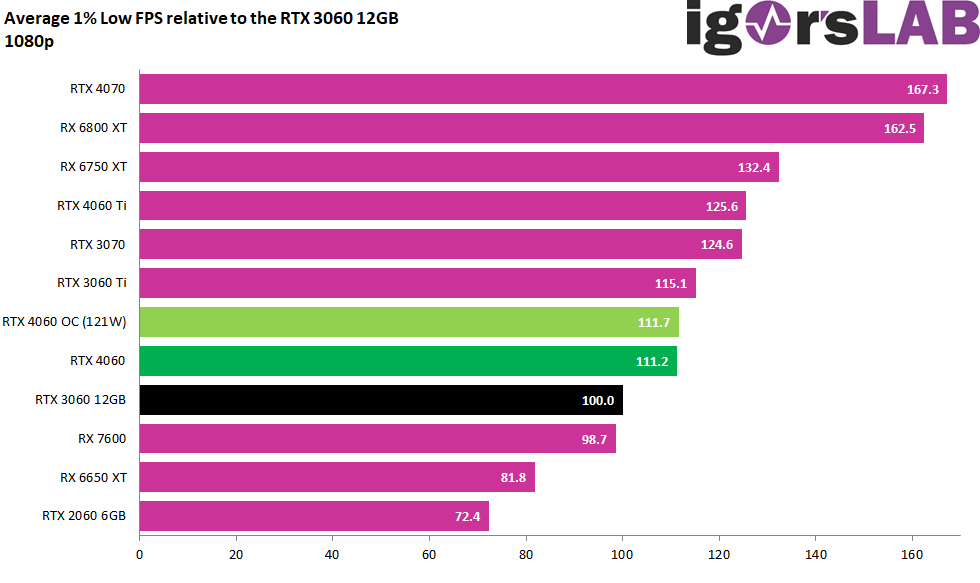
At P1, i.e. the Min FPS, the GeForce RTX 4060 OC is then 11.7 percent ahead of the RTX 3060 12 Gb, only 0.5 percent ahead of the MSRP card and only just under 3.4 percentage points behind the RTX 3060 Ti.
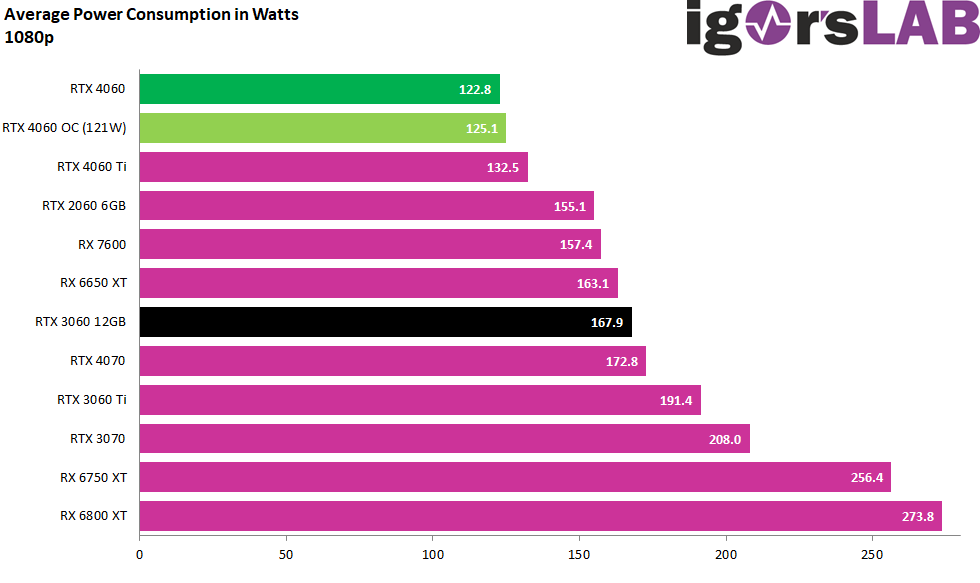
The power consumption turns out to be low on average, as expected, but the ample 125 watts somewhat deceive about the games, where it is much thirstier. But, this is also important: overclocking only costs a meager 2.3 watts more (on average). That is just under 1.9% more power for 5.8% more performance! So we see that better binning and especially better voltage converters with less losses offer real added value!
I won’t go into the individual metrics here, because compared to yesterday’s map, the basic statements don’t change at all. Faster: yes. Smoother: no.
- 1 - Einführung, technische Daten und Technologie
- 2 - Test System im igor'sLAB MIFCOM-PC
- 3 - Teardown: PCB und Komponenten
- 4 - Gaming Performance FHD (1920 x 1080)
- 5 - Gaming-Performance WQHD (2560 x 1440)
- 6 - Gaming Performance DLSS vs. DLSS3 vs. FSR
- 7 - Lastspitzen, Kappung und Netzteilempfehlung
- 8 - Temperaturen, Taktraten, Lüfter und Geräuschentwicklung
- 9 - Zusammenfassung und Fazit


20 Antworten
Kommentar
Lade neue Kommentare
Urgestein
1
Urgestein
Veteran
Mitglied
Urgestein
Veteran
Veteran
Veteran
Urgestein
Urgestein
Veteran
Mitglied
1
Mitglied
Moderator
Neuling
Neuling
Urgestein
Alle Kommentare lesen unter igor´sLAB Community →