


Since many users and especially YouTubers as well as twitchers still take the values of tools like the MSI Afterburner or AMD’s Radeon software for the power consumption of their graphics card at face value, I have to add something. The vast amount of videos that are supposed to show how much more “economical” graphics card A is supposed to be compared to graphics card B still make those who know better (and can) cry in rows. Funny side note: Even NVIDIA distributes PCAT, a tool that serves to find the truth about the power consumption of graphics cards, among editors and relevant video creators today. However, it has been rather less helpful so far, unfortunately.
Because questions kept coming up as to why the values I measured in games deviated so much from the manufacturer’s specifications (TBP) for the entire graphics card, I revised an existing article a bit and added a new chapter in front of it. Here I first analyze 11 games with and without ray tracing load in Ultra-HD for most relevant cards, which we also still know from the launch article about the NVIDIA GeForce RTX 4090 24 GB. Because the result is quite interesting. In deviation from the last test, I ran the custom Radeon RX 6950XT with a reference BIOS because it would have otherwise distorted the measurements a bit.
After this introduction, we will also primarily look at the solution approach of both manufacturers in terms of determining and logging the power consumption, because there is still a lot of catching up to do here. Software tools and AMD cards have always been a nagging problem, but more on that later. You can of course measure Radeons properly at the power supplies, but you can’t read them cleanly. Unfortunately, what all the tools display is not all that passes through the lines. But more about that on the next page.
450 watt card not equal to 450 watt card!
Looking at the first graph, we can see that the GeForce RTX 3090 Ti is a true 450 watt power limit (TBP) card, which unfortunately fully achieves this power consumption even in gaming. However, the so often (completely unjustly) scolded GeForce RTX 4090 is more of a 380 watt card in gaming, which only uses the available performance margin at all when you run stress tests or run pure compute on the shaders!
With Ada, NVIDIA has built in an extreme buffer in contrast to its own Ampere cards and AMD, which can be achieved in places, but is usually not reached in every application. Every game is different and there are extreme examples that demand a lot of performance. But in the whole range of applications, average values are always the most objective statement. After all, you don’t always drive steeply uphill in real life.
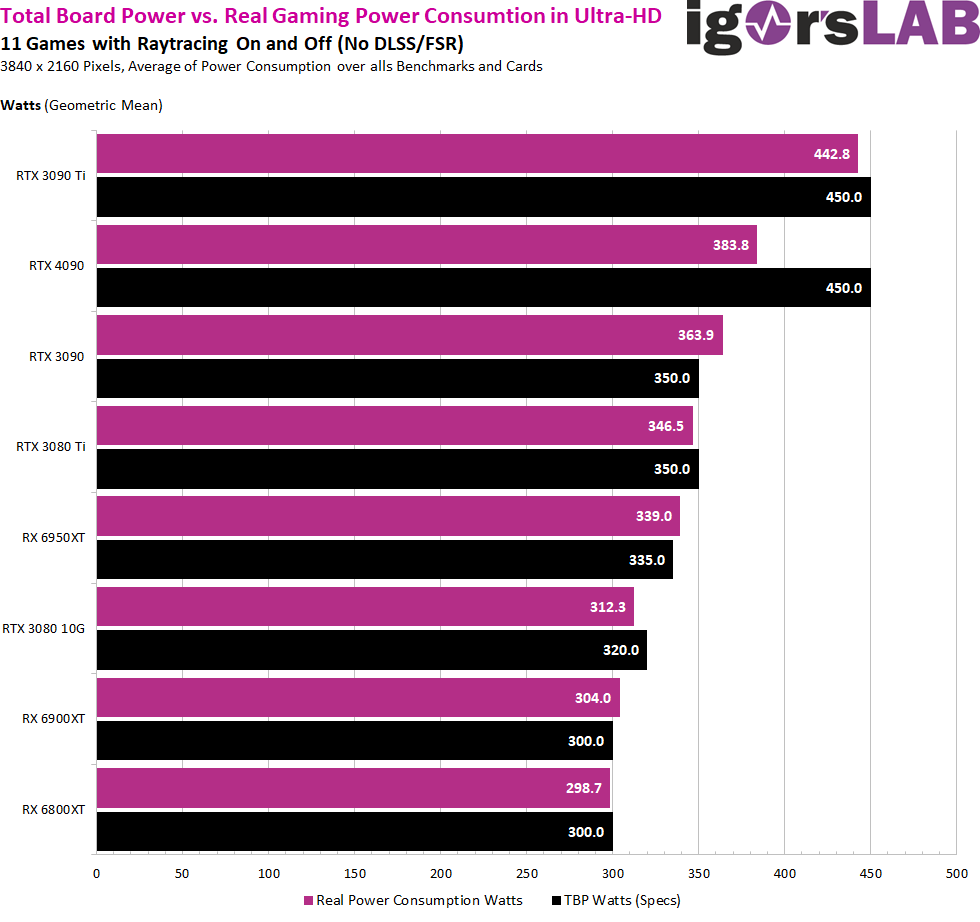
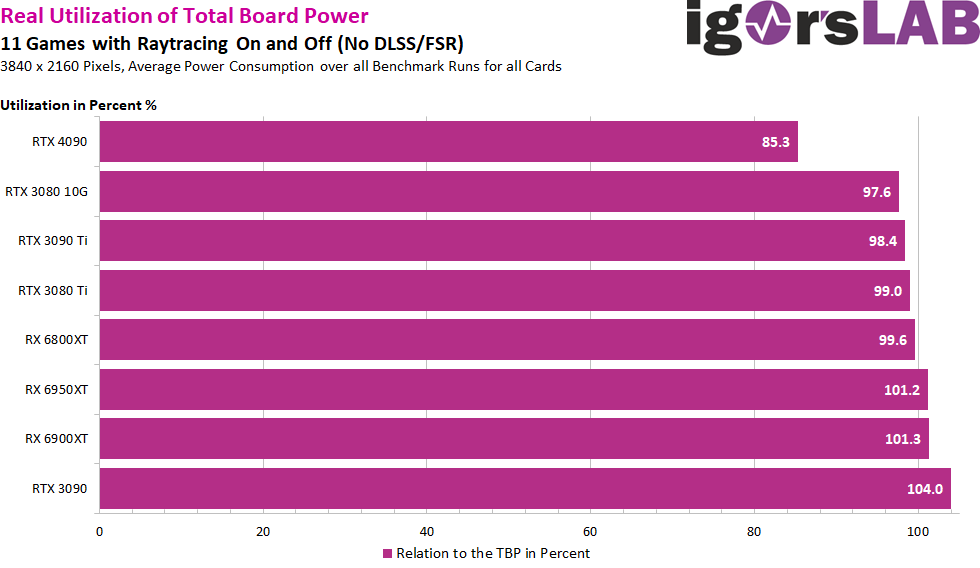
For all other cards, manufacturer claims and power consumption in UHD gaming are very close to or even slightly exceed the stated TBP with 98 to 99% GPU load (the last three cards in the charts below). But they are deviations in the low single-digit percentage range. For the not yet launched GeForce 4080 16GB, you can only pull out the calculator for NDA reasons and put TBP and the real measurement into relation. Then it would be 274 watts in gaming for this new card, which is specified with 320 watts. That won’t quite be enough, because the chip should clock higher due to the smaller size and shader count, making it a bit more inefficient. However, it could well be around 280 watts. Purely speculative.
Since AMD’s cards have always reached the specified TBP in ultra HD so far, one could certainly assume that it could also be the case for the Radeon 7900XTX or RX 7900XT. The only question is whether AMD has managed to achieve a similarly wide window in the actual power consumption. Because only then would the card be a match for the GeForce RTX 4080 at the socket in daily use. Here you will really have to look several times and more closely at how efficiently both opponents can really act.
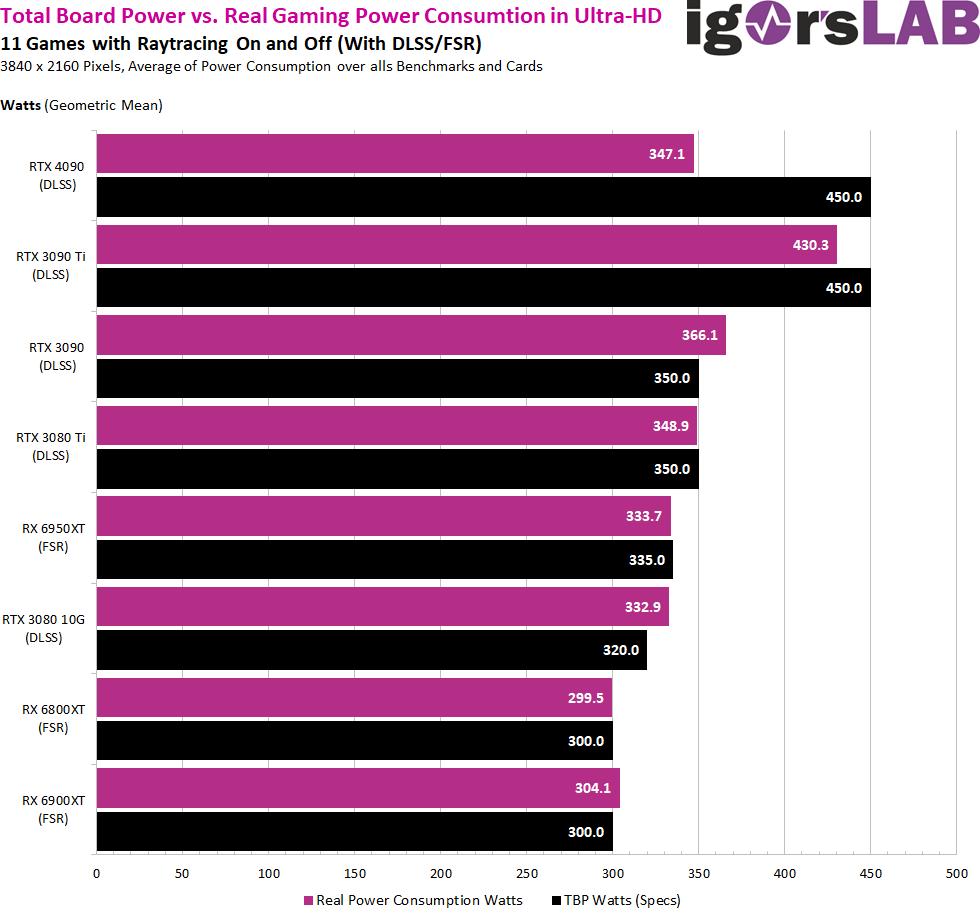
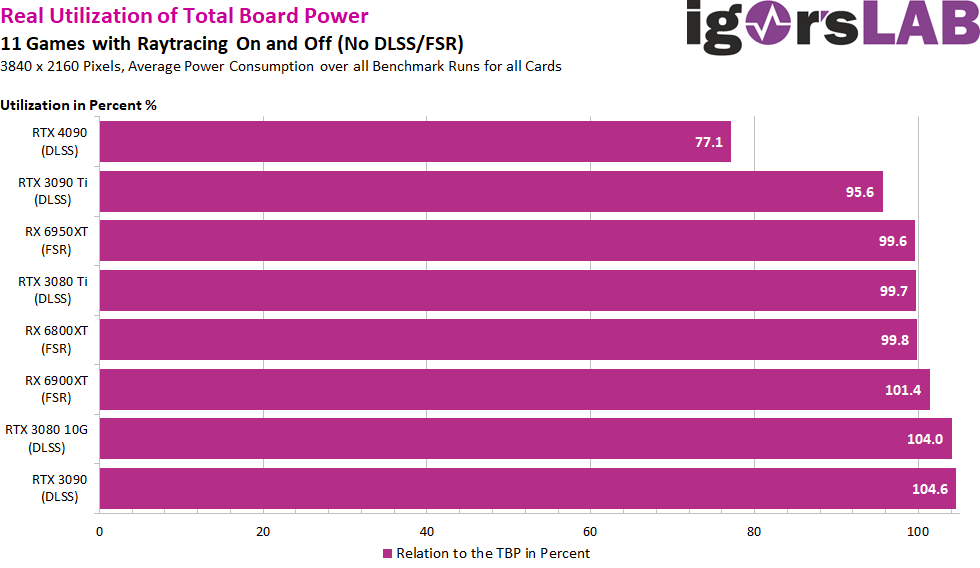
 With image acceleration methods like DLSS, FSR or XeSS, the 450 watt card in the form of the GeForce RTX 4090 turns into a 350 watt card (also referring to the average), while the GeForce RTX 3090 Ti cannot break away from the 400 watt zone. The other cards are again roughly on a par here. In addition, the large Ada card is of course already slowed down by the CPU from time to time. This is exactly the point where you can test the GeForce RTX 4080 16GB on launch day at the latest, because if you were to apply the factor that results for the RTX 4090 here. If it were a real, sole bottleneck for the RTX 4090, then the upcoming GeForce RTX 4080 16GB should only be affected very little and consume approximately what was measurable without DLSS again.
Once again, I determined the percentage ratio to the specified TBP for these measurements. That is really clear:
 Now that we’ve got that out of the way, we can move on to other things before the next big launch next week. If you want to question the difference between TBP, TGP and TDP again, I refer you to a further article, which is almost a classic, but still valid. And just by the way: there are many other load scenarios than games or stress tests. That’s just a side note, but you already know that from all my reviews.


657 Antworten
Kommentar
Lade neue Kommentare
Urgestein
1
Urgestein
Veteran
Mitglied
Veteran
Urgestein
Urgestein
Urgestein
1
Urgestein
1
Urgestein
Urgestein
Urgestein
Urgestein
Veteran
Urgestein
Urgestein
Alle Kommentare lesen unter igor´sLAB Community →