What actually happens when you let the two fastest CPUs compete with the GeForce RTX 3090 instead of the Radeon RX 6900XT? We noticed some amazing things and therefore we measured and cross-tested several times. The result is reproducible, but that does not make it any more comprehensible. But it at least explains why the power consumption measurement in our launch articles for Alder Lake S turned out so differently, because at least two factors come together.
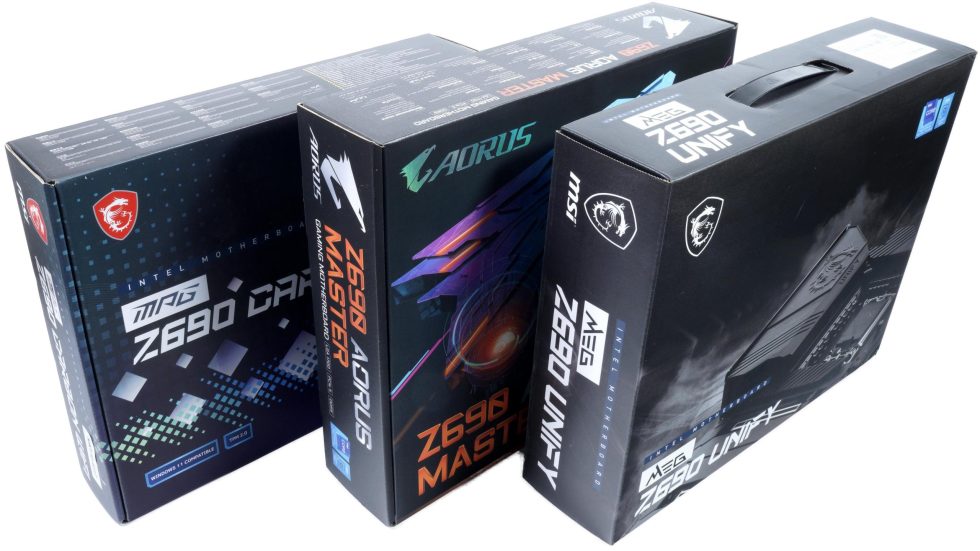
On the one hand, it was the different boards that led to very different power consumption values at CPU loads between 25 and 80 percent. Even an MSI MAG Z690 Carbon WiFi produced an average of 5 watts more power consumption across all games for the Core i9-12900KF in the Intel recommended setting with the PL1 at 241 watts, an Asus ROG Maximus Z690 Hero came in at 8 to 10 watts more and the Aorus Z590 Master was pretty much right in the middle. The gaming performance of all boards, however, was very similar and was de facto even within the tolerance range. However, even this maximum of 10 watts would still be less than the 20+ watt difference in places that resulted from my measurements compared to many other reviews. How come?
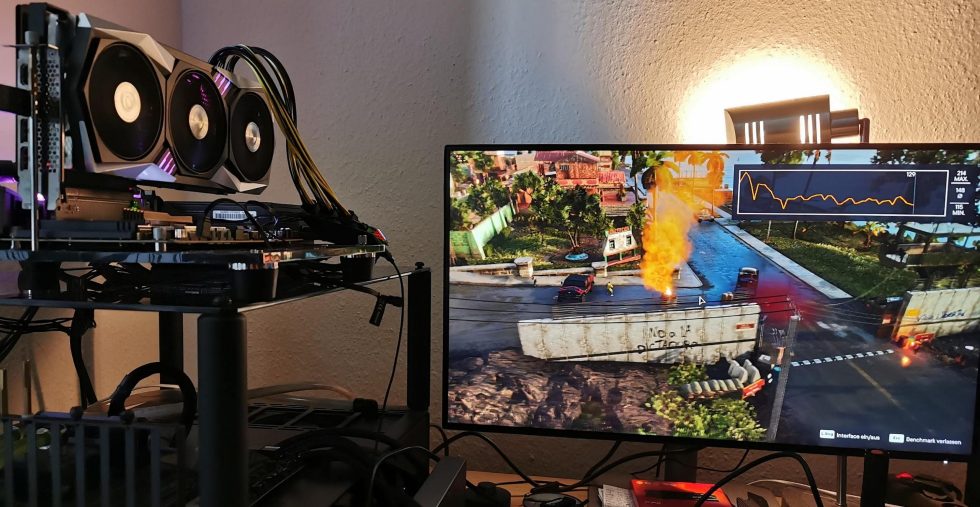
Besides the different motherboards, the only option left was to vary the graphics cards. Incidentally, the actual cause (and final impetus) was a cross-test with several motherboards and Xaver’s use of a GeForce RTX 3090 FE, which produced very similar FPS values to the Radeon RX 6900XT in Shadow of the Tomb Raider in 1080p, thus also allowing a comparison between the NVIDIA and AMD graphics cards. With a very astonishing result, which could be reproduced on several systems without any problems. Fortunately, the systems with both CPUs were still untouched in the office, so that a retest under really identical conditions was very easy.
Since the differences were greatest in 720p (1280 x 720 pixels), but this trend continued in the same way even if toned down in 1080p (1920 x 1080 pixels), I focused on the lowest resolution and re-measured everything with the two relevant CPUs, using the GeForce RTX 3090 FE of course. I’ll be contrasting performance in each game again in the next few pages, as well as power consumption and efficiency, because these metrics really deserve attention,
Regarding the last page I can already briefly spoil that I can certainly also plausibly explain the difference in the power consumption values in the sum of all influences. However, I have included the possible conclusions and causes on all pages, so it is really worth reading the complete article to the end. So first page and last page does not work. The truth lies, as always actually, also and above all in between. I have quickly summarized the individual components of the test system in a table as a reminder:
| Test System and Equipment |
|
|---|---|
| Hardware: |
Intel LGA 1700 Intel LGA 1200 AMD AM4 MSI Radeon RX 6900XT Gaming X OC 1x 2 TB MSI Spatium M480 |
| Cooling: |
Aqua Computer Cuplex Kryos Next, Custom LGA 1200/1700 Backplate (hand-made) Custom Loop Water Cooling / Chiller Alphacool Subzero |
| Case: |
Raijintek Paean |
| Monitor: | LG OLED55 G19LA |
| Power Consumption: |
Oscilloscope-based system: Non-contact direct current measurement on PCIe slot (riser card) Non-contact direct current measurement at the external PCIe power supply Direct voltage measurement at the respective connectors and at the power supply unit 2x Rohde & Schwarz HMO 3054, 500 MHz multichannel oscilloscope with memory function 4x Rohde & Schwarz HZO50, current clamp adapter (1 mA to 30 A, 100 KHz, DC) 4x Rohde & Schwarz HZ355, probe (10:1, 500 MHz) 1x Rohde & Schwarz HMC 8012, HiRes digital multimeter with memory function MCU-based shunt measuring (own build, Powenetics software) |
| Thermal Imager: |
1x Optris PI640 + 2x Xi400 Thermal Imagers Pix Connect Software Type K Class 1 thermal sensors (up to 4 channels) |
| Acoustics: |
NTI Audio M2211 (with calibration file) Steinberg UR12 (with phantom power for the microphones) Creative X7, Smaart v.7 Own anechoic chamber, 3.5 x 1.8 x 2.2 m (LxTxH) Axial measurements, perpendicular to the centre of the sound source(s), measuring distance 50 cm Noise emission in dBA (slow) as RTA measurement Frequency spectrum as graphic |
| OS: | Windows 11 Pro (all updates/patches, current certified or press VGA drivers) |


82 Antworten
Kommentar
Lade neue Kommentare
Mitglied
Urgestein
Veteran
1
1
Veteran
Urgestein
Mitglied
Mitglied
Veteran
Veteran
Urgestein
Urgestein
Mitglied
Veteran
1
Urgestein
1
Mitglied
Alle Kommentare lesen unter igor´sLAB Community →