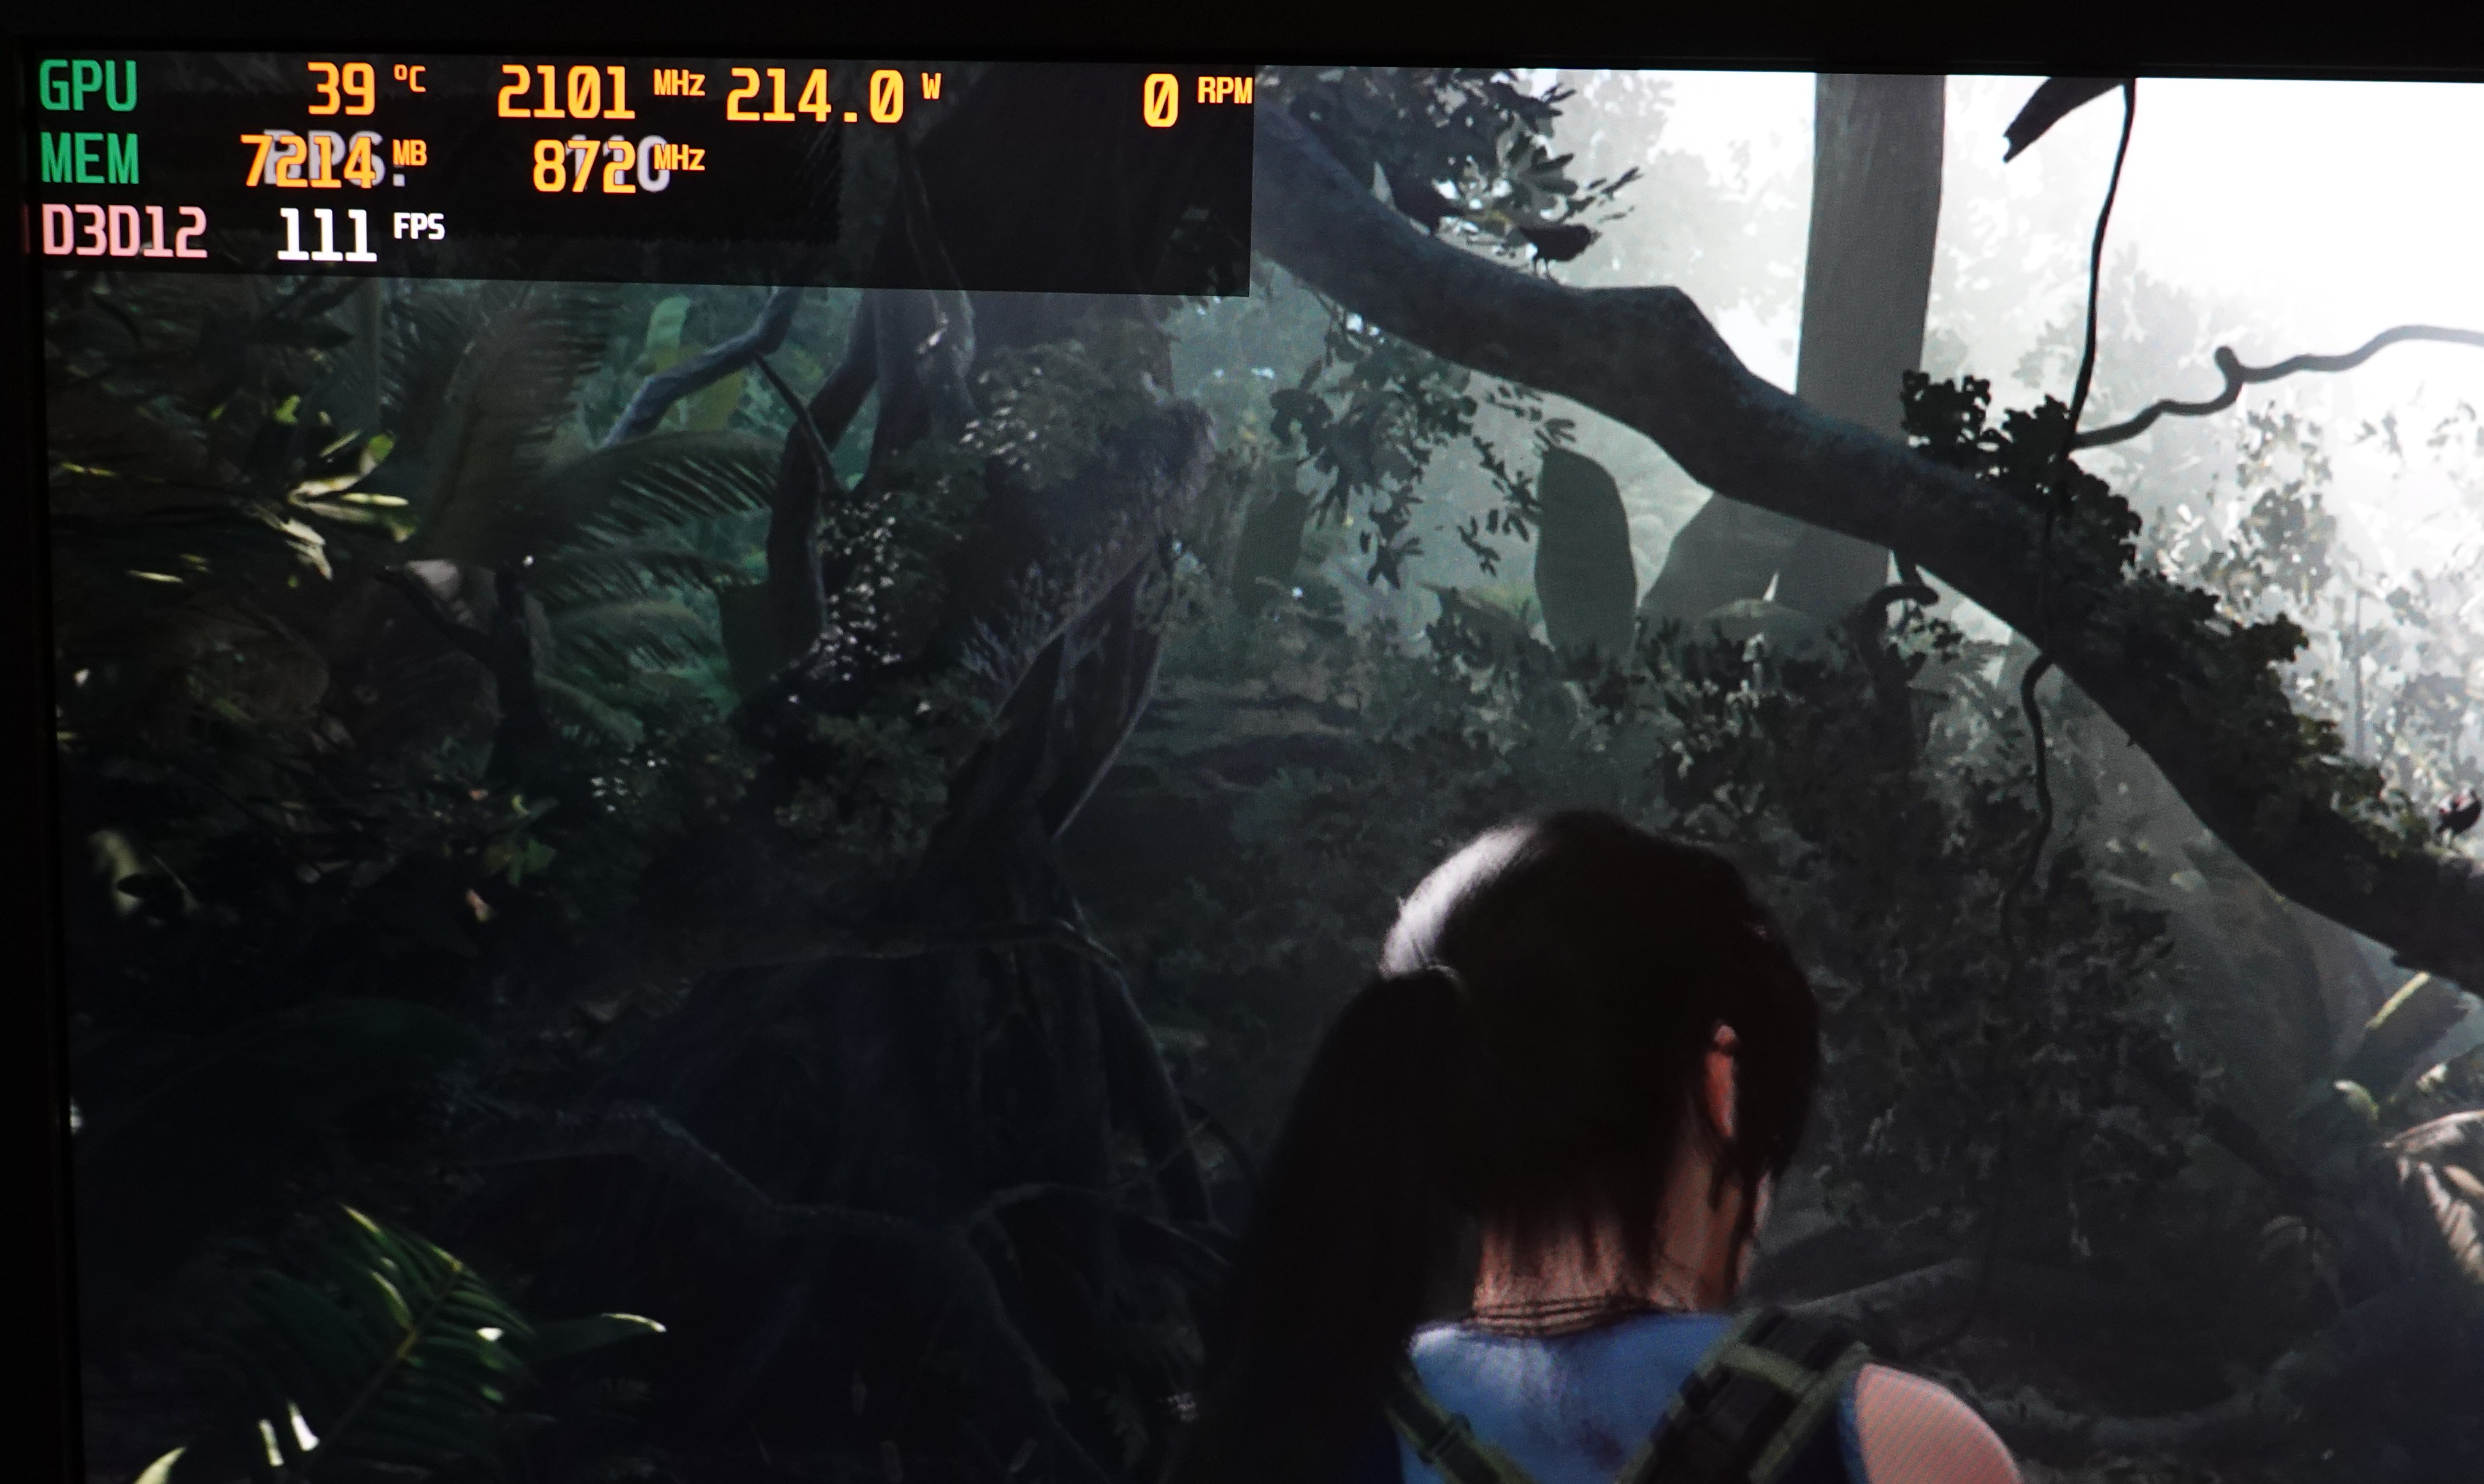
The system goes underwater and goes into operation. Since the entire measurements are very expensive (long-term measurement of power consumption, infrared, benchmarks) I focused on a game that yielded a good average in the Sunday launch review: Shadow of the Tomb Raider. And because I also want to be fair, I have given and measured a new GeForce RTX 2070 Super in the same situations.
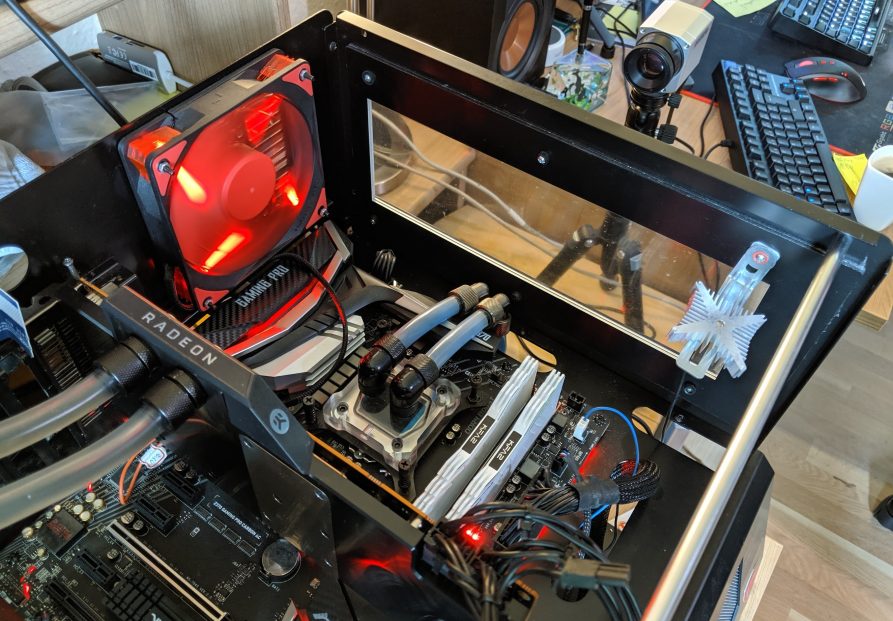
In the tips, the card even runs above 2.1 GHz and it is simply a question of the supplied electrical power in the end. But i come to that. First of all, it's all about the pure gaming performance between the stock card and the overclocked card with and without an extended power limit. And that's nice compared to the benchmark results of the other maps from the launch review.
Unfortunately, nothing went with WattMan, and so I used the MSI Afterburner. There I set the Radeon to the maximum possible value of 2150 MHz (the RX 57000 is limited to a meagre 1850 MHz) and measured twice. Once with the normal power limit ex works and once with the maximum possible value of 50% (RX 5700 only 20%).

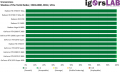
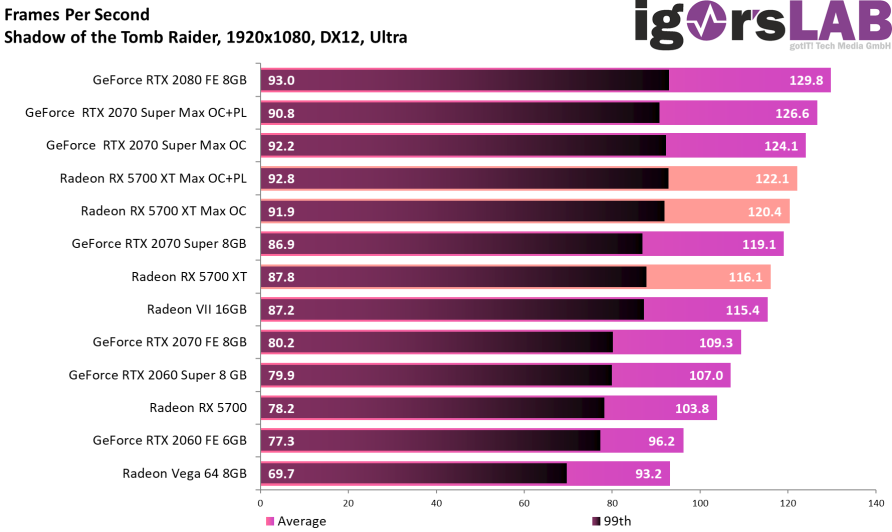
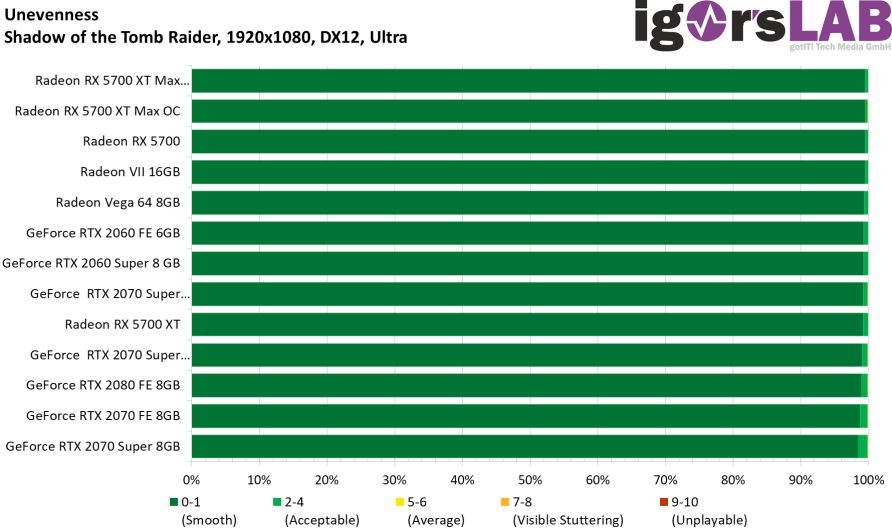
If you compare the bars now, you can see very nicely that the overclocked RX 5700 XT is faster than the GeForce RTX 2070 in factory condition. However, this can also pass by with enough OC. However, one circumstance is already remarkable, because if you set the Power Target to the maximum power limit with the GeForce RTX 2070, then the percentiles will get worse (and thus also the proportion of bad frames in the overall result). For whatever reason, it was reproducible.
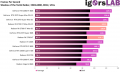
Shadow of the Tomb Raider - FPS - 1920x1080 DX12, Ultra
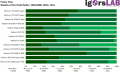
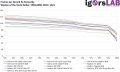
Shadow of the Tomb Raider - FrameTime - 1920x1080 DX12, Ultra
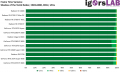
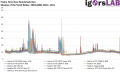
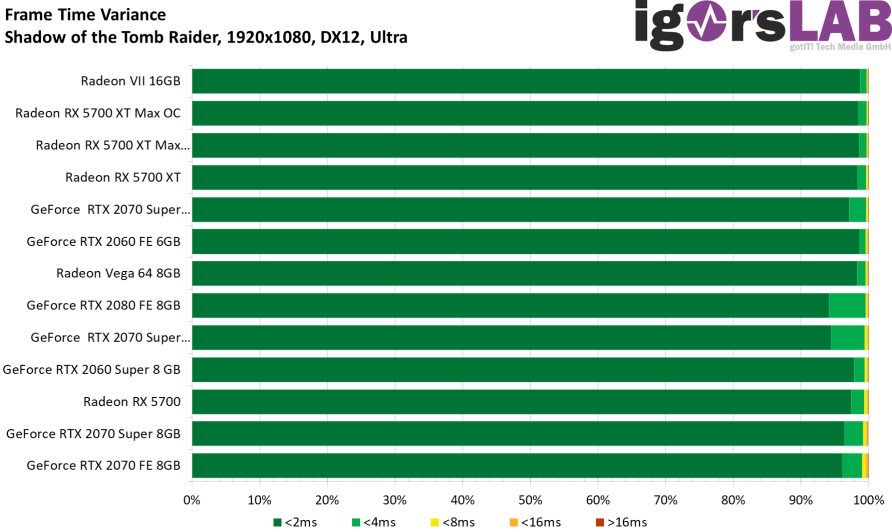
Shadow of the Tomb Raider - FrameTimeVariance - 1920x1080 DX12, Ultra
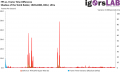
Shadow of the Tomb Raider - Unevenness - 1920x1080 DX12, Ultra
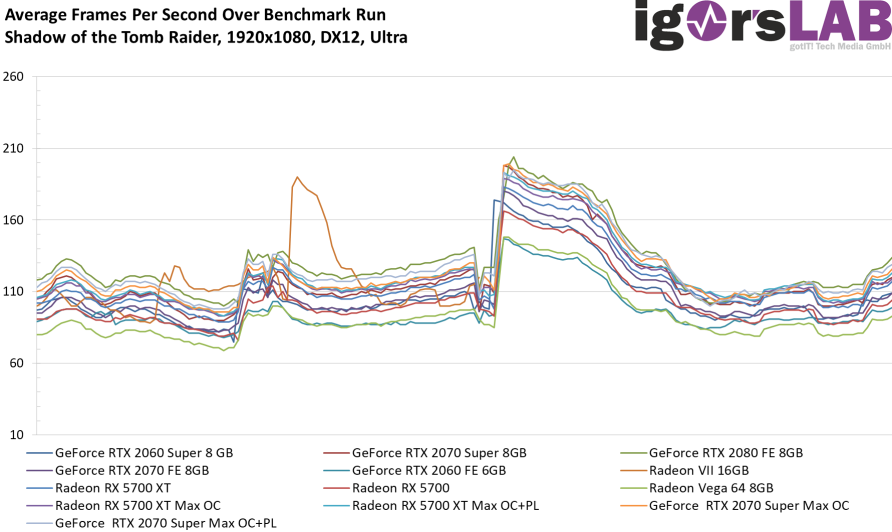
The curves show the same image, only in a different representation.

Shadow of the Tomb Raider - AvFPSoB - 1920x1080 DX12, Ultra
Shadow of the Tomb Raider - FPS99th - 1920x1080 DX12, Ultra
Shadow of the Tomb Raider - FrameTimeoB - 1920x1080 DX12, Ultra
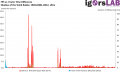
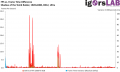
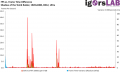
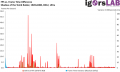
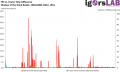
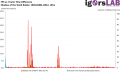
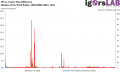
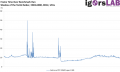
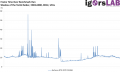
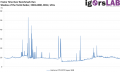
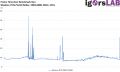
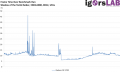
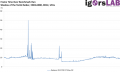
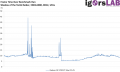
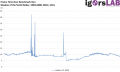
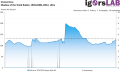
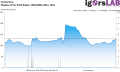
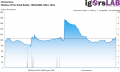
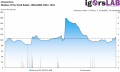
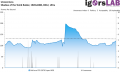
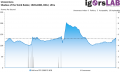
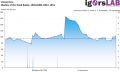
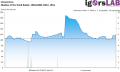
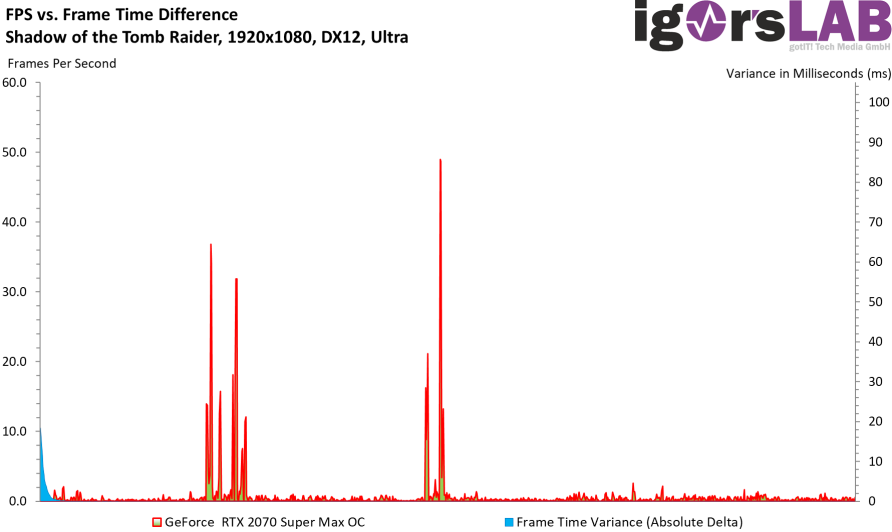
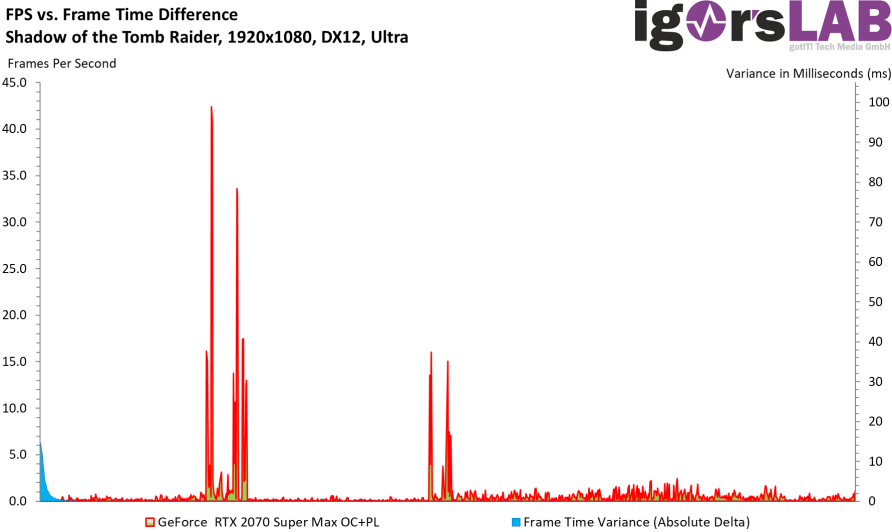
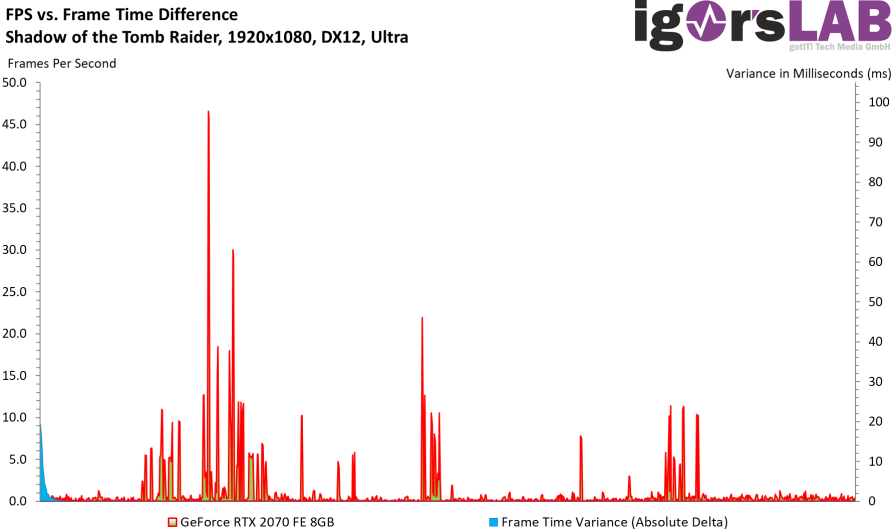
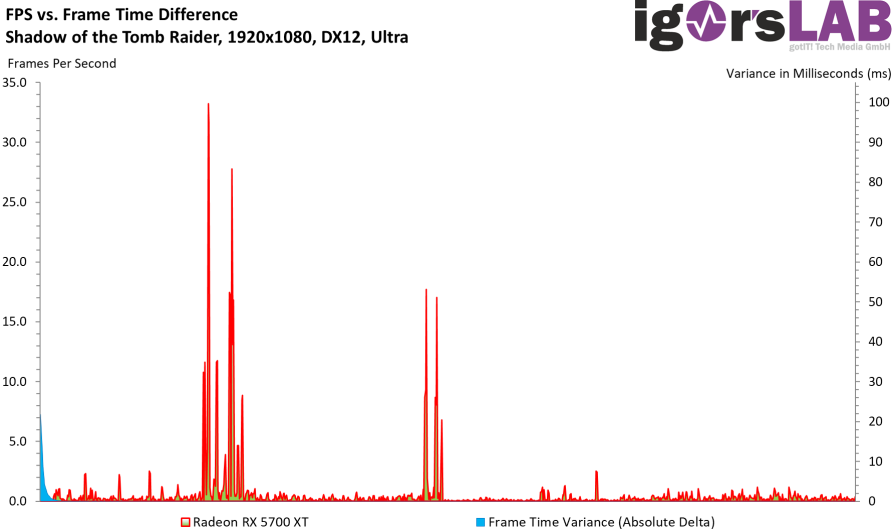
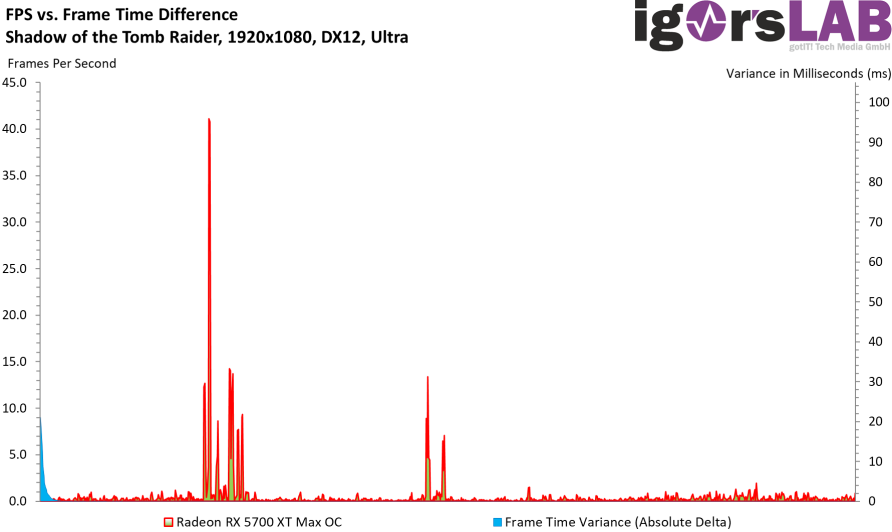
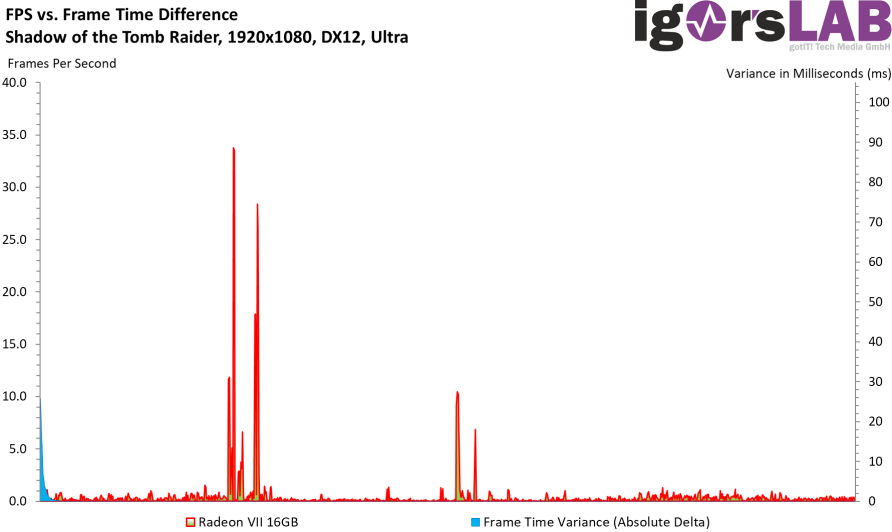
Let's move on to the much clearer individual graphics for each of the tested graphics cards. The variances first give a good indication of the rendering times of successive frames and show all unrounded transitions well. Too large values represent jerkers and an unrounded course
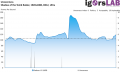
Shadow of the Tomb Raider - GeForce RTX 2070 Super Max OC - FPSvsFrameTimeDiff - 1920x1080 DX12, Ultra
Shadow of the Tomb Raider - GeForce RTX 2070 Super Max OC+PL - FPSvsFrameTimeDiff - 1920x1080 DX12, Ultra
Shadow of the Tomb Raider - GeForce RTX 2060 FE 6GB - FPSvsFrameTimeDiff - 1920x1080 DX12, Ultra
Shadow of the Tomb Raider - GeForce RTX 2060 Super 8 GB - FPSvsFrameTimeDiff - 1920x1080 DX12, Ultra
Shadow of the Tomb Raider - GeForce RTX 2070 FE 8GB - FPSvsFrameTimeDiff - 1920x1080 DX12, Ultra
Shadow of the Tomb Raider - GeForce RTX 2070 Super 8GB - FPSvsFrameTimeDiff - 1920x1080 DX12, Ultra
Shadow of the Tomb Raider - GeForce RTX 2080 FE 8GB - FPSvsFrameTimeDiff - 1920x1080 DX12, Ultra
Shadow of the Tomb Raider - Radeon RX 5700 - FPSvsFrameTimeDiff - 1920x1080 DX12, Ultra

Shadow of the Tomb Raider - Radeon RX 5700 XT - FPSvsFrameTimeDiff - 1920x1080 DX12, Ultra
Shadow of the Tomb Raider - Radeon RX 5700 XT Max OC - FPSvsFrameTimeDiff - 1920x1080 DX12, Ultra
Shadow of the Tomb Raider - Radeon RX 5700 XT Max OC+PL - FPSvsFrameTimeDiff - 1920x1080 DX12, Ultra
Shadow of the Tomb Raider - Radeon Vega 64 8GB - FPSvsFrameTimeDiff - 1920x1080 DX12, Ultra
Shadow of the Tomb Raider - Radeon VII 16GB - FPSvsFrameTimeDiff - 1920x1080 DX12, Ultra
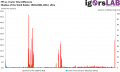
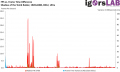
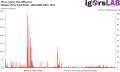
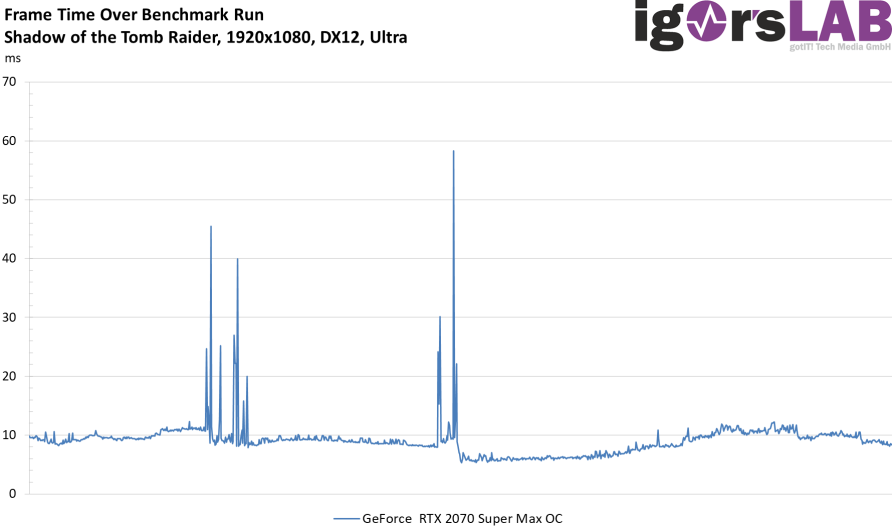
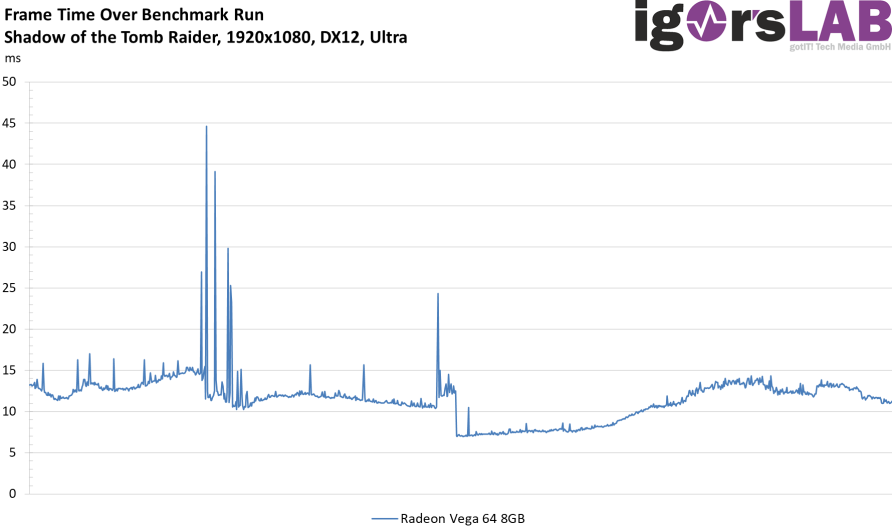
The frametimes are the best indicator of the overall rendering speed of each frame:
Shadow of the Tomb Raider - GeForce RTX 2070 Super Max OC - FrameTimeSolo - 1920x1080 DX12, Ultra

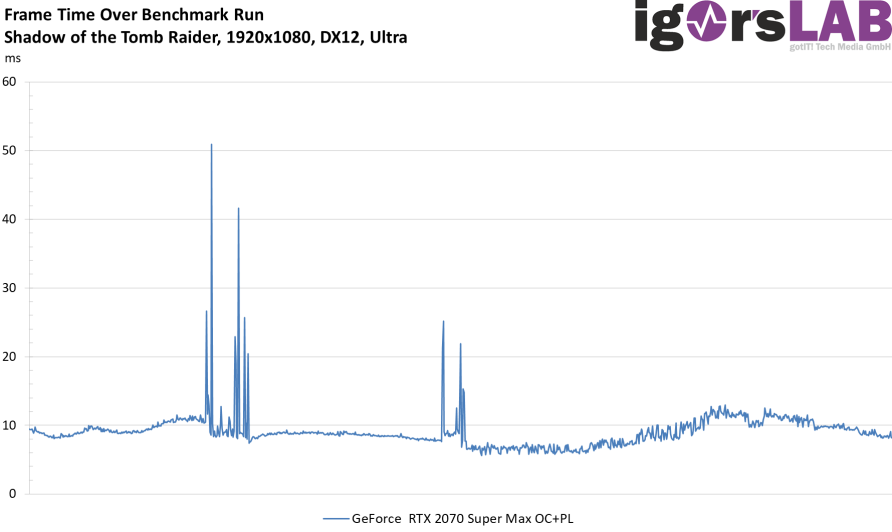
Shadow of the Tomb Raider - GeForce RTX 2070 Super Max OC+PL - FrameTimeSolo - 1920x1080 DX12, Ultra

Shadow of the Tomb Raider - GeForce RTX 2060 FE 6GB - FrameTimeSolo - 1920x1080 DX12, Ultra
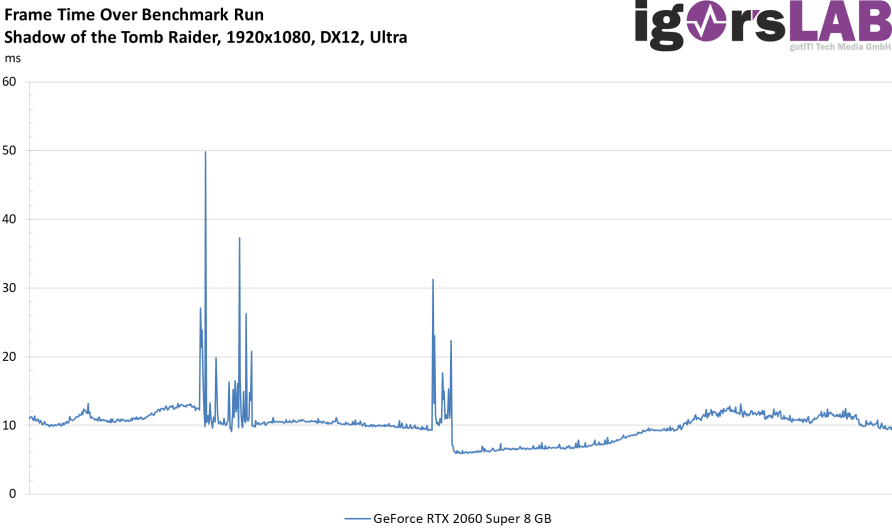
Shadow of the Tomb Raider - GeForce RTX 2060 Super 8 GB - FrameTimeSolo - 1920x1080 DX12, Ultra
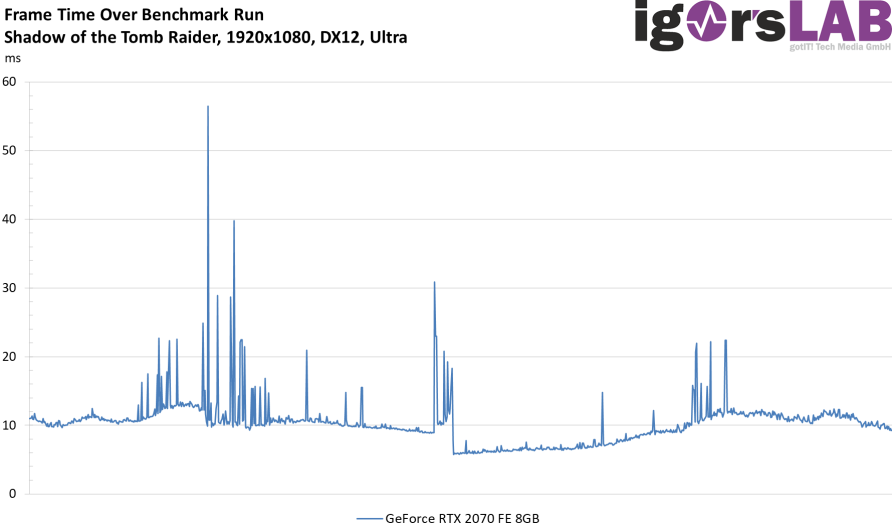
Shadow of the Tomb Raider - GeForce RTX 2070 FE 8GB - FrameTimeSolo - 1920x1080 DX12, Ultra
Shadow of the Tomb Raider - GeForce RTX 2070 Super 8GB - FrameTimeSolo - 1920x1080 DX12, Ultra
Shadow of the Tomb Raider - GeForce RTX 2080 FE 8GB - FrameTimeSolo - 1920x1080 DX12, Ultra
Shadow of the Tomb Raider - Radeon RX 5700 - FrameTimeSolo - 1920x1080 DX12, Ultra

Shadow of the Tomb Raider - Radeon RX 5700 XT - FrameTimeSolo - 1920x1080 DX12, Ultra
Shadow of the Tomb Raider - Radeon RX 5700 XT Max OC - FrameTimeSolo - 1920x1080 DX12, Ultra
Shadow of the Tomb Raider - Radeon RX 5700 XT Max OC+PL - FrameTimeSolo - 1920x1080 DX12, Ultra

Shadow of the Tomb Raider - Radeon Vega 64 8GB - FrameTimeSolo - 1920x1080 DX12, Ultra
Shadow of the Tomb Raider - Radeon VII 16GB - FrameTimeSolo - 1920x1080 DX12, Ultra
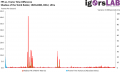
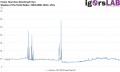
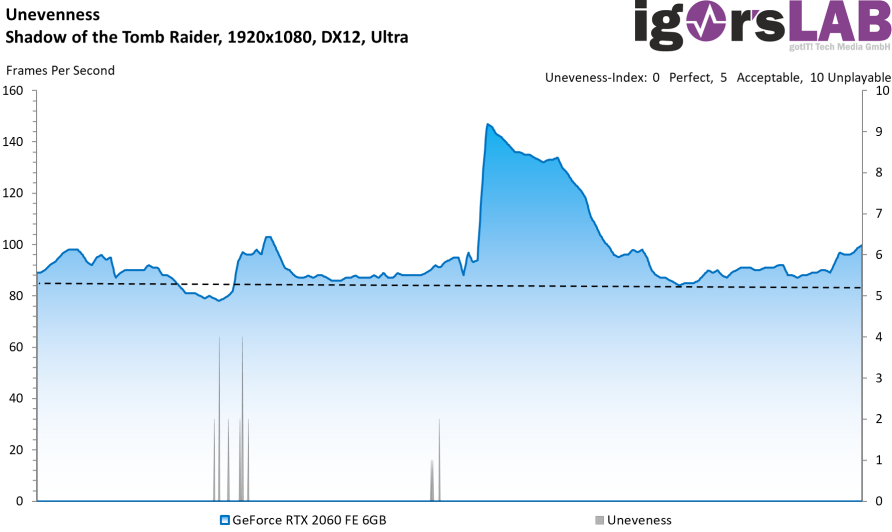
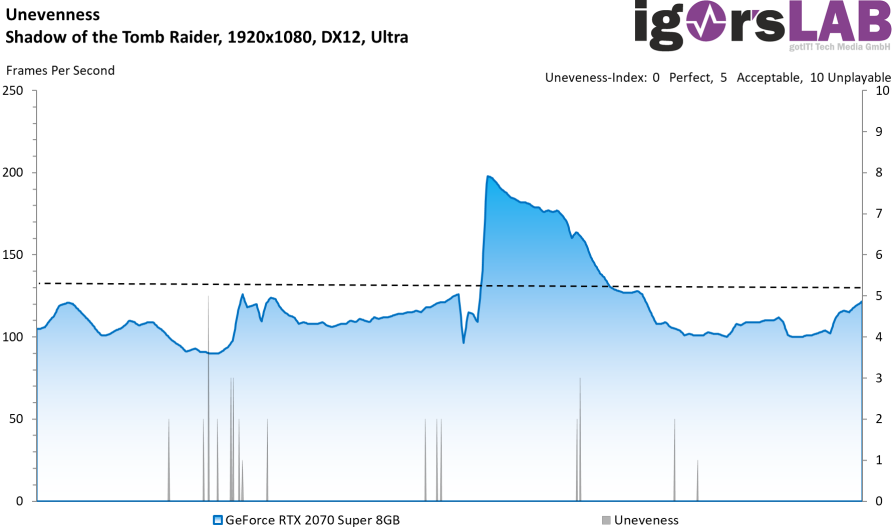
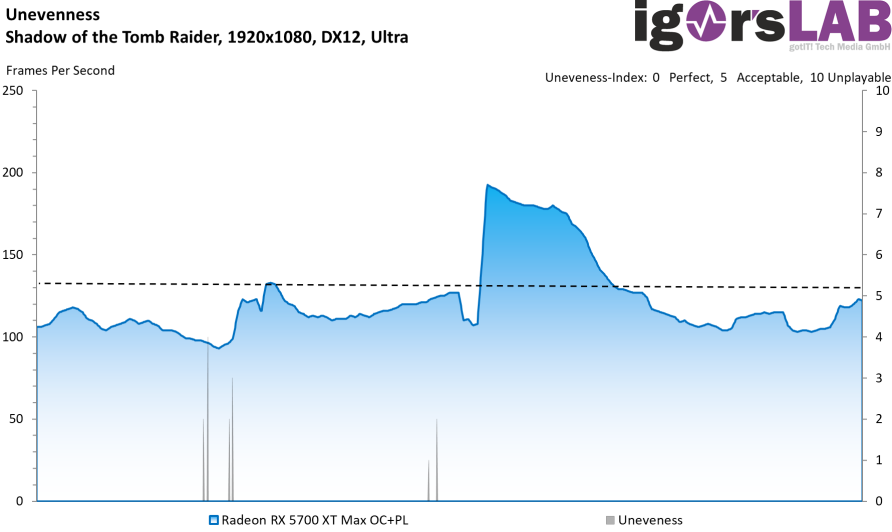
And the Unevenness index relies on a lot of statistics to represent immersion as real as possible.
Shadow of the Tomb Raider - GeForce RTX 2070 Super Max OC - Unevenness - 1920x1080 DX12, Ultra
Shadow of the Tomb Raider - GeForce RTX 2070 Super Max OC+PL - Unevenness - 1920x1080 DX12, Ultra

Shadow of the Tomb Raider - GeForce RTX 2060 FE 6GB - Unevenness - 1920x1080 DX12, Ultra
Shadow of the Tomb Raider - GeForce RTX 2060 Super 8 GB - Unevenness - 1920x1080 DX12, Ultra
Shadow of the Tomb Raider - GeForce RTX 2070 FE 8GB - Unevenness - 1920x1080 DX12, Ultra
Shadow of the Tomb Raider - GeForce RTX 2070 Super 8GB - Unevenness - 1920x1080 DX12, Ultra
Shadow of the Tomb Raider - GeForce RTX 2080 FE 8GB - Unevenness - 1920x1080 DX12, Ultra
Shadow of the Tomb Raider - Radeon RX 5700 - Unevenness - 1920x1080 DX12, Ultra

Shadow of the Tomb Raider - Radeon RX 5700 XT - Unevenness - 1920x1080 DX12, Ultra
Shadow of the Tomb Raider - Radeon RX 5700 XT Max OC - Unevenness - 1920x1080 DX12, Ultra

Shadow of the Tomb Raider - Radeon RX 5700 XT Max OC+PL - Unevenness - 1920x1080 DX12, Ultra

Shadow of the Tomb Raider - Radeon Vega 64 8GB - Unevenness - 1920x1080 DX12, Ultra
Shadow of the Tomb Raider - Radeon VII 16GB - Unevenness - 1920x1080 DX12, Ultra
So the whole thing doesn't even turn out badly, but of course you always have to keep an eye on how much energy you can ultimately get with such results. Because at AMD the crowbar has always been the best companion for a long time. And this time? The answer is now one page on!


Kommentieren