Comparison with 10 graphics cards in comparison
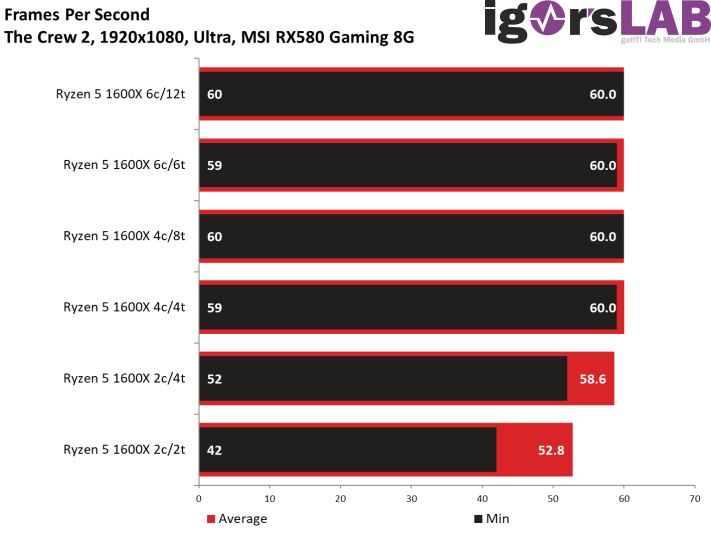
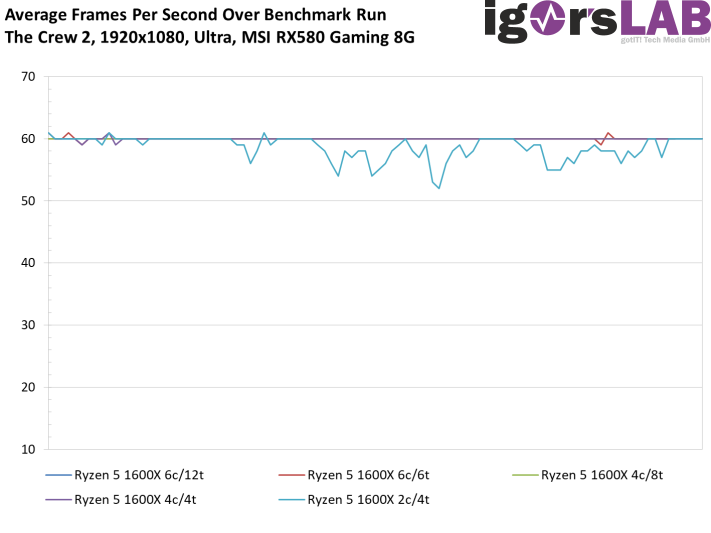
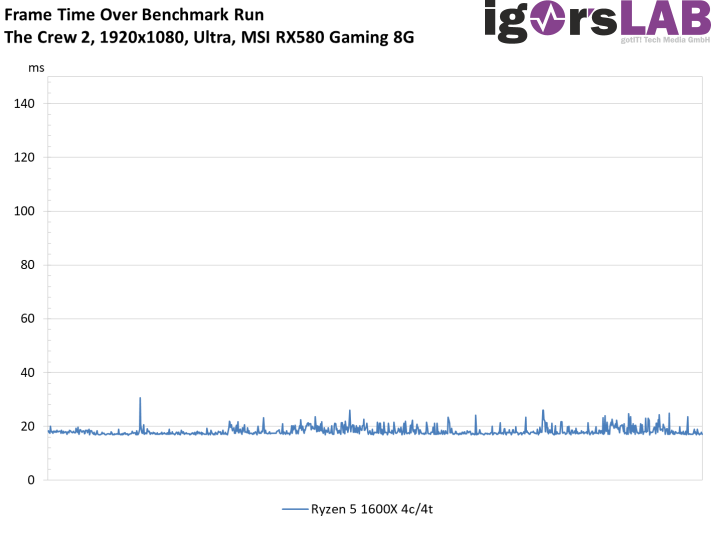
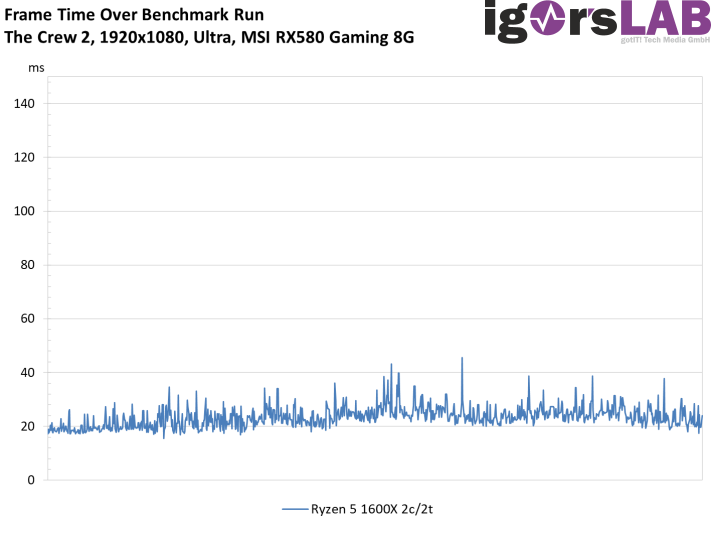
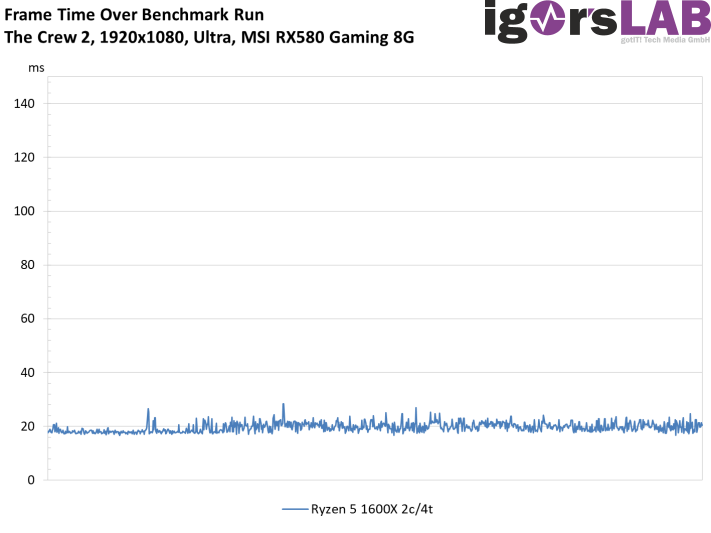
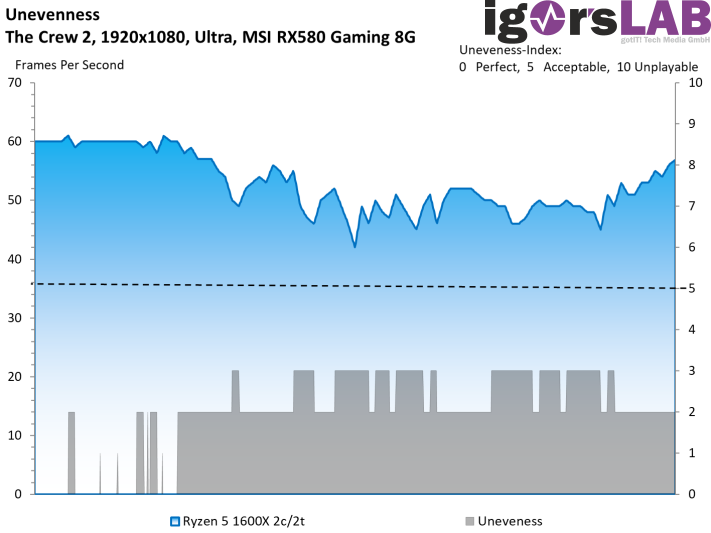
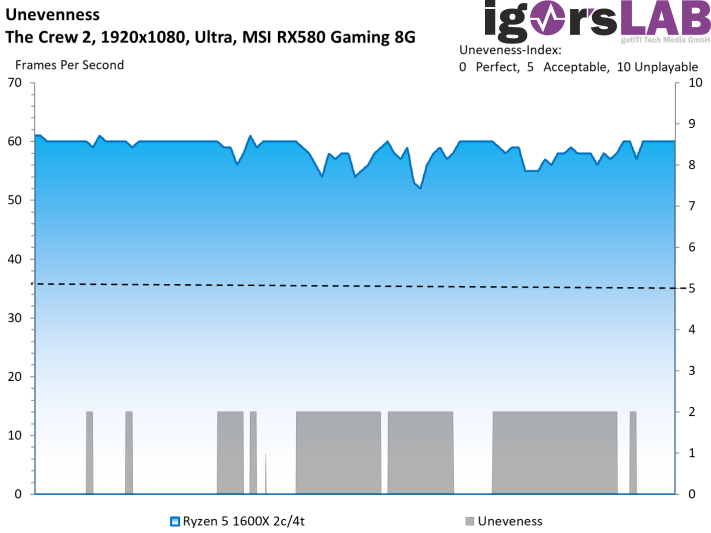
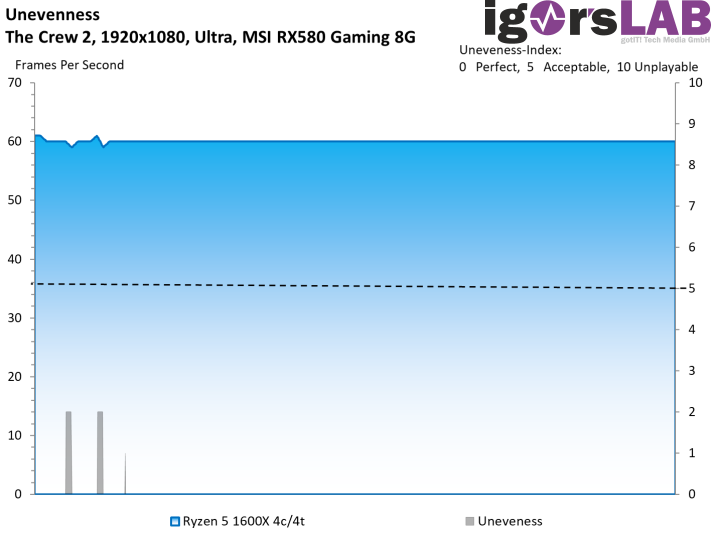
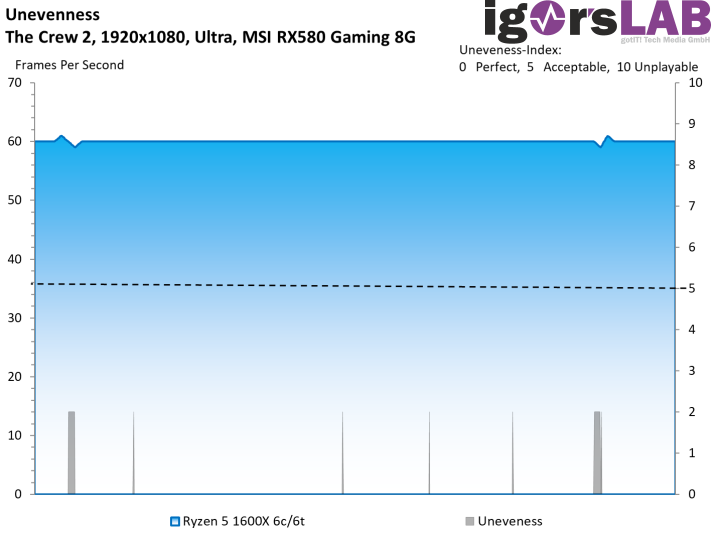
Now take the Radeon RX 580 with a Ryzen 5 1600X and put a solid mid-range setup on its feet! First of all, we see that the number of threads is slightly decisive, whereby the card from four cores runs constantly into the limiter, but the Min-FPS are already different. Only from two physical cores or four threads the vehicle then breaks down more clearly.
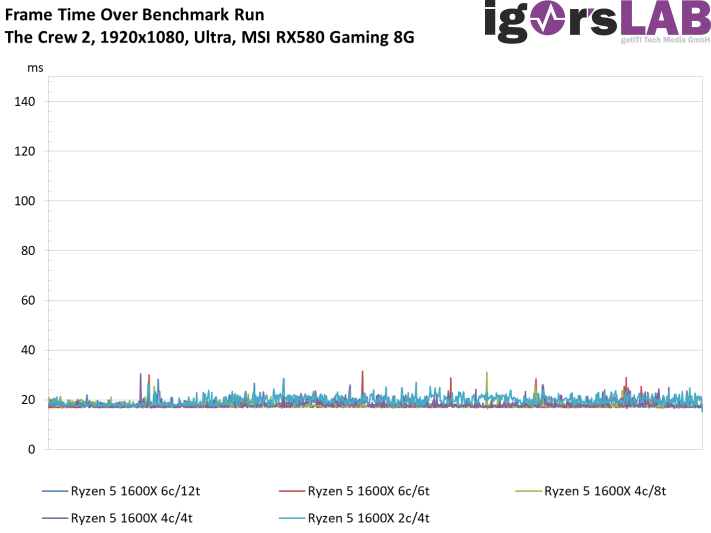
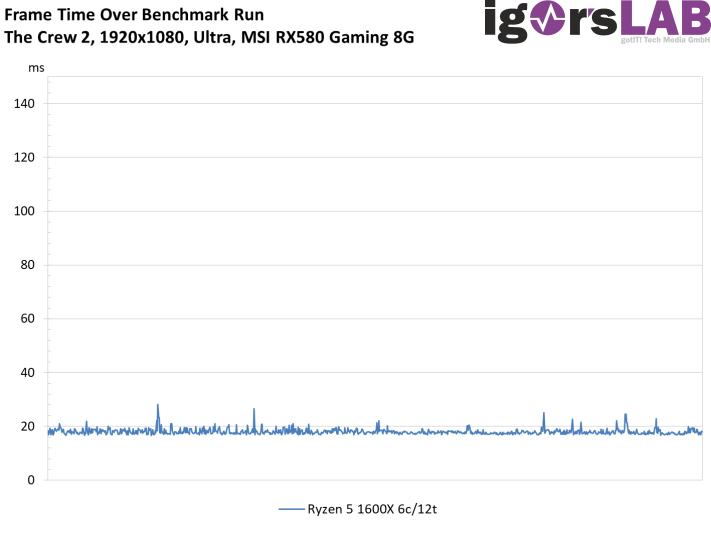
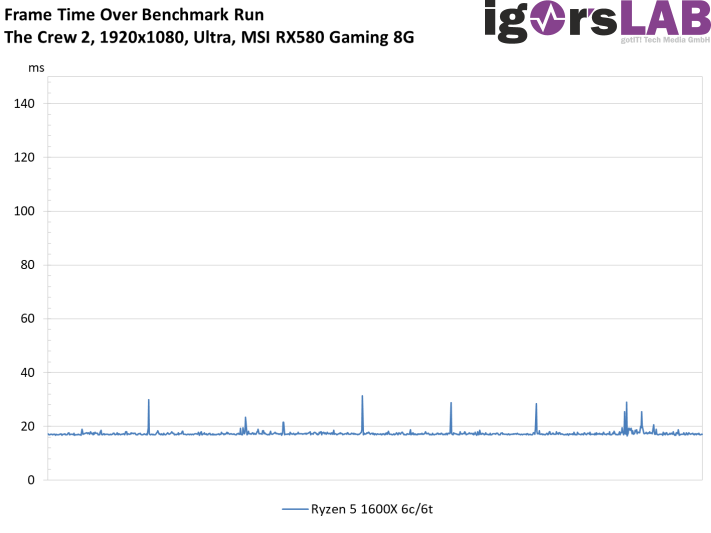
We also have the best five settings as frame-time history in curves:
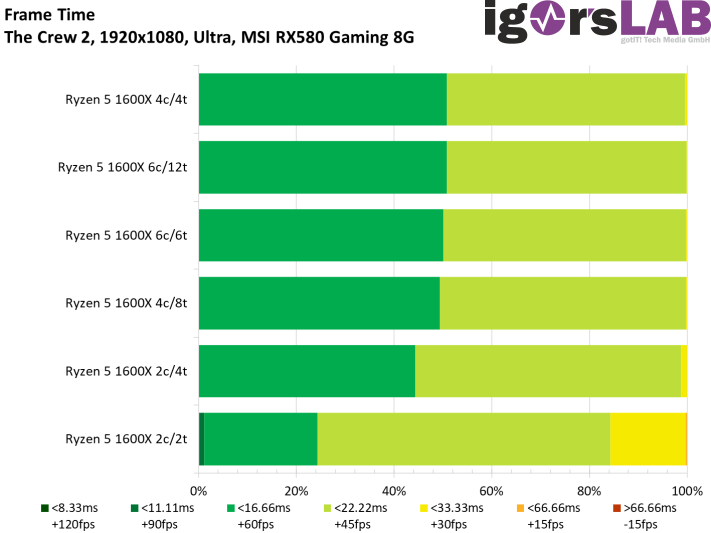
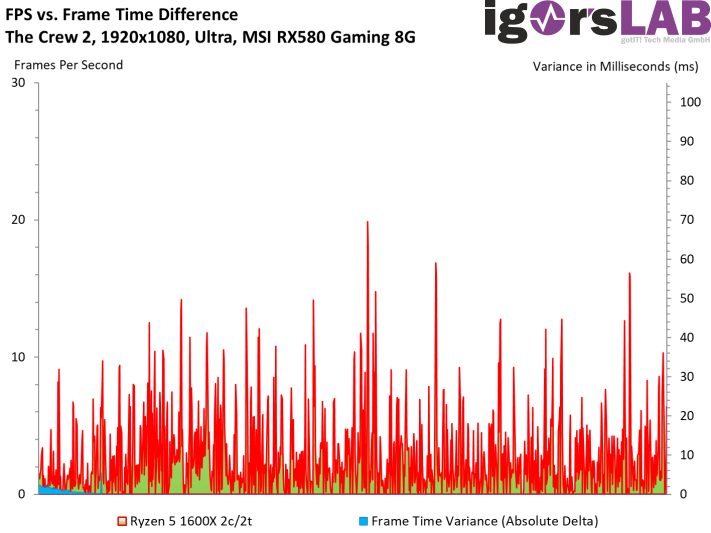
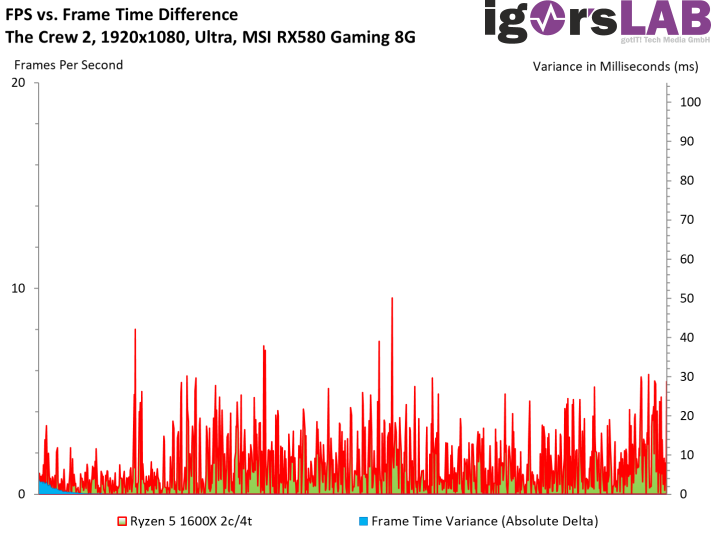
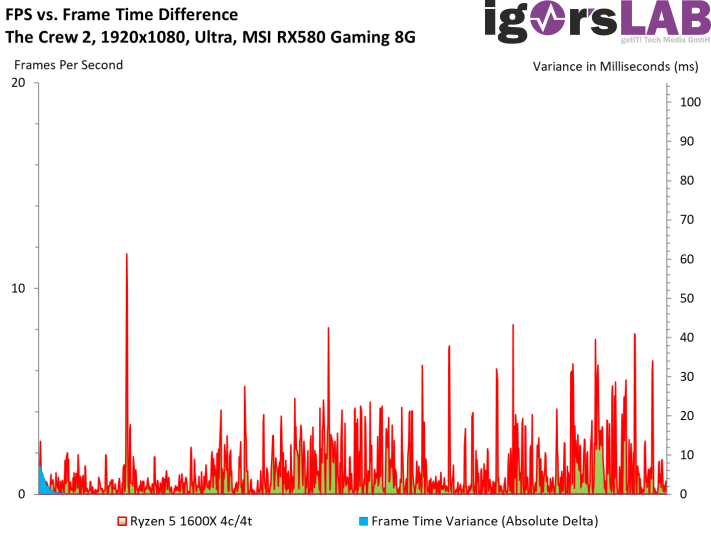
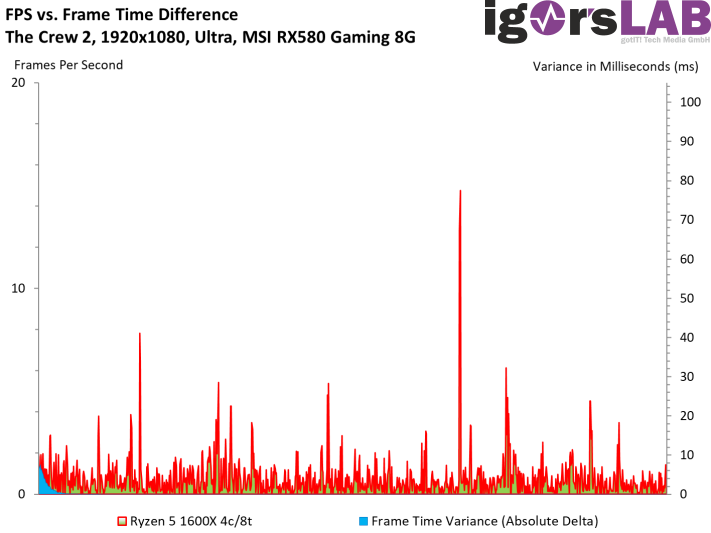
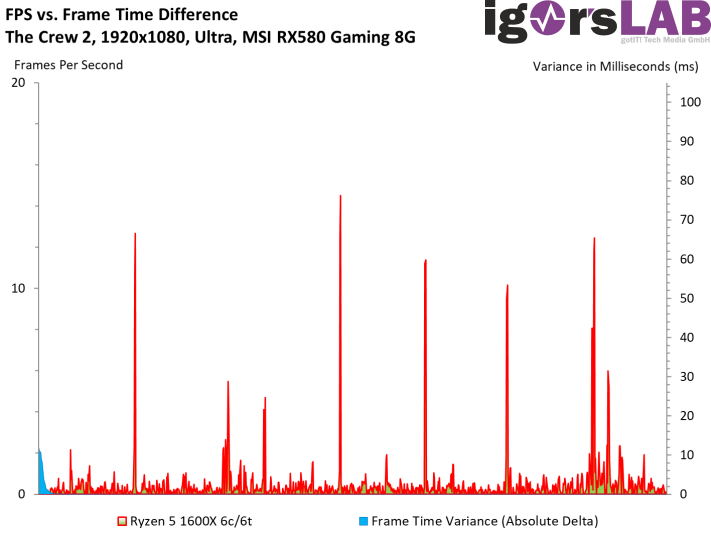
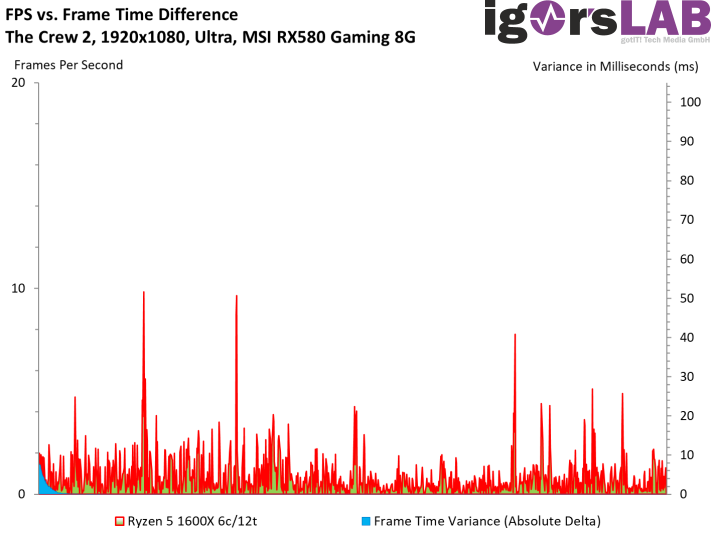
But even this point can be looked at in a more nuanced way if we look down from the rather coarse FPS as the average value of all frames within this respective second to the real frame times, which, as always, from a low-level measurement Come:
Let's look again at the five selected cards in ultra-setting:
However, the variances now push the cards into a slightly different order and the cleanest is 6 cores without SMT.
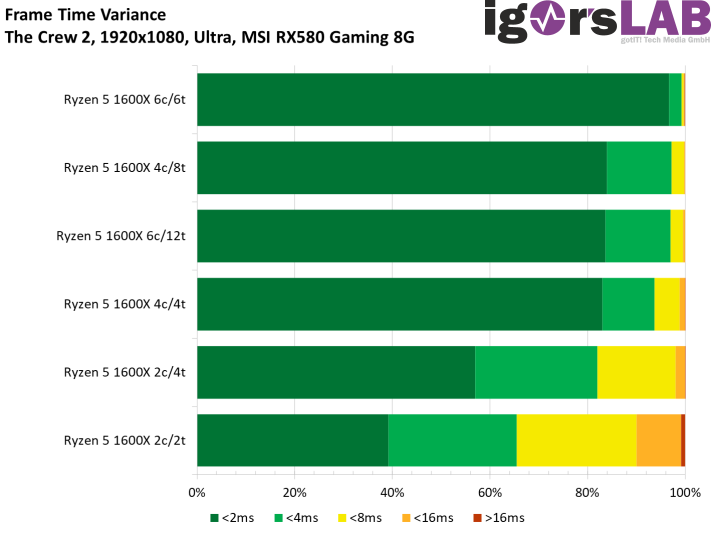
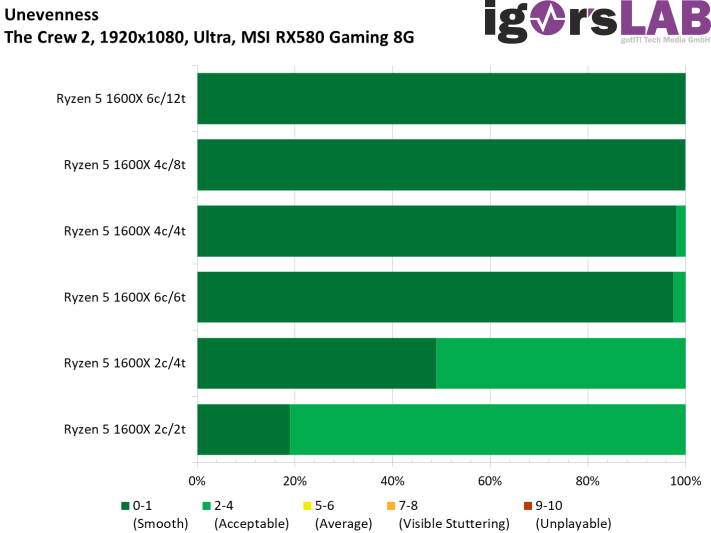
With the Unevenness index, i.e. our index for "soft" playability, they are then "dualcores" the absolute bottom, where by SMT can help something out of the misery. Without it it gets dark.
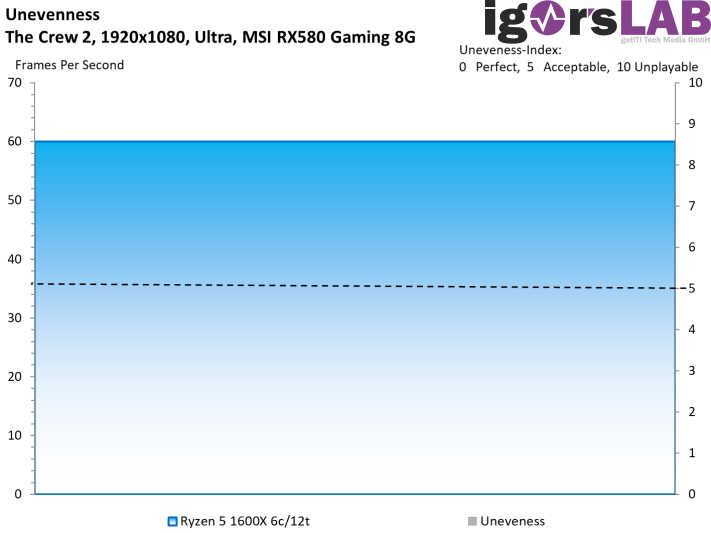
Individual results of the tested maps
We introduced this single list a long time ago at the request of our readers and we will of course not deprive anyone of this detailed documentation in this article. In the following image galleries, frame times, the variances and of course the Unevenness index are listed in detail for all ten maps tested.


- 1 - Einführung und Testsystem
- 2 - Gaming-Performance in FHD mit 1920 x 1080 Pixeln
- 3 - Gaming-Performance in WQHD mit 2560 x 1440 Pixeln
- 4 - Gaming-Performance in UHD mit 3840 x 2160 Pixeln
- 5 - Skalierung über Kerne und Threads
- 6 - CPU-Auslastung, Grafik- und Arbeitsspeicherbelegung in Full-HD (1080p)
- 7 - CPU-Auslastung, Grafik- und Arbeitsspeicherbelegung in WQHD (1440p)
- 8 - Zusammenfassung und Fazit