


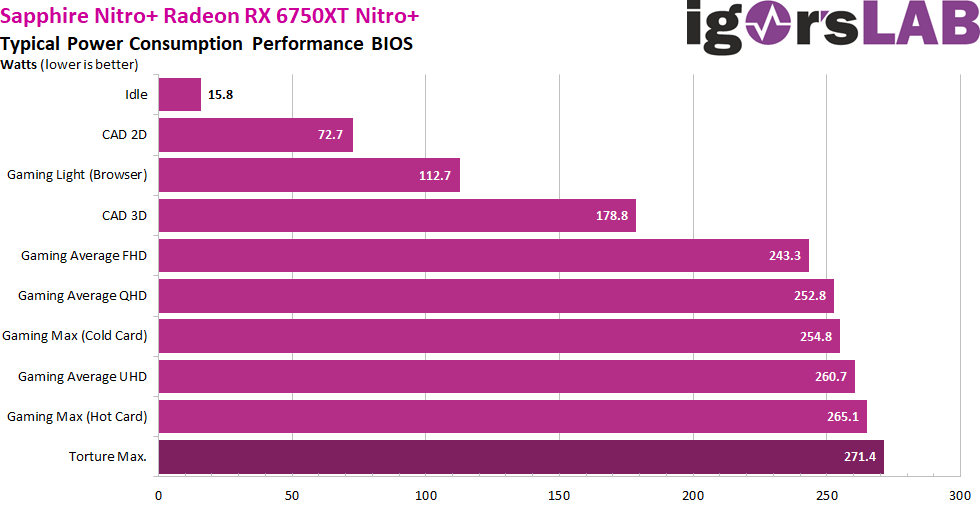
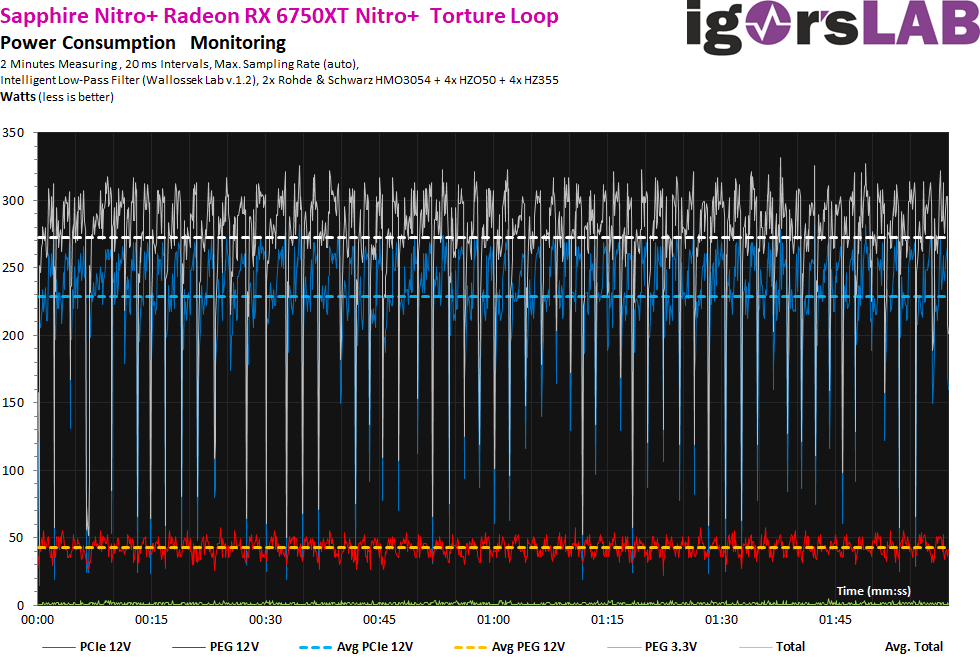
Let’s start with the individual loads and the resulting power consumption in each case. I’m mapping the much hungrier Performance BIOS here, whereas the Silent BIOS remains up to 40 watts more frugal when the card is warmed up! We just had that with gaming. However, the difference from cold to hot card is also quite high at 10 watts. The almost 16 watts in idle are at the expense of the microcontroller and LED, the rest is as usual in terms of gradation. With up to 270 watts, the card is not costly, but it is still much more frugal than MSI’s competitor, which is hardly faster.
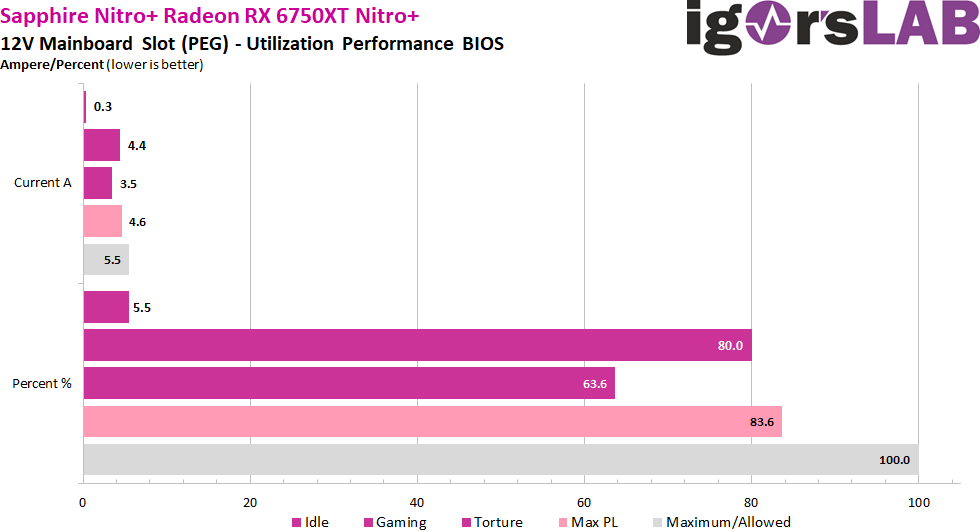
Compliance with standards at the motherboard slot (PEG)
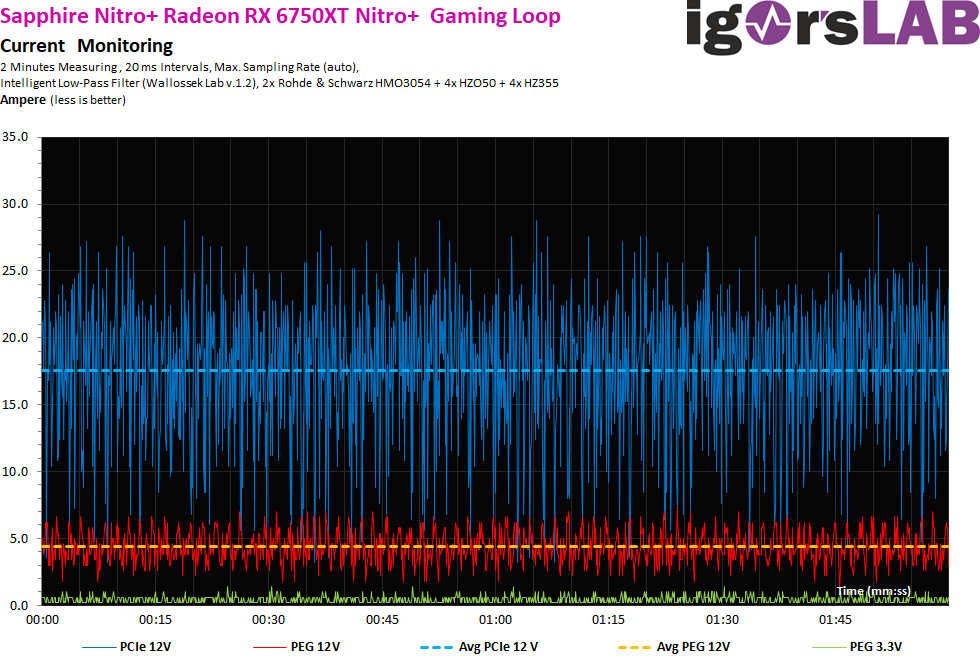
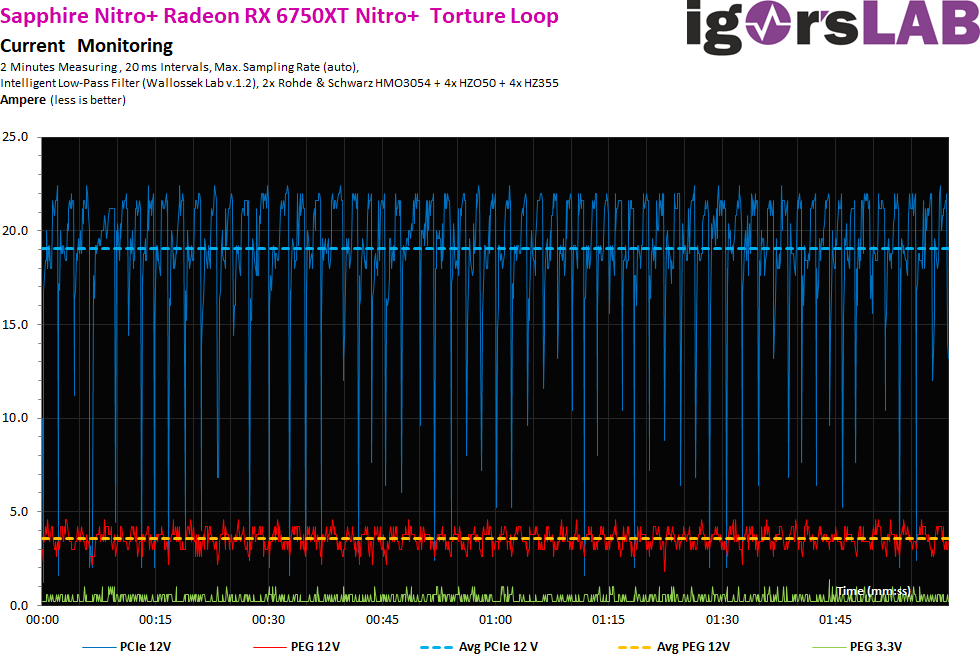
Let’s now look at the load of the motherboard slot, which is specified by the PCI SIG as 5.5 amps. This results in a maximum power of 66 watts at 12 volts. You can see very clearly that exactly 3.5 to 4.4 amps are reached under normal load, which is absolutely exemplary. This also applies to the up to 4.6 at maximum load with OC, because there is still an extremely large margin left here.

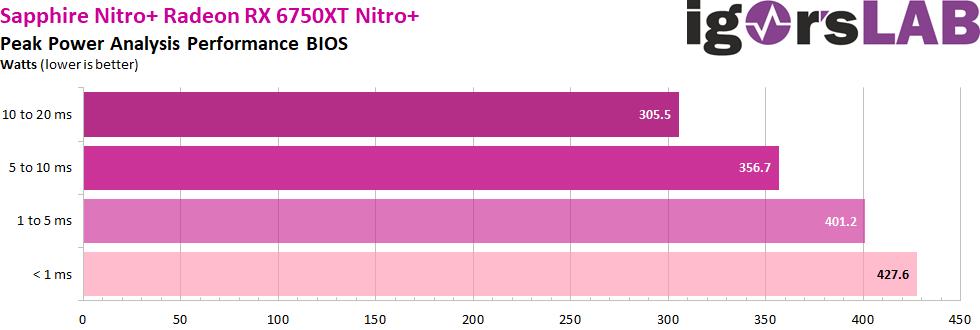
Load peaks (transients) and power supply recommendation
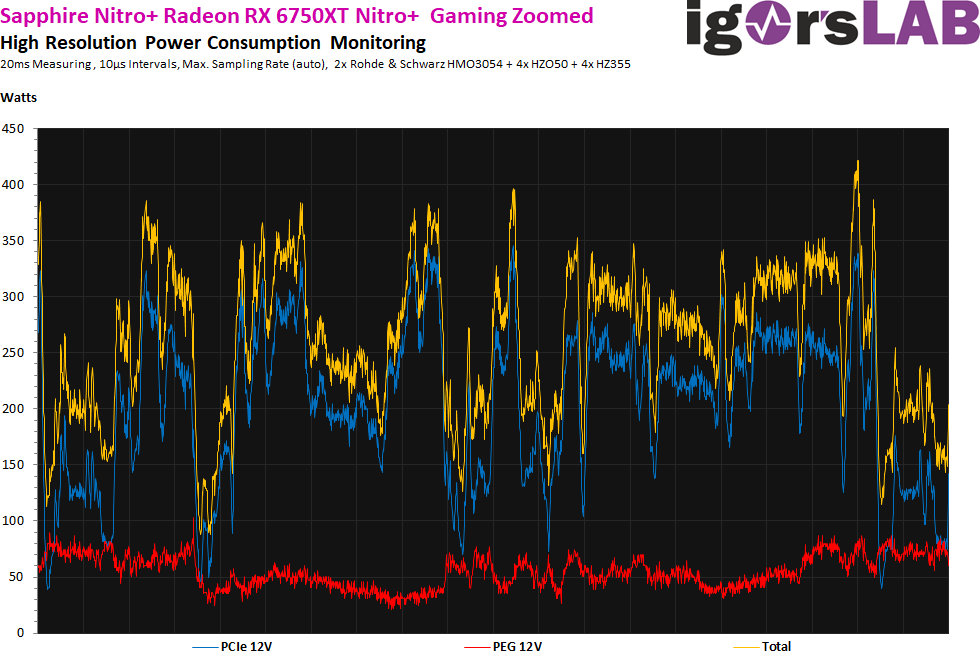
As I have already demonstrated in detail in my basic article “Der Kampf von Grafikkarte gegen Netzteil – Leistungsaufnahme und Lastspitzen entmystifiziert”, higher loads in the millisecond range do exist for short periods of time, which can lead to inexplicable shutdowns if the power supply units are not properly designed or equipped. The TBP (Typical Board Power) measured by the graphics card manufacturer or the reviewers is not really helpful for a stable system design. Peaks with intervals between 1 and 10 ms can lead to shutdowns in very fast-response protection circuits (OPP, OCP), especially in multi-rail power supplies, although the average power consumption is still within the norm.
For the card, I would calculate with at least 350 watts proportionate to the system’s total power consumption on the secondary side in order to have enough reserves for the worst case scenario. If the 15% power limit is fully utilized, there would be peaks of 400 watts to consider.
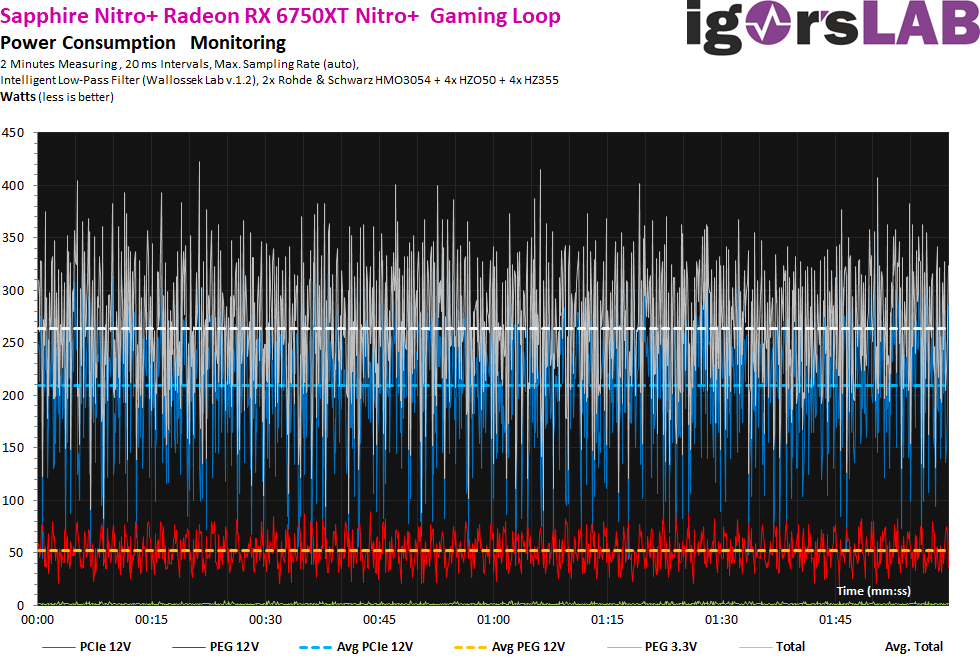
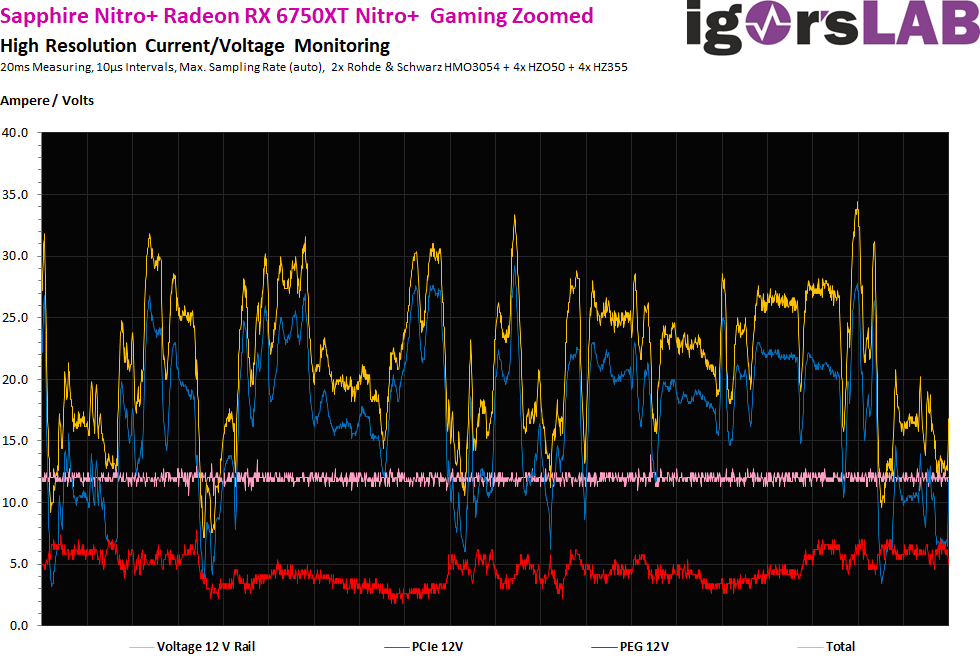
Transients as detail graphics in different resolutions during gaming and stress testing
Now let’s compare the detailed graphics with the many spikes:
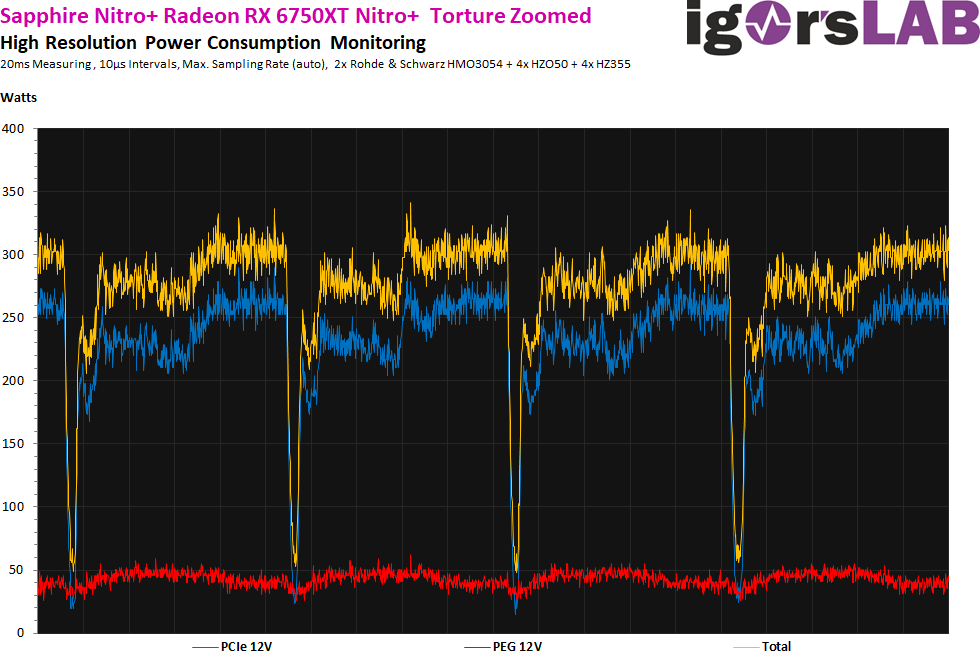
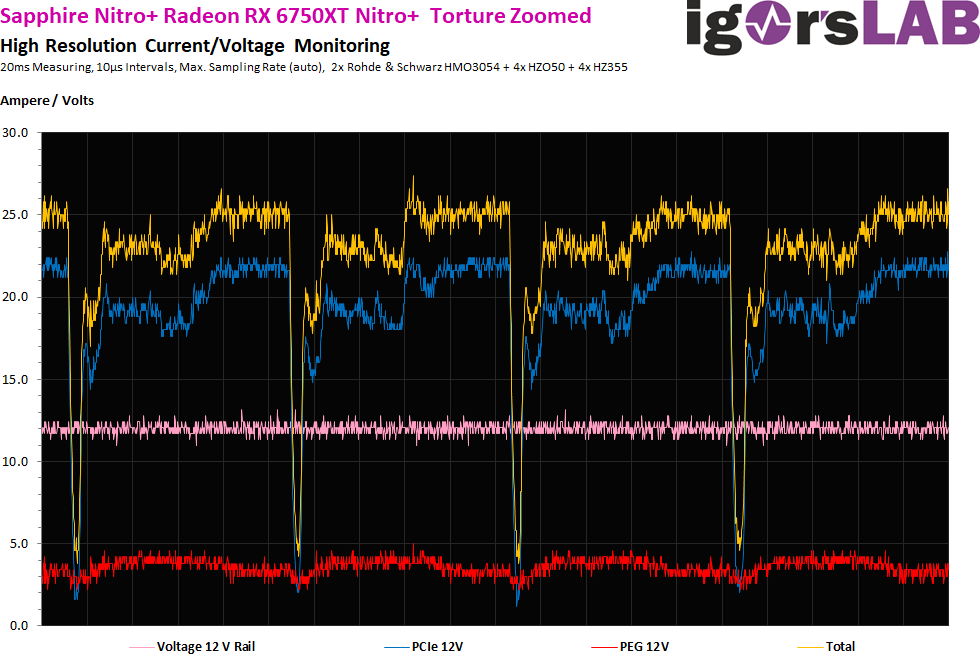
This applies to the same extent, if not even more extreme, to the stress test. There are suitable measurements for this as well:
A short excerpt with higher resolution now shows us the 20-ms measurements (10 μS intervals), as I run them automatically to determine the value. First, let’s start with gaming again:
During the stress test, the downregulation of the telemetry can be seen well in the small intervals.

- 1 - Introduction, Unboxing, Technical Details
- 2 - Teardown: PCB, Voltage Converters and Cooler
- 3 - Gaming Performance
- 4 - Gaming Power Consumption and Efficiency
- 5 - Power Consumption, Load Peaks and PSU Recommendation
- 6 - Temperatures and Clock Rates
- 7 - Fan Curves and Noise
- 8 - Summary and Conclusion


35 Antworten
Kommentar
Lade neue Kommentare
Veteran
Veteran
Mitglied
1
Veteran
Veteran
Urgestein
Urgestein
Urgestein
Veteran
Mitglied
Veteran
Mitglied
Mitglied
1
Veteran
Veteran
Alle Kommentare lesen unter igor´sLAB Community →