


Important preliminary remark
We’ll do the same with the benchmarks today as we did in the previous launch review. This is important because in the sum of all games, the peculiarities of the respective architectures quickly blur. In the end, there are only 10 specially selected games, but I chose them as examples from over 20 titles and the pre-tests with several cards, because the result was almost exactly the same in the end. The weighting between the titles with pure raster graphics without DXR and with DXR was done in a ratio of 6:4, with the four DXR titles being very different.
Full ray tracing fun in Cyberpunk 2077, combined with more mid-range effects like in Metro Exodus EE and the hybrid implementation of lighting all the way to Marvel’s Guardians of the Galaxy and Shadow of the Tomb Raider, where ray tracing really only comes into play humanely. DXR is being implemented in more and more games and the current engines almost all allow it by now. From this point of view, it would be just as unfair to completely abandon such titles as it would be to use them exclusively with DXR. Since every user has different preferences and some prefer to do without DXR completely (why actually?), I accommodate all target groups a bit for once.
Sum of all games
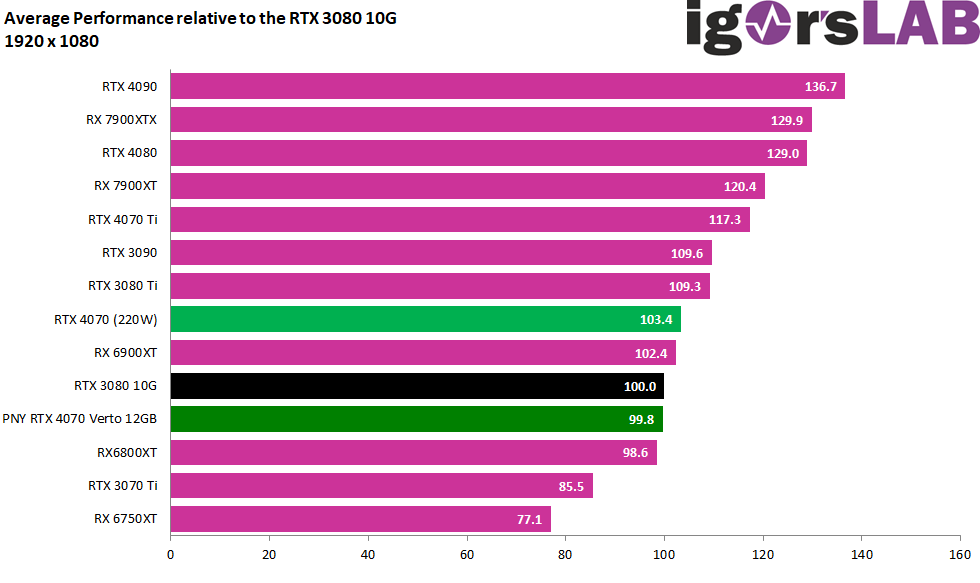
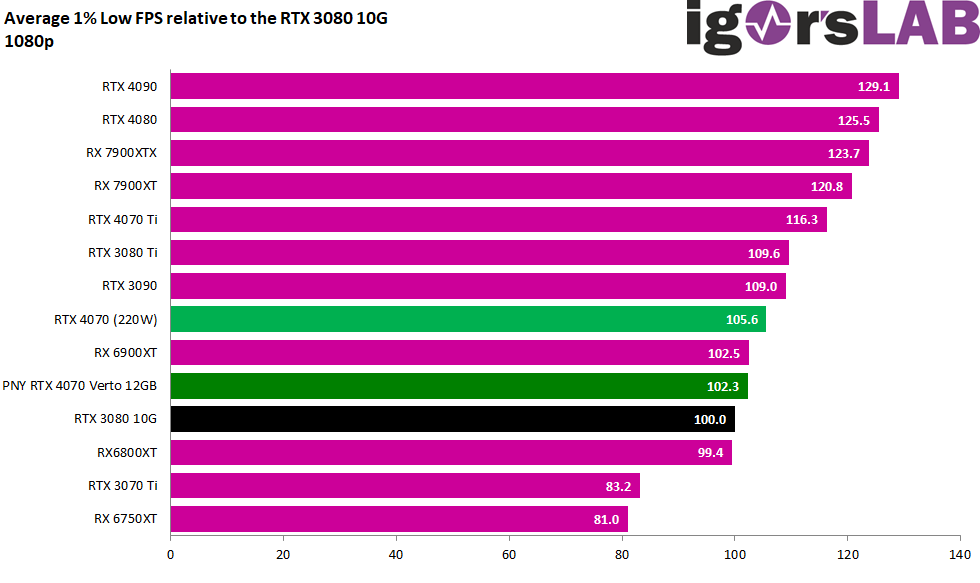
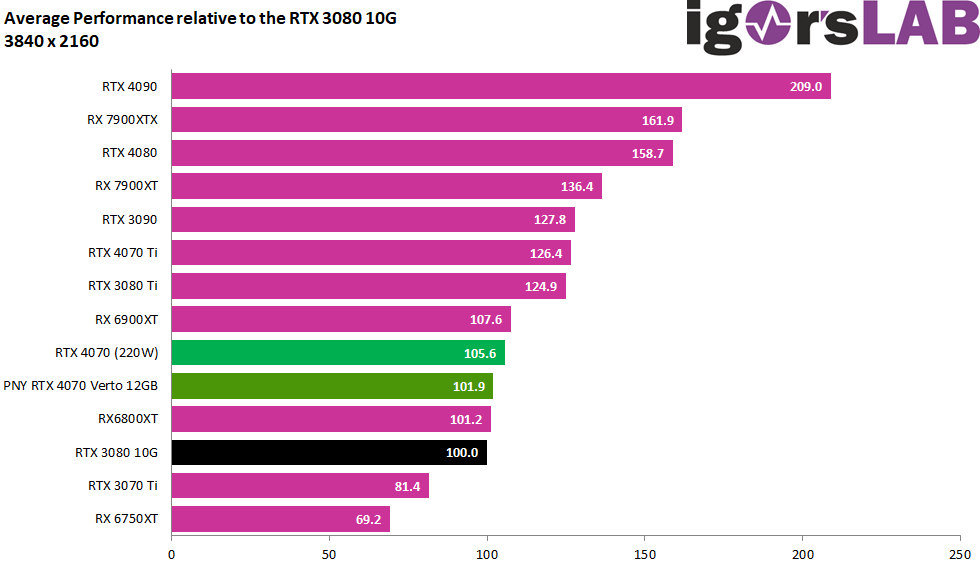
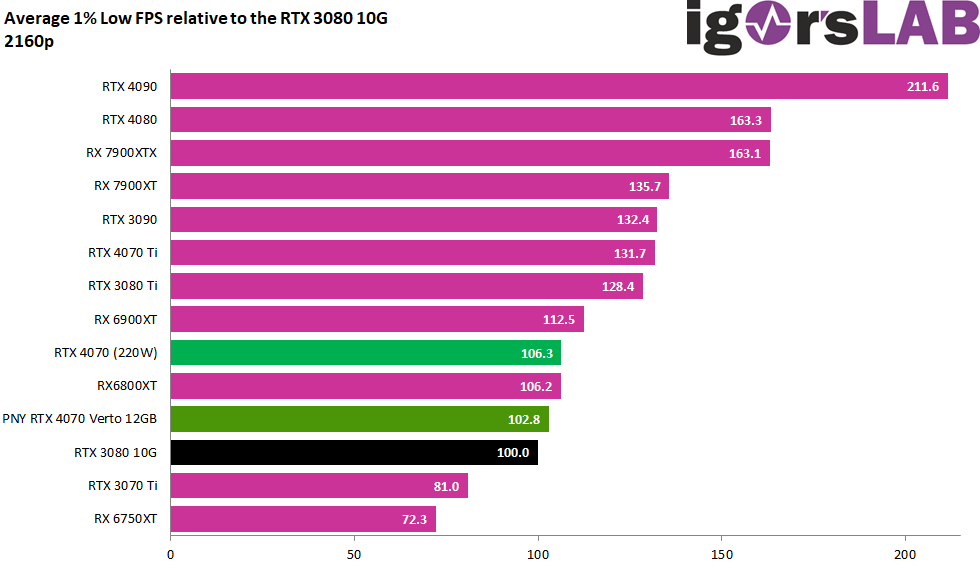
To play reasonably performant games, even the 200 watts are easily enough, because you can even reach a GeForce RTX 3080 10GB, of course depending on the game and resolution. That’s the good side. However, the up to 15 watts more of an overclockable card would certainly still be money well spent, because the energy could be converted into more some performance in some situations, such as DLSS, when the tensor cores are also fully utilized. However, the advantage in terms of screening performance is much smaller. However, the effects of the higher power consumption are also more noticeable in the Min FPS than in the pure Average. But you will not necessarily need it.
I normalized the FPS and percentiles and made a geometric mean (Geomean) because this is simply more accurate statistically and is also how it is done in the industry. We compare the average OC cards with around 215 to 220 watts of power target with the non-overclocked card. This fully covers all “MSRP cards” and the so-called OC cards. I already wrote it on the first page: all cards are the same and because of the small tolerance range, two benchmark runs are enough to show everything.
Full HD (1920 x 1080 pixels)
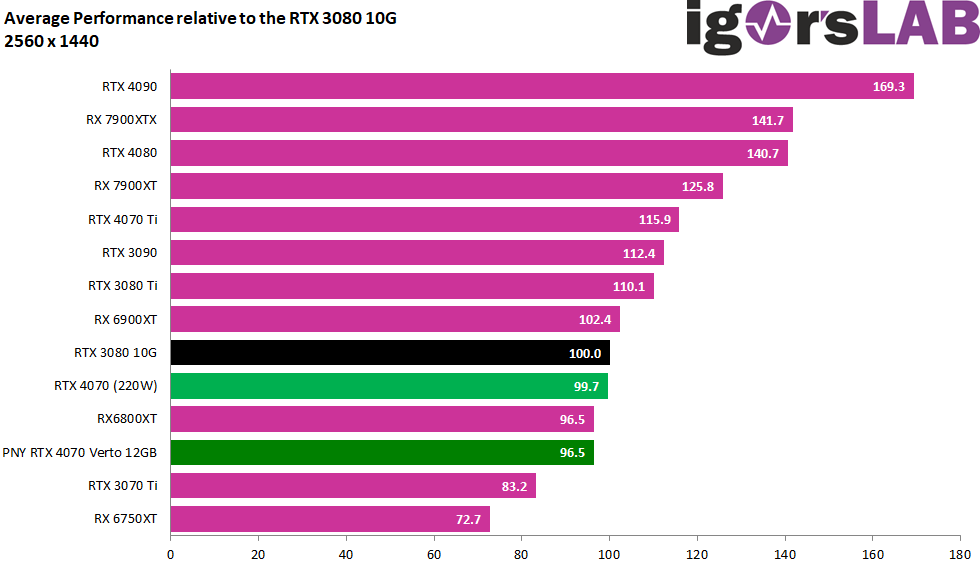
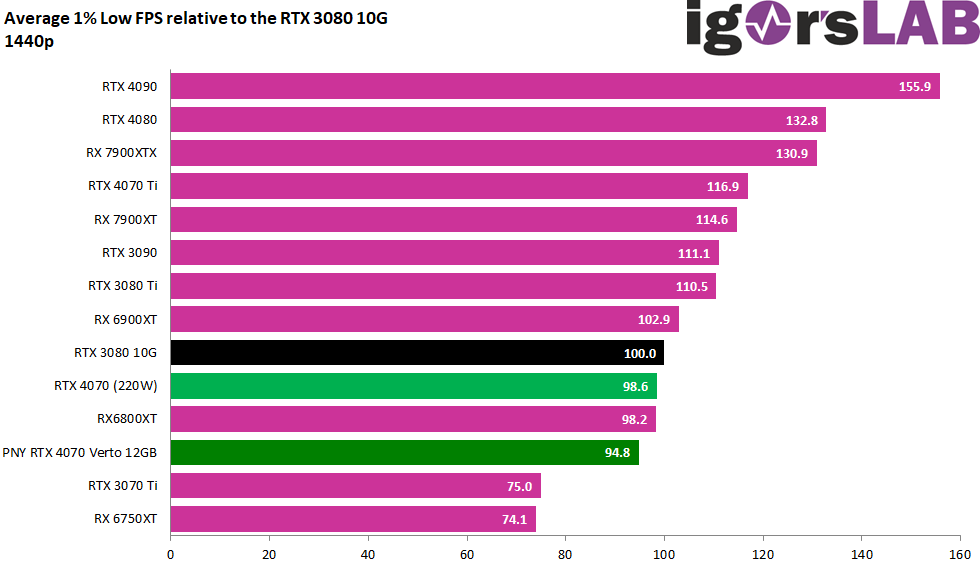
WQHD (2560 x 1440 pixels)
Ultra HD (3840 x 1440 pixels)
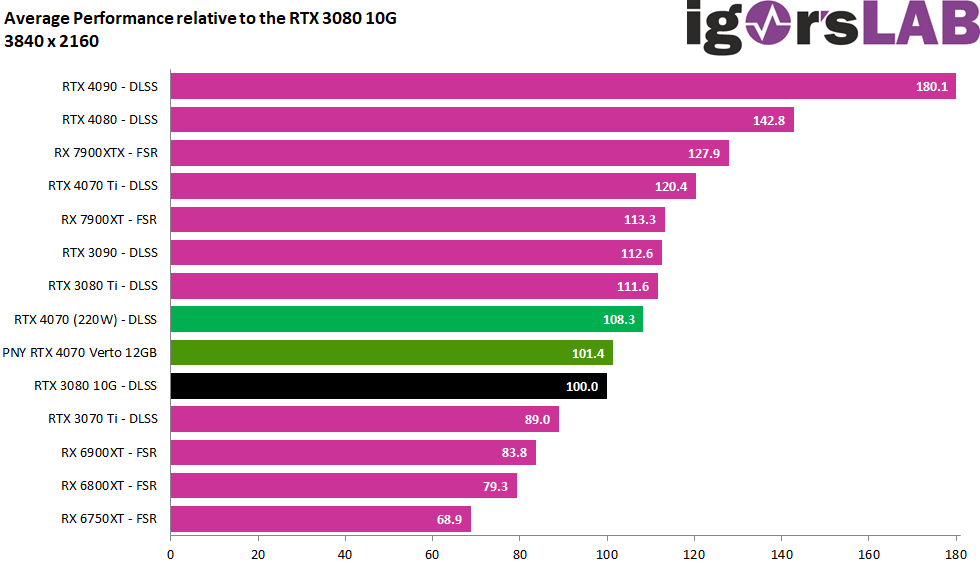
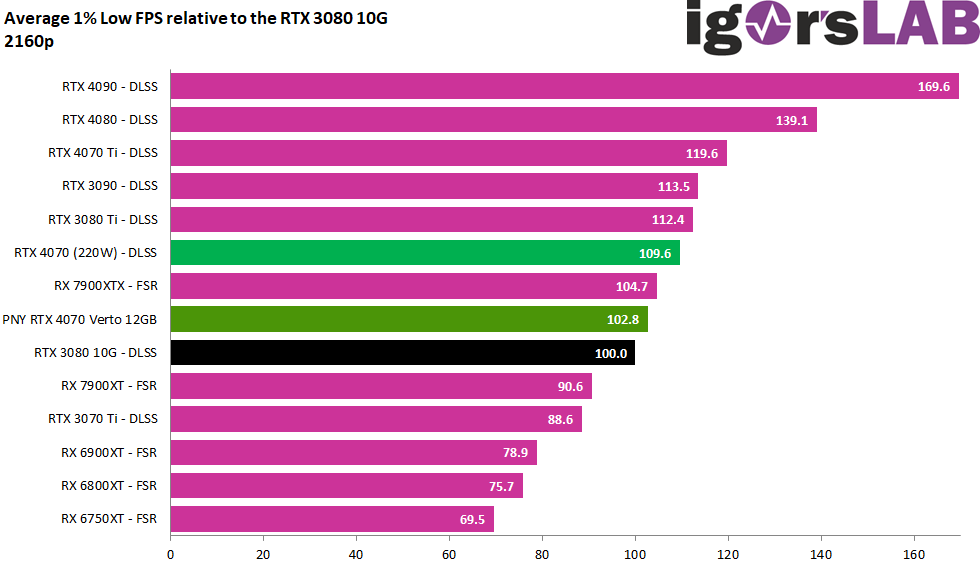
Ultra HD and DLSS/FSR (3840 x 1440 pixels)
Interim summary
The GeForce RTX 4070 is an excellent card in Full HD when it comes to highest frame rates and is also well suited for WQHD. However, smart upscaling will have to be considered in Ultra HD at the latest, and that’s where DLSS comes into play. Meanwhile, games like “The Last of Us Part 1” (TLOU) even subjectively look better in Ultra HD with DLSS than native Ultra HD. NVIDIA can definitely use its advantages here, which DLSS 2.x also offers purely optically. However, if a game supports DLSS 3.0 and you would be stuck in the unplayable FPS range without Super Sampling, then this can even be the lifeline to playability. You can’t improve latencies with it, but not every genre is as latency-bound as various shooters. For TLOU, I would have liked to see DLSS 3.0, but you can’t have everything.
- 1 - Introduction, technical data and technology
- 2 - Test system and the igor'sLAB MIFCOM PC
- 3 - Teardown: PCB, components and cooler
- 4 - Gaming Performance
- 5 - Power Consumption and load balancing
- 6 - Transients and PSU recommendation
- 7 - Clock rate, temperatures and thermal imaging
- 8 - Fan curves and noise analysis
- 9 - Summary and conclusion


32 Antworten
Kommentar
Lade neue Kommentare
Urgestein
Mitglied
Urgestein
Mitglied
Urgestein
Urgestein
Mitglied
Veteran
1
Urgestein
Veteran
Veteran
1
Veteran
Mitglied
Veteran
Urgestein
Mitglied
Alle Kommentare lesen unter igor´sLAB Community →